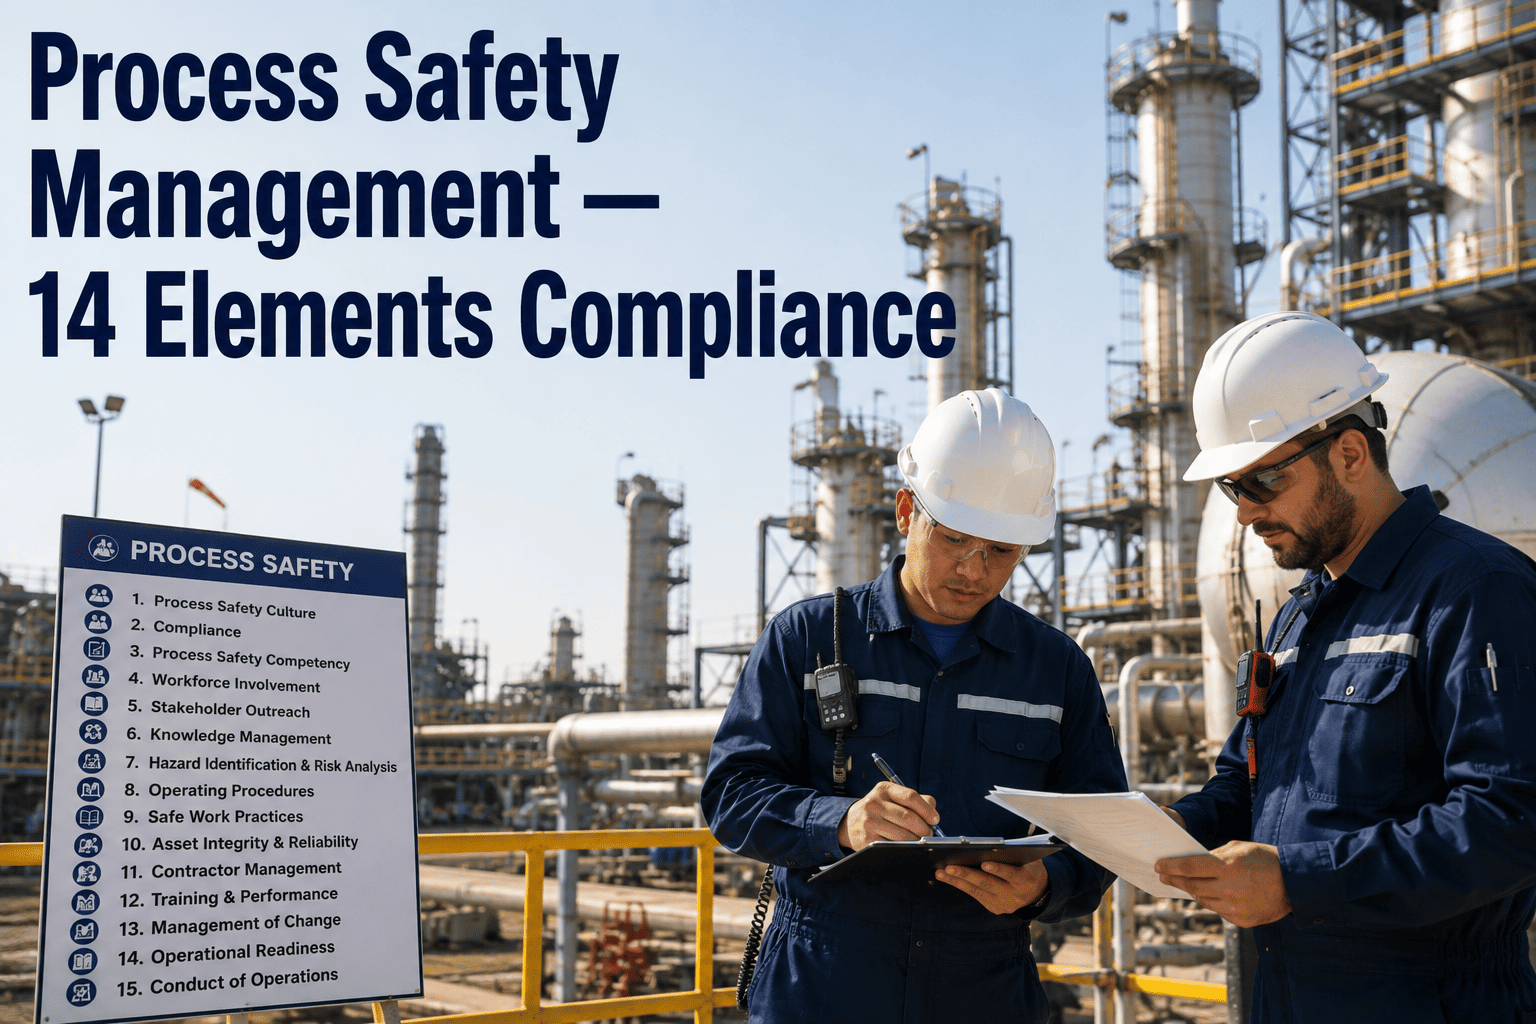
Process safety culture is the shared set of values, beliefs, and behaviors that determine how an organization actually manages process risks when nobody is watching. In oil and gas, the gap between stated safety commitments and frontline behaviors is where major incidents are born. Organizations with strong process safety cultures do not just report more near misses, they actively investigate why their systems allowed the hazard to exist in the first place, and they use that understanding to drive systemic change rather than punitive action. Most companies still assess safety culture through annual perception surveys that measure how people feel about safety rather than how the organization actually responds to process risk signals in real time. iFactory connects safety observation data, incident reports, maintenance deferrals, and management of change logs into a single culture intelligence model that reveals the behavioral patterns surveys cannot capture, and you can book a demo to see how your operational data tells a more honest story than any survey response.
PROCESS SAFETY CULTURE INTELLIGENCE
Annual Surveys Measure How People Feel — Operational Data Reveals How Organizations Actually Behave
iFactory builds a continuous process safety culture model from real operational signals, so leadership can see the behavioral gaps that traditional surveys miss and target improvement where it changes outcomes.
BEYOND PERCEPTION
What Process Safety Culture Actually Is and Why It Is Not the Same as Personal Safety
Most oil and gas organizations conflate process safety culture with personal safety culture because both fall under the same HSE umbrella. But the behaviors that prevent a slip, trip, or fall are fundamentally different from the behaviors that prevent a loss of primary containment or a catastrophic release. The distinction matters because the assessment methods, improvement strategies, and leadership behaviors that work for personal safety often fail to move the needle on process safety outcomes.
PERSONAL SAFETY CULTURE
Focused on individual behaviors like PPE compliance, housekeeping, and hazard reporting. Success is measured through injury rates, observation counts, and behavioral compliance scores. Improvement typically relies on behavior-based safety programs, peer observations, and incentive structures tied to lagging indicators.
PROCESS SAFETY CULTURE
Focused on organizational systems that prevent loss of primary containment, including how the organization handles maintenance deferrals, management of change, alarm management, shift handovers, and process hazard analysis follow-up. Success is measured through leading indicators like barrier health, MOC completion quality, and near-miss investigation depth.
MATURITY MODEL
Five Stages of Process Safety Culture Maturity
Culture does not change overnight, and pretending it does leads to superficial improvement programs that produce survey score gains without outcome changes. The maturity model below describes the progression organizations typically follow, from reactive to generative, with the behavioral signals that distinguish each stage.
STAGE 5
Generative
Process safety is embedded in business decisions. Workforce proactively identifies systemic weaknesses. Leaders seek out bad news. MOC and PHA follow-up are self-enforcing because the workforce owns the process.
STAGE 4
Proactive
Organization actively monitors leading indicators. Near-miss reports are valued and investigated for systemic causes. Maintenance deferrals are challenged with process risk context rather than production pressure alone.
STAGE 3
Calculated
Safety systems are in place but treated as compliance requirements. MOC is completed but quality varies. Incident investigation identifies root causes but corrective actions are not always verified for effectiveness.
STAGE 2
Reactive
Organization responds after incidents occur. Safety is seen as a department function rather than a line responsibility. Process hazard analyses are conducted but recommendations often languish without assignment or tracking.
STAGE 1
Pathological
Production and cost dominate all decisions. Safety rules are ignored when they conflict with schedule. Incidents are hidden or minimized. Maintenance deferrals accumulate without risk assessment.
CULTURE INDICATORS
Operational Indicators That Reveal True Culture More Accurately Than Survey Scores
Survey responses are filtered through what people believe leadership wants to hear. Operational data is not. The indicators below represent behavioral signals that iFactory tracks continuously to build an objective culture assessment without relying on self-reported perception data.
MOC Completion Without Follow-Up
High ratio signals compliance over commitment
Maintenance Deferral Overdue Beyond Risk Window
Production pressure overriding process risk controls
Near-Miss Reports With Shallow Investigation
Checking the box without understanding systemic cause
PHA Recommendations Past Due Without Escalation
Hazard analysis treated as a one-time exercise
Shift Handover Deficiency Repeat Rate
Communication gaps persisting without corrective action
SURVEY INSTRUMENTS
Safety Culture Survey Instruments Commonly Used in Oil and Gas
Surveys are not useless, but they are incomplete. The table below maps the most widely used survey instruments in the oil and gas sector alongside what they actually measure and where their blind spots are when used in isolation from operational data.
Your Survey Scores Say Culture Is Strong — Does Your Operational Data Agree?
iFactory builds a continuous culture intelligence model from MOC completion rates, maintenance deferral patterns, near-miss investigation depth, and PHA follow-up tracking to show you the behavioral reality behind perception scores.
LEADERSHIP BEHAVIORS
Leadership Behaviors That Actually Shift Process Safety Culture
Posters, town halls, and safety moments do not change culture. Culture changes when leadership behaviors consistently demonstrate that process safety is a line responsibility, not an HSE department function. The behaviors below have the strongest correlation with measurable culture improvement in oil and gas organizations, based on incident investigation findings and regulatory assessments across multiple jurisdictions.
1
Challenging Maintenance Deferrals With Process Risk Context
When a maintenance deferral request crosses the desk, leaders who ask what barriers are degraded and what the residual risk is, rather than just whether production can absorb the delay, send a clear signal that process risk is part of every operational decision.
2
Receiving Bad News Without Punitive Response
When a near miss or process upset is reported, the first leadership question determines whether the next one will be reported. If the response focuses on systemic understanding rather than individual blame, reporting frequency increases and investigation quality improves within one to two reporting cycles.
3
Visible Participation in Process Hazard Analysis
When operations leaders attend and actively contribute to PHA sessions rather than delegating to HSE staff, it signals that hazard identification is a core operational competency, not a compliance exercise to be outsourced to a safety department.
4
Holding Operations Accountable for MOC Quality
When leaders review MOC records not just for completion but for quality, including whether hazard reassessment was thorough and whether all affected procedures were actually updated, it elevates MOC from a form to be filed to a risk management tool to be executed.
WARNING SIGNALS
Healthy Culture Signals vs Warning Signs That Survey Scores Often Mask
The comparison below pairs observable organizational behaviors on each side of the culture divide. In organizations with strong process safety cultures, the behaviors on the left side are the norm. In organizations heading toward a major incident, the behaviors on the right side are present but often invisible to leadership until after the event.
HEALTHY CULTURE SIGNALS
Near-miss reports increase after leadership visibly acts on previous reports without blame
Maintenance deferrals are rejected or escalated when process risk analysis shows barrier degradation
MOC records show complete hazard reassessment with all affected procedures updated before implementation
PHA recommendations are assigned, tracked, and verified for effectiveness within defined timelines
Shift handover logs include explicit process risk status changes, not just equipment status updates
CULTURE WARNING SIGNS
Near-miss reporting declines or stagnates despite stable operations, suggesting reporting fatigue or fear
Maintenance deferral backlog grows without risk-ranked prioritization or executive visibility
MOC forms are completed but hazard reassessment sections are generic or copied from previous submissions
PHA recommendations accumulate in tracking spreadsheets with no assignment, deadline, or verification status
Shift handovers are brief and template-driven with no discussion of active process risk changes
IMPROVEMENT ROADMAP
From Assessment to Measurable Culture Change in Five Phases
Culture improvement programs fail when they jump from survey results to training rollouts without establishing the operational baseline first. The roadmap below sequences the steps that produce sustained culture change rather than temporary survey score improvements.
STEP 1
Establish Operational Baseline
Pull 12 months of MOC, maintenance deferral, near-miss, PHA recommendation, and shift handover data to build an objective culture baseline before designing any intervention.
STEP 2
Layer Survey Data On Top
Run a validated safety culture survey and compare perception gaps against the operational baseline to identify where feelings and behaviors diverge most sharply.
STEP 3
Target Highest-Impact Gaps First
Prioritize improvement interventions where operational indicators show the largest behavioral gaps and where perception data confirms the workforce sees the same problem.
STEP 4
Deploy Leader Behavior Interventions
Focus initial training and coaching on the specific leadership behaviors that address the highest-priority gaps, with observable behavioral expectations rather than abstract principles.
STEP 5
Track Operational Indicators Continuously
Monitor whether the targeted operational indicators actually shift after the intervention, using the same data sources from step one to measure real behavioral change.
READINESS CHECK
Pre-Assessment Readiness Checklist for Process Safety Culture Programs
Complete this checklist before launching a culture assessment to ensure the organization has the data infrastructure and leadership commitment needed to move beyond survey-only approaches.
01
At least 12 months of MOC records accessible with hazard reassessment quality visible in the data
02
Maintenance deferral log with risk ranking, approval authority, and overdue status tracking in place
03
Near-miss and incident investigation records with root cause depth and corrective action verification status
04
PHA recommendation register with assignment, due dates, completion status, and effectiveness verification fields
05
Executive sponsor identified who will receive and act on culture assessment findings, not just file the report
06
Shift handover records available for review with sufficient detail to assess process risk communication quality
FREQUENTLY ASKED QUESTIONS
Questions HSE Leaders Ask About Data-Driven Safety Culture Assessment
How is a data-driven culture assessment different from a traditional safety climate survey?
A safety climate survey captures how people perceive the organization at a single point in time, which is valuable but susceptible to response bias and disconnected from actual behavior. A data-driven culture assessment uses operational records like MOC completion quality, maintenance deferral patterns, near-miss investigation depth, and PHA recommendation follow-up rates to measure how the organization actually behaves day to day. When you layer survey perception data on top of this operational baseline, you can see exactly where feelings and behaviors diverge, which is where the real culture gaps live.
Book a demo to see what your operational data reveals about your culture.
Can we use our existing survey instrument alongside the iFactory culture model?
Yes, iFactory does not replace your existing survey instrument but rather provides the operational data layer that surveys cannot capture. You continue using whatever validated survey tool your organization prefers, whether that is the Energy Institute toolkit, a custom safety climate survey, or a SEMS culture indicator assessment. The operational culture model ingests data from your existing systems to build a continuous behavioral baseline that gives context to whatever survey results you generate.
Contact support to discuss integration with your current survey approach.
How long does it take to build an initial operational culture baseline?
The initial baseline typically takes 4 to 6 weeks to assemble, depending on the accessibility and quality of your existing MOC records, maintenance management data, incident investigation files, and PHA recommendation registers. The process involves connecting to these data sources, mapping the culture-relevant fields, and calibrating the indicator thresholds to your operational context. Once the baseline is established, the model updates continuously as new data flows in from your existing systems.
Book a demo to get a timeline estimate based on your data maturity.
What happens if the operational baseline reveals problems leadership did not expect?
That is precisely the value of an operational baseline. Survey-only approaches often confirm what leadership already suspects or wants to believe, because the data is filtered through human perception. Operational data does not filter itself, so it frequently reveals behavioral patterns like MOC quality degradation, maintenance deferral accumulation, or PHA recommendation neglect that were invisible to leadership because no one was looking at the data in an integrated way. iFactory presents these findings in a structured format that connects each gap to a specific improvement lever rather than just flagging problems.
Contact support to discuss how findings are presented and acted on.
How do we measure whether the culture improvement program is actually working?
The same operational indicators used to build the initial baseline become the tracking metrics for improvement. If the intervention targets maintenance deferral behavior, you track whether deferral overdue rates and risk-ranked escalation frequency shift over the next 3 to 6 months. If it targets MOC quality, you track whether hazard reassessment completeness and procedure update rates improve. Survey scores can be used as a secondary confirmation, but the primary measure of success is whether the operational behaviors that define culture actually change.
Book a demo to see how improvement tracking works in the platform.
Stop Measuring Culture With Questions Only — Start Measuring It With Data
iFactory gives your HSE and operations leadership a continuous process safety culture model built from the operational records that reveal how your organization actually manages process risk every day. Book a demo to see your culture baseline built from your own data.