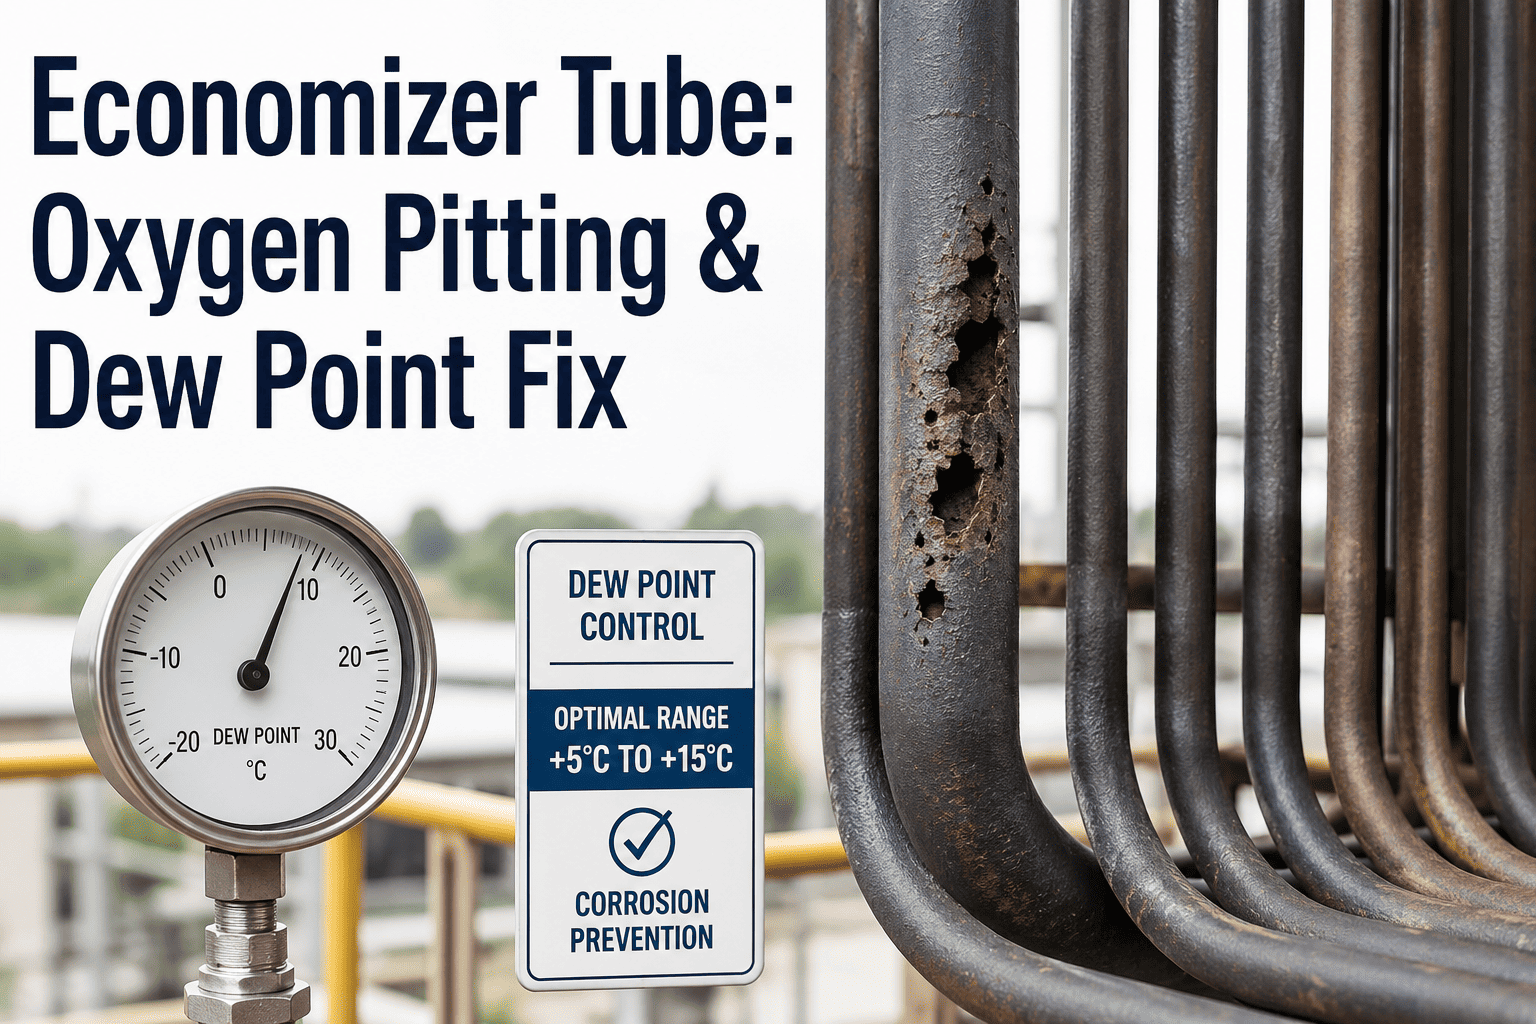
An economizer looks like the quiet part of a boiler — a bank of tubes recovering heat from flue gas before it exits the stack, with no burner flame, no drum-level swings, and nothing that draws attention on a control room screen. That quietness is exactly why economizer tube failures catch plants off guard: oxygen pitting eats through the waterside wall from the inside, acid dew point corrosion attacks the gas side from the outside, and fly ash erosion thins whatever wall is left at every bend, and none of it shows up as an alarm until a tube ruptures during startup or a hydrotest finds a leak nobody expected. Reliability teams that track wall thickness and feedwater chemistry as leading indicators, rather than waiting for a forced outage, are the ones who catch these three mechanisms early enough to Book a Demo and see how a connected inspection program flags them before they do.
Most boiler tube failure statistics group economizers with the rest of the pressure parts, which hides an important fact: economizer tubes are attacked from both sides simultaneously in a way superheater and waterwall tubes typically are not. The inside surface sees whatever oxygen escaped the deaerator, and the outside surface sees flue gas cooling down toward the point where sulfuric acid starts condensing out of it. A tube can be losing wall thickness from both directions at once, and neither mechanism looks anything like the other under a microscope, which is exactly why a single inspection method never catches both.
Dissolved oxygen that survives mechanical and chemical deaeration attacks the tube's internal surface, producing deep, well-defined pits rather than general wall thinning. Damage concentrates at the economizer inlet and at tube weld seams, and it accelerates sharply whenever a unit sits idle with stagnant, oxygenated water trapped inside the tubes during a poor shutdown.
Sulfur trioxide in the flue gas combines with moisture to form sulfuric acid, which condenses onto any tube surface running cooler than the acid dew point — typically in the 212°F to 300°F range depending on SO3 concentration. Wherever fly ash has built up, the deposit behaves like a sponge that holds both the moisture and the acid against the metal, especially during shutdown and startup cycles.
Fast-moving fly ash particles in the flue gas stream physically abrade the tube's outer surface, with damage concentrating wherever gas flow accelerates or changes direction — flow disturbance points, tube bends, and lanes directly in line with sootblowers. Erosion thins the wall gradually until it intersects with corrosion damage already working from the same side.
Boiler tube failures remain one of the leading causes of forced outages across the power and process industries, and economizers contribute a disproportionate share because they combine the two corrosion mechanisms above with the highest thermal stress cycling in the pressure part train. The numbers below are what usually convince a reliability team that economizer tubes deserve their own inspection plan instead of riding along with the general boiler tube program.
An economizer is not one uniform surface — it is a run of tubes with a feedwater inlet, a hairpin bend section, a gas-side inlet where flue gas is hottest, and a gas-side outlet where flue gas has cooled closest to the acid dew point. Each of the three failure mechanisms has a favorite zone, and knowing which zone you are inspecting changes what you should be looking for.
Coolest waterside tubes, first exposed to any residual dissolved oxygen. Pitting here is often the deepest and most localized anywhere in the bank.
Flow direction changes accelerate fly ash particles and steam-water mixtures, thinning the outer radius while weld seams remain vulnerable to internal pitting.
Hottest flue gas contact, generally above the acid dew point, so this zone is dominated by fly ash erosion rather than acid condensation.
Flue gas has cooled closest to the acid dew point here, making this the zone most likely to show sulfuric acid condensation and ash-sponge corrosion.
Because oxygen pitting and dew point corrosion attack from opposite sides of the same tube wall, a complete inspection program has to combine waterside methods, gas-side methods, and the chemistry data that predicts both. None of these three groups substitutes for the other two.
Cutting a representative section from the inlet header area for lab examination remains the most conclusive way to confirm pit depth and distinguish pitting from general corrosion.
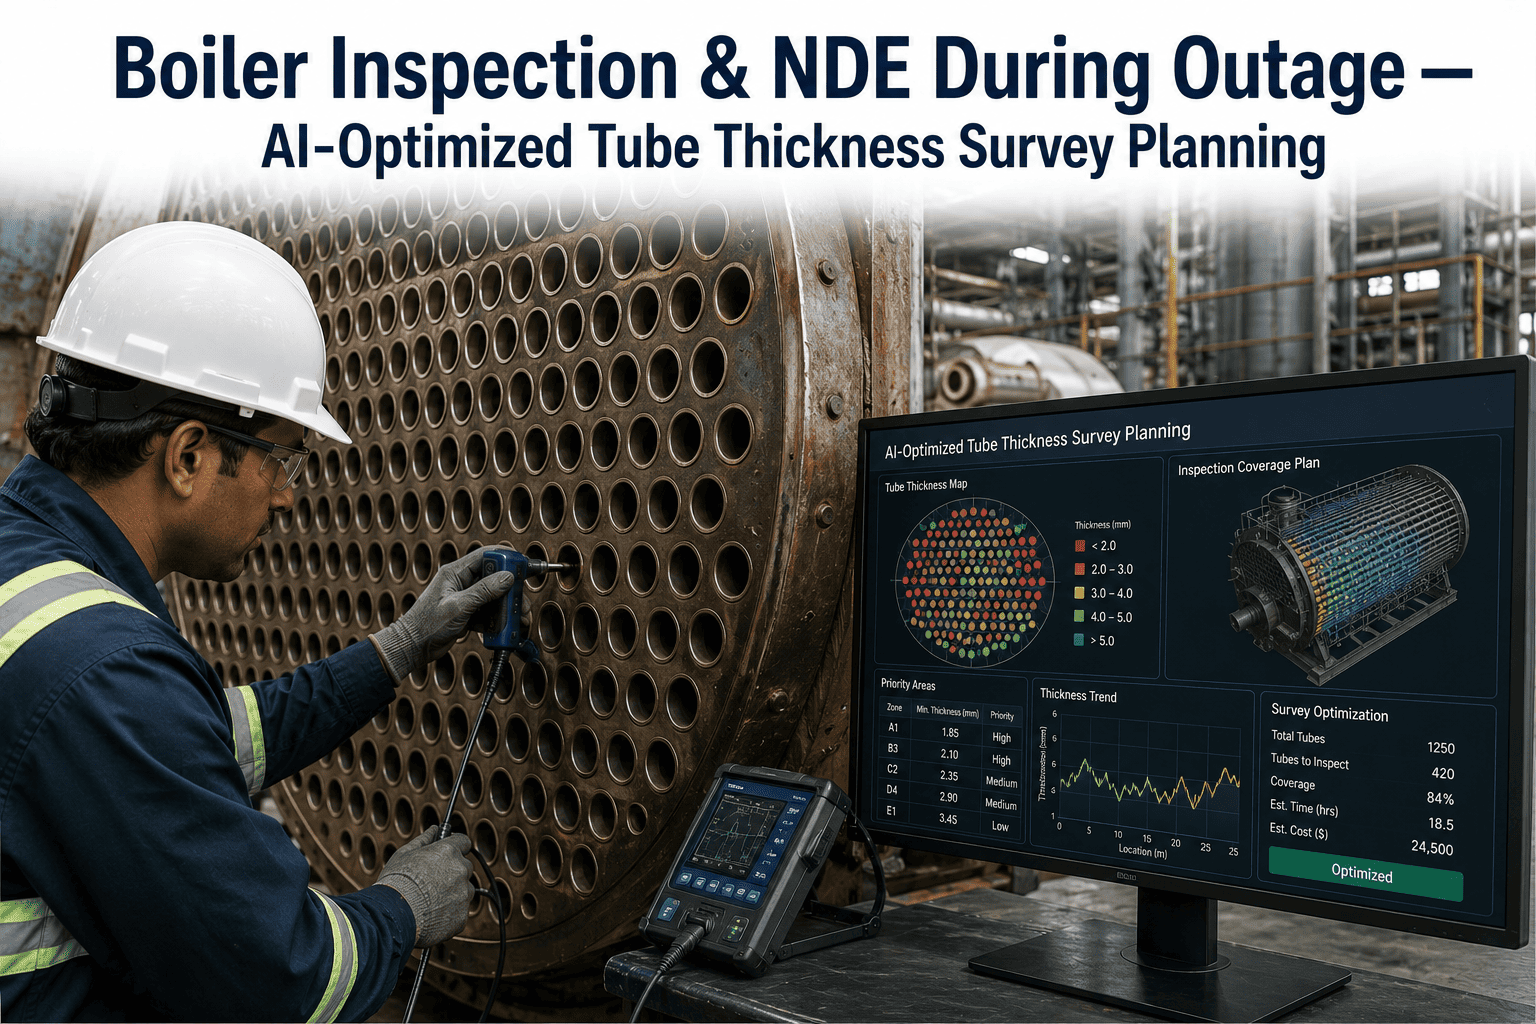
Ultrasonic thickness readings taken at the inlet, at weld seams, and along the first several rows of tubing establish the baseline against which future readings get trended.
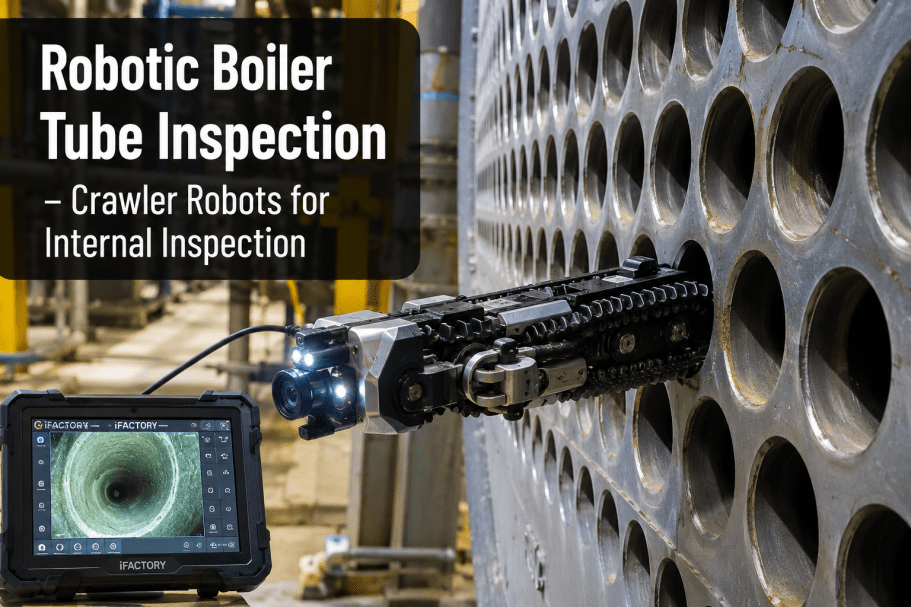
Internal video access at header openings identifies pit clustering and confirms whether damage is concentrated where poor shutdown practices left stagnant water sitting in the tubes.
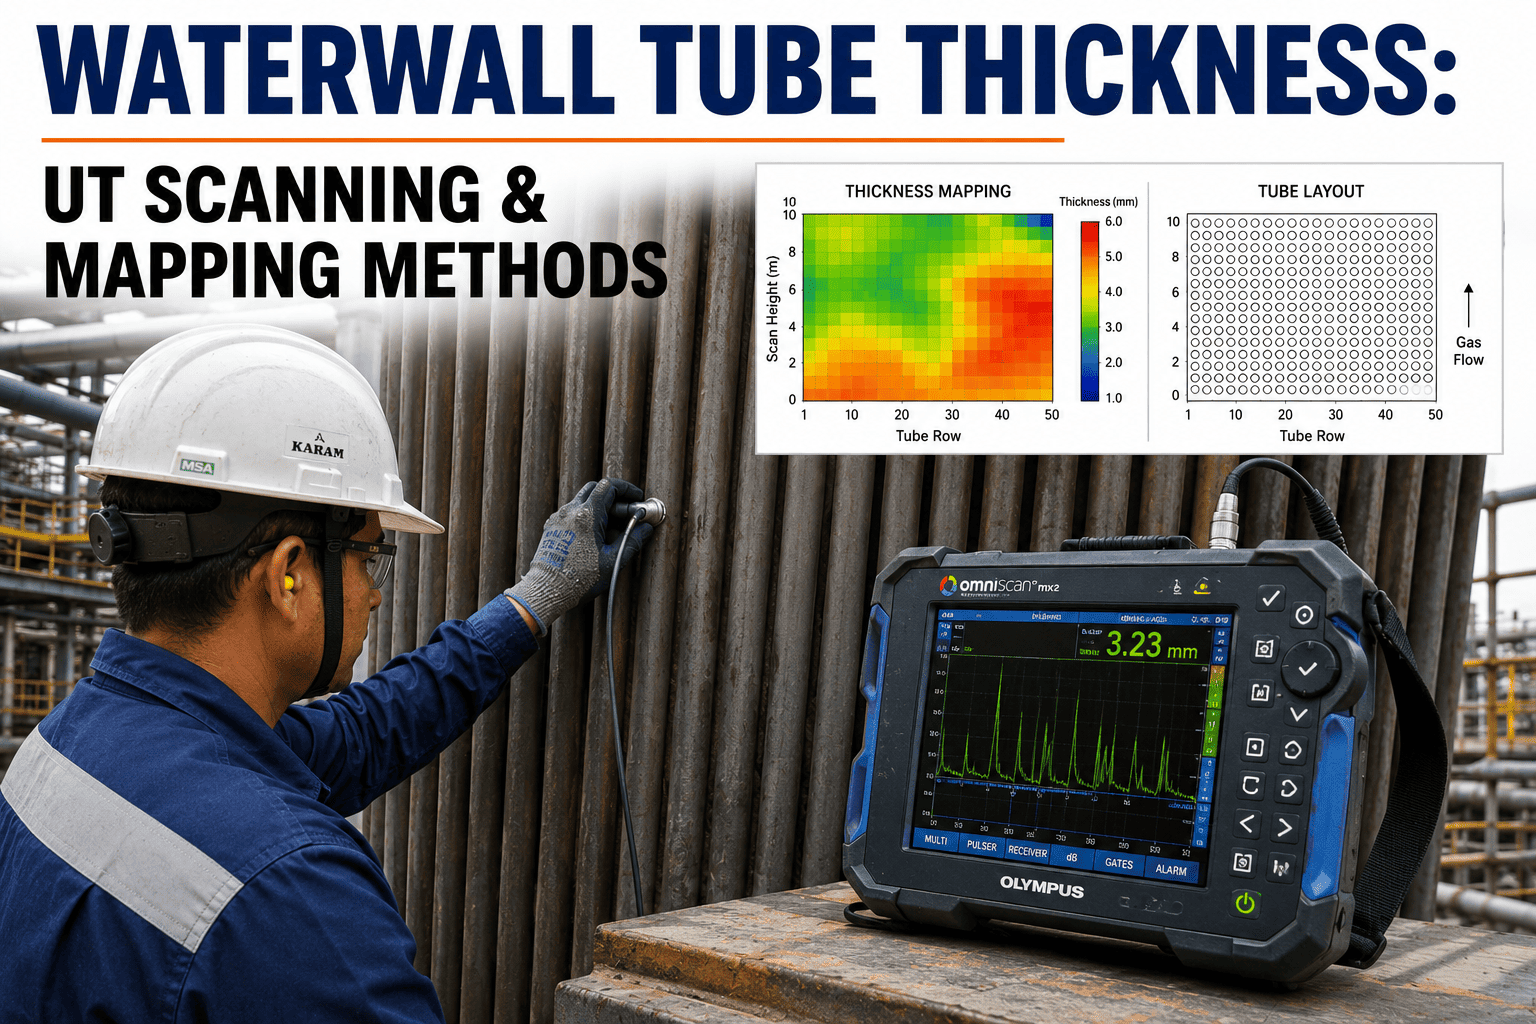
UT readings on the outer surface at the gas-side cold end and around hairpin bends track combined erosion and acid corrosion loss separately from waterside pitting.
Lab analysis of fly ash deposits for sulfate and iron sulfate content confirms whether acid dew point condensation is actively occurring beneath the ash layer.
Tracking gas temperature at the economizer outlet against the calculated acid dew point shows how much margin actually exists before condensation begins.
Continuous DO readings downstream of the deaerator catch the trace oxygen levels — even a few parts per million — that drive pitting over months of exposure.
Oxygen scavenger residual, typically catalyzed sodium sulfite, confirms whether the chemical deaeration step is actually neutralizing the oxygen that mechanical deaeration missed.
Logging how each outage was laid up — wet or dry, nitrogen blanketed or not — links pitting findings back to the shutdown practices most likely to have caused them.
A method that confirms oxygen pitting will not tell you anything about acid dew point corrosion, and the reverse is equally true. Planning an outage scope means picking methods that actually target the mechanism suspected at each location.
| Damage Mechanism | Primary Location | Best Detection Method | Confirms |
|---|---|---|---|
| Oxygen Pitting | Feedwater inlet, weld seams | Tube sampling + internal UT | Pit depth, clustering pattern |
| Acid Dew Point Corrosion | Gas-side cold end | External UT + ash sulfate sampling | Active acid condensation |
| Fly Ash Erosion | Bends, sootblower lanes | External UT profile mapping | Localized wall thinning rate |
| Caustic Gouging | Steaming zones under deposit | Tube sampling + deposit analysis | Caustic concentration under scale |
| Stress Corrosion Cracking | High-stress weld areas | Surface eddy current or PT | Crack initiation, not just wall loss |
Economizer damage rarely announces itself with a single obvious symptom. It shows up as a pattern across chemistry logs, thermal performance, and prior inspection findings that, taken together, point toward one of the three mechanisms above.
Even a gradual upward drift in DO readings after the deaerator, without an obvious equipment fault, is worth escalating before it shows up as pitting at the next tube sample.
A steady decline in economizer outlet gas temperature, often chased for efficiency gains, can push tube metal temperature below the acid dew point without anyone tracking the margin.
Any extended shutdown where tubes were left full of untreated water without a nitrogen cap is a documented oxygen pitting risk, regardless of how the unit performed beforehand.
Lab results showing elevated sulfate or iron sulfate content in fly ash sampled from the cold end are a direct signal that acid condensation is already underway.
UT readings that show thinning concentrated at hairpin bends rather than spread evenly across the tube run point toward erosion rather than general corrosion.
A rise in iron carried in the feedwater can indicate active pitting somewhere upstream in the economizer, well before a visual inspection would catch it.
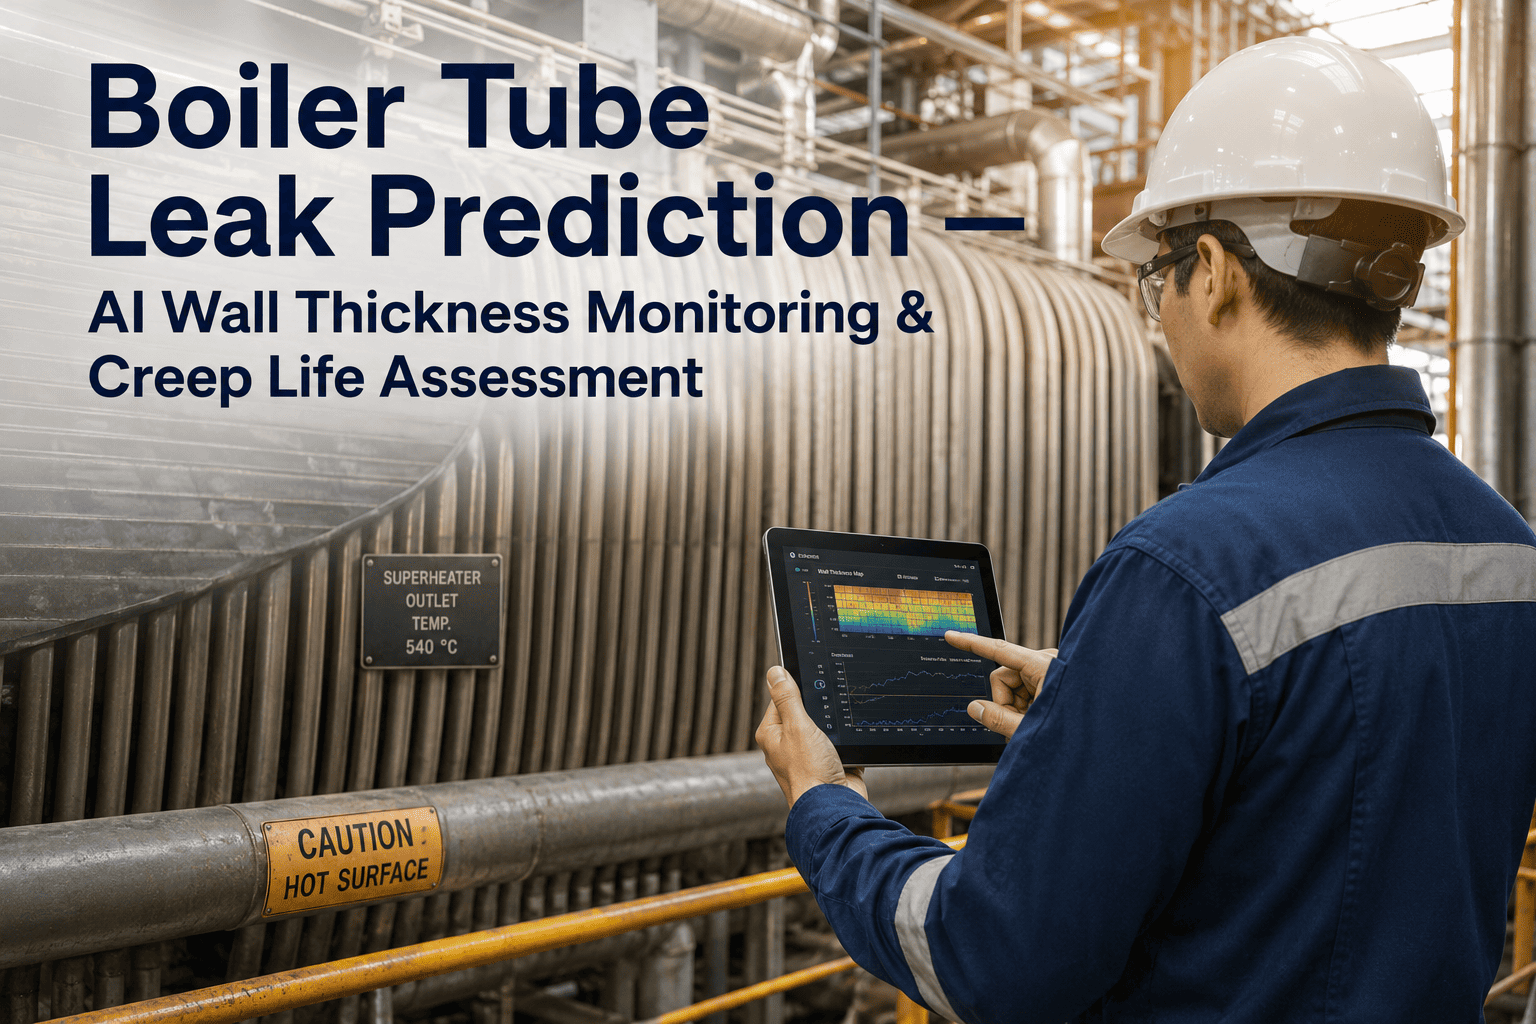
Neither oxygen pitting nor dew point corrosion happens overnight, which is exactly what makes early detection valuable — there is usually a window of months to years between the first measurable damage and an actual tube failure, but only if someone is watching the right data.
A breakdown in the passive oxide layer, driven by stagnant oxygenated water or the first acid condensation cycle, creates a small active site on the tube surface.
A potential difference forms between the small active pit and the surrounding passive metal, concentrating corrosion into a narrow, deep-walled defect rather than general thinning.
Repeated shutdown and startup cycles reintroduce oxygen or acid condensation to the same location, deepening the existing pit faster than a fresh site would form.
Remaining wall thickness drops below the minimum required for design pressure, though this stage is often only visible through UT trending, not through any external symptom.
The tube perforates, typically during a pressure or thermal transient at startup, producing an unplanned outage that a routine inspection cycle would likely have caught earlier.
Plants that have been surprised by an economizer tube failure tend to trace it back to one of a small set of recurring gaps in their inspection or operating practice.
Waterwall and superheater tubes fail from different mechanisms than economizer tubes. Folding economizer inspection into a generic boiler tube schedule usually means it gets the same UT grid pattern as tubes exposed to entirely different damage, missing the inlet and cold-end concentration points that matter most.
Lowering economizer outlet gas temperature improves heat recovery, but pushing it too close to the acid dew point trades a small efficiency gain for accelerated cold-end corrosion that costs far more in tube replacement.
Layup practice that varies by shift or by whoever is running the outage means some shutdowns leave tubes full of untreated, oxygenated water while others do not, making pitting root cause analysis far harder after the fact.
DO trends, sulfite residuals, and ash sulfate results often sit in separate systems from UT and tube sampling results, so nobody connects a chemistry excursion six months ago to a pit found at the next outage.
Oxygen pitting is a waterside mechanism driven by dissolved oxygen in the feedwater attacking the internal tube surface, producing deep, localized pits concentrated at the inlet and weld seams. Acid dew point corrosion is a gas-side mechanism where sulfuric acid condenses out of flue gas onto the external tube surface once it cools below the dew point, typically at the cold end of the bank. Because they attack opposite sides of the same wall, distinguishing them requires different sampling and measurement approaches, which is exactly the kind of cross-referenced tracking a connected inspection workflow is built for — teams can contact iFactory Support to see how the two get separated in one dashboard.
Even trace dissolved oxygen in the low parts-per-million range is enough to drive meaningful pitting over an extended period, since oxygen corrosion in hot water is aggressive at concentrations far lower than most other contaminants require. Continuous DO monitoring downstream of the deaerator, paired with sulfite residual tracking, is the standard way to catch a drifting trend before it shows up as measurable pit depth at the next tube sample.
Yes, and when they do, the combined wall loss rate is usually faster than either mechanism alone. Fly ash deposits that build up at the cold end trap moisture and acid against the tube surface, while the same ash stream continues to abrade the metal as it moves through the bank. External UT profiling at these locations needs to account for both mechanisms contributing to the same thinning trend rather than attributing all of it to one cause.
UT wall thickness scanning is non-destructive and can be done at every planned outage to trend loss over time, while tube sampling — which is destructive — is typically reserved for confirming pit depth and morphology when UT or chemistry data suggests damage has reached a concerning stage. Most programs run UT on a regular interval and pull a physical sample only when trend data or a prior finding justifies the more invasive step.
Pulling together the last several outages of UT readings, current feedwater DO and sulfite trends, and any prior tube sampling results into one view is usually enough to flag whether oxygen pitting, dew point corrosion, or erosion is the dominant concern on a given unit. Teams ready to build that baseline can Book a Demo to walk through what data is needed and how quickly a risk view can be assembled.