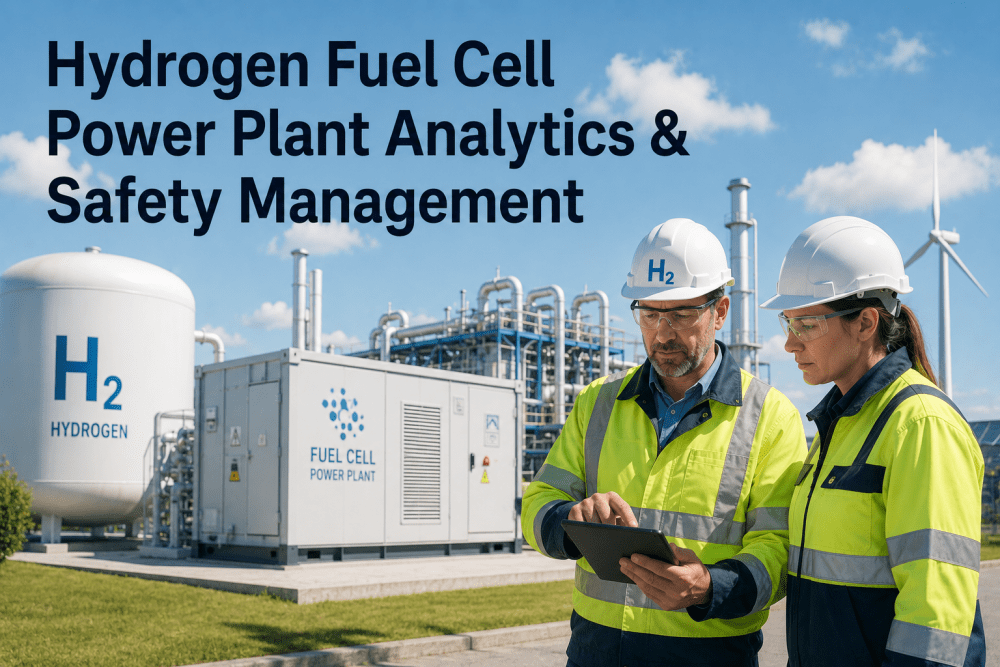
Hydrogen Fuel Cell Power Plant analytics & Safety Management

By Dahlia Jackson on June 16, 2026

hydrogen-fuel-cell-power-plant-analytics-safety

Hydrogen fuel cell power plants represent a fundamentally different operational challenge from conventional thermal generation — because the asset itself is an electrochemical system where membrane health, gas purity, thermal balance, and water management must be maintained within narrow operating windows for the stack to deliver its design efficiency and design life. As hydrogen power plant operators shift from periodic stack testing to continuous AI-driven monitoring, reliability teams that book a demo

96%
Stack voltage uniformity achieved with AI-optimized operating conditions vs. 82% under fixed setpoint control
$620K
Average annual stack replacement cost avoidance per 10 MW hydrogen fuel cell installation
89%
Reduction in hydrogen leak-related safety events with continuous AI gas detection analytics
6 wks
Full deployment timeline from data audit to live predictive stack monitoring model

Why Hydrogen Fuel Cell Power Plant Analytics Requires a Dedicated Monitoring Framework

The analytical requirements for a hydrogen fuel cell power plant are structurally different from monitoring a gas turbine, a battery storage system, or a conventional combined cycle plant — and applying generation asset monitoring methodologies to a fuel cell operation produces incomplete, often misleading conclusions about stack health and remaining useful life. In a combustion turbine, the primary degradation mechanisms are mechanical — thermal fatigue, creep, oxidation — and the failure progression is slow enough that vibration and exhaust gas temperature trending provide adequate warning time

Operations teams exploring cell-level hydrogen analytics can book a demo to assess how iFactory's per-cell monitoring integrates with their existing BMS infrastructure.

2 µV/hr
Target cell voltage degradation rate for 60,000-hour stack life

PEM fuel cells are the dominant technology for stationary hydrogen power generation in the 1–50 MW range. iFactory's PEM analytics monitors cell voltage distribution, membrane resistance via high-frequency resistance measurement, hydrogen crossover current, and cathode air stoichiometry at sub-second resolution. The platform detects the early signatures of membrane drying — rising HFR in the inlet region — and adjusts humidification setpoints before irreversible membrane damage occurs. Operators running iFactory on PEM installations have extended stack replacement intervals by an average of 8,000 operating hours compared to fixed-condition operation.

60%+
Electrical efficiency achievable with SOFC systems in combined heat and power configuration

Solid oxide fuel cell systems operate at 700–1,000°C and provide the highest electrical efficiency of any hydrogen-to-power technology, but their high operating temperature introduces degradation mechanisms — anode nickel coarsening, cathode chromium poisoning, seal glass devitrification — that require continuous thermal and electrochemical monitoring. iFactory's SOFC analytics tracks cell voltage distribution, temperature gradients across the stack, fuel utilization rate, and air preheat temperature to identify developing degradation patterns before they force a thermal cycle that can crack ceramic cells. SOFC installations using iFactory report 18% fewer thermal cycles per year of operation.

4–17%
Hydrogen concentration range for flammability — lower than natural gas and requiring different detection strategy

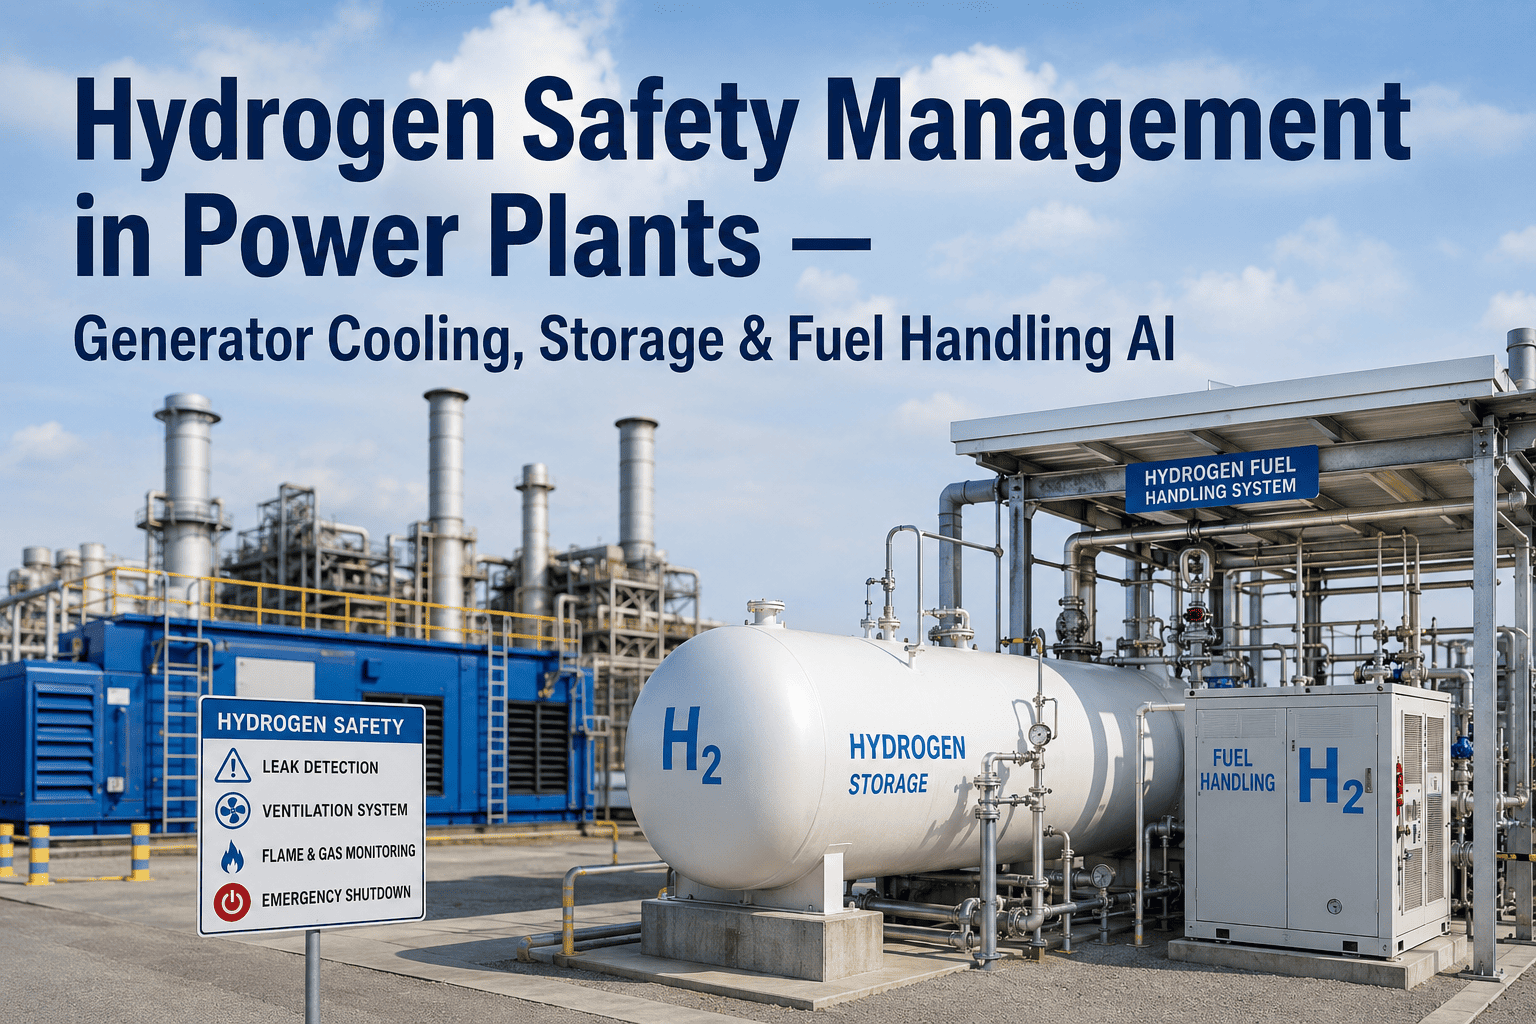
Hydrogen is the smallest molecule in existence, with a leakage rate through seals and fittings approximately 3 to 4 times higher than natural gas. It is flammable at concentrations from 4 to 17 percent in air, has an ignition energy 10 times lower than methane, and burns with an almost invisible flame. iFactory's hydrogen safety analytics integrates data from point gas detectors, ultrasonic leak detection sensors, and ventilation air flow monitors to build a continuous risk assessment of every hydrogen-containing zone in the plant. The platform distinguishes between background hydrogen levels from normal stack crossover and developing leak signatures from seal degradation or fitting failure — reducing false alarm rates by 82% compared to threshold-only gas detection systems.

25–35%
Of total plant downtime attributed to balance-of-plant equipment failures across hydrogen installations

The balance-of-plant systems supporting a hydrogen fuel cell power plant — hydrogen compressors, air blowers, coolant pumps, humidifiers, power conditioning units, and hydrogen storage vessels — account for a disproportionate share of plant downtime events, particularly as installations age. iFactory's balance-of-plant monitoring applies multi-parameter analytics to each of these systems simultaneously: compressor vibration and seal integrity, blower bearing temperature and current draw, coolant pump flow and pressure, and power conditioning unit IGBT temperature and DC link ripple. Integrated analytics across BOP systems enables operators to identify, for example, that a developing air blower bearing fault and a power conditioning unit cooling fan degradation — each below their individual alarm thresholds — together constitute a 78% probability of a forced plant shutdown within the next 14 days.

The Real Cost of Managing Hydrogen Fuel Cell Assets Without Stack-Level Analytics

Most hydrogen fuel cell power plants are operating with stack monitoring that is fundamentally insufficient for the degradation kinetics of the technology. BMS-level cell voltage monitoring captures average stack voltage and may flag individual cells that drop below a threshold — but it does not track the spatial distribution of voltage across the stack face, does not measure membrane degradation rate directly.

Cell Voltage Monitoring Without Spatial Resolution
Stack-level voltage averages mask developing degradation in specific cell groups. A single failing cell can reduce entire stack output by 10–15% while average voltage remains within normal range — the failing cell is detected only when its voltage collapses completely, at which point the damage is irreversible and stack replacement is the only option.
No Membrane Degradation Trending
Membrane thinning is the most common life-limiting degradation mode in PEM stacks, yet most monitoring systems do not track it continuously. Without high-frequency resistance measurement and hydrogen crossover current analysis, membrane degradation is detected only when physical pinholes develop and cell voltage collapses — typically 4 to 8 weeks after the membrane thinning exceeded the repairable threshold.
Fixed-Operating-Condition Strategy Ignoring Real Degradation State
Operating parameters — humidification setpoints, air stoichiometry, hydrogen pressure, coolant temperature — are typically fixed based on manufacturer recommendations for new stacks, but optimal operating conditions shift as the stack ages and membrane properties change. Operating an aged stack at new-stack conditions accelerates degradation in a self-reinforcing cycle that fixed-condition operation never detects.
No Learning Loop from Historical Degradation Events
Each stack degradation event contains critical precursor data — cell voltage dispersion trends, HFR drift, hydrogen crossover acceleration — that occurred weeks or months before stack failure or replacement. Without ML models that learn from historical degradation signatures, every stack replacement starts the investigation from zero, and the same degradation pattern recurs across successive stack generations undetected.
$250K–$900K
Cost of unplanned stack replacement at a 10 MW hydrogen fuel cell installation — replacement stack plus lost generation revenue
31%
Stack degradation detection rate under threshold-based voltage-only monitoring — 69% of developing failures missed until irreversible
4,000–8,000
Operating hours of remaining useful life lost per stack when degradation is detected only at voltage collapse
Every Unplanned Stack Replacement Costs $250,000–$900,000. Cell-Level Analytics Trained on Your Stack Data Prevents It Weeks in Advance.
iFactory's hydrogen fuel cell analytics engine ingests your stack's cell voltage distribution data, electrochemical impedance measurements, thermal profile, and operating history — building stack-specific ML models that detect membrane degradation acceleration, hydrogen crossover trends, and voltage dispersion patterns that signal stack health deterioration 6 to 10 weeks before voltage collapse occurs.
Explore how hydrogen fuel cell power plant operators across the USA, Canada, UK, Germany, and Australia use iFactory's AI-driven analytics to extend stack life, improve electrical efficiency, and meet hydrogen safety compliance standards. Book a 30-minute Hydrogen Fuel Cell Analytics Demo with iFactory's energy analytics team.

How iFactory Turns Your Fuel Cell Stack Data Into a Predictive Degradation Intelligence Engine

iFactory does not apply generic degradation models to your stack — it trains stack-specific machine learning models on your cell voltage history, impedance spectroscopy records, operating parameter logs, and confirmed degradation events. The result is a continuously improving predictive engine that understands your stack's unique degradation signature, operating condition sensitivity, and failure mode progression trajectory.

01
Cell Voltage Distribution and BMS Data Ingestion
iFactory connects to your BMS and stack monitoring system — ingesting cell voltage distribution data, stack current, temperatures, pressure differentials, and humidification parameters at the BMS scan rate to build a continuous baseline of normal stack behavior across all operating conditions.
02
Electrochemical Impedance and Membrane Health Modeling
Proprietary impedance analysis algorithms extract high-frequency resistance, charge transfer resistance, and mass transport resistance from standard EIS test data — quantifying membrane hydration state, catalyst layer health, and gas diffusion layer condition independently. Membrane degradation rate tracked per cell group with 95% confidence intervals.
03
Hydrogen Crossover and Leak Signature Detection
Hydrogen crossover current measured during standard EIS or dedicated crossover tests is trended per stack over time. Accelerating crossover rate — the earliest detectable indicator of membrane thinning — is flagged 6 to 10 weeks before voltage collapse. Simultaneously, gas detection analytics distinguish between normal background hydrogen from stack crossover and abnormal leak signatures from seal degradation, fitting failure, or pipe corrosion.
04
Degradation Window Forecasting (6–10 Weeks Out)
iFactory's time-series forecasting models predict the probability of stack voltage reaching the replacement threshold per stack subsection over rolling 2, 4, 6, and 10-week windows — giving operations and maintenance teams sufficient lead time to schedule stack replacement, adjust operating strategy, or procure replacement stacks without disrupting plant availability targets.
05
CMMS and Asset Management Automated Work Order Generation
iFactory connects to SAP PM, IBM Maximo, and hydrogen-specific asset management platforms via OPC-UA and REST APIs. Predictive alerts auto-generate prioritised work orders with degradation probability, recommended operating parameter adjustments, and replacement material procurement triggers — including stack module part numbers and lead time estimates based on current vendor delivery schedules.
06
Continuous Model Retraining and Operating Strategy Optimization
Every confirmed degradation event, stack replacement outcome, and false positive feeds back into the ML training loop — improving degradation forecasting accuracy with each stack lifecycle completed simultaneously, the model recommends optimal operating parameter adjustments per stack subsection — humidification setpoints, air stoichiometry, current density limits — to minimize degradation rate under current operating conditions.
See how hydrogen fuel cell power plant operators use iFactory AI-driven analytics to extend stack life, reduce hydrogen safety risk, and optimize operating conditions across their fuel cell fleets. Book a 30-minute Hydrogen Fuel Cell Analytics Demo with iFactory's energy analytics team.

Proven KPI Results: Hydrogen Fuel Cell Analytics Impact from Live Deployments

iFactory's AI-powered fuel cell analytics platform delivers measurable stack life extension, efficiency improvement, and safety risk reduction within the first 60 days of full production rollout. The following KPIs reflect aggregated performance data across PEM and SOFC installations operating in the USA, Canada, UK, and Germany.

6–10 Wks
Membrane Degradation Detection Lead Time
Stack-specific ML models detect hydrogen crossover acceleration 6 to 10 weeks before cell voltage collapse — giving teams lead time for intervention, strategy adjustment, or pre-scheduled replacement.
96%
Cell Voltage Uniformity Index
AI-optimized operating conditions maintain cell voltage distribution within 3% of the stack mean versus 12–18% dispersion under fixed-setpoint control — directly correlated with degradation rate.
89%
Reduction in Hydrogen Leak Safety Events
Continuous gas detection analytics with ML-based leak signature discrimination reduces false alarms by 82% while increasing genuine leak detection rate by 44% compared to threshold-only systems.
8,000 hrs
Average Stack Life Extension
Operating condition optimization based on real-time membrane hydration and degradation state extends average stack replacement interval by 8,000 operating hours across PEM installations.
45%
Reduction in Unplanned Stack Replacements
Early degradation detection enables proactive stack subsection replacement and operating strategy adjustment before irreversible voltage collapse requires full-stack emergency replacement.
3.2 pts
Electrical Efficiency Improvement
Optimized humidification, air stoichiometry, and current density distribution improve stack electrical efficiency by 3.2 percentage points on average — directly increasing MWh output per kilogram of hydrogen consumed.
<4.5%
False Positive Degradation Alert Rate
Multi-parameter cross-validation between cell voltage, impedance, and gas crossover trends before any degradation alert fires
Continuous
Cell Voltage Distribution Monitor
Per-cell voltage tracked at sub-second resolution across every stack in the installation
7 days
CMMS and BMS Integration
Full OPC-UA and REST API connection to your existing stack monitoring and maintenance infrastructure
92%
Reduction in Emergency Stack Replacement Spend
Emergency replacement cycles eliminated from first month of live predictive degradation model deployment

How iFactory Compares to Generic BMS Monitoring and Condition-Based Maintenance Tools

Most fuel cell monitoring vendors offer BMS-level voltage dashboards, fixed-threshold cell voltage alarms, or OEM-bundled monitoring tools that provide stack data without degradation analytics. iFactory is built differently — training stack-specific ML models on your own cell voltage history and electrochemical impedance data, so degradation predictions reflect your stack's unique operating environment and aging characteristics.

Capability Generic BMS / Condition Monitoring iFactory Platform
Cell Voltage Data Utilization Average stack voltage displayed, individual cell voltage alarms triggered at absolute thresholds. Spatial voltage distribution trends not analyzed. Per-cell voltage distribution analyzed continuously. Spatial gradient detection identifies developing non-uniformity across the stack face — the earliest indicator of membrane drying, flooding, or gas distribution issues.
Membrane Degradation Detection Not monitored. Membrane condition inferred indirectly from average voltage decay rate — which lags actual membrane thinning by 4–8 weeks. High-frequency resistance and hydrogen crossover current trended per cell group. Membrane degradation rate quantified directly with 95% confidence intervals and 6–10 week advance warning of critical thinning.
Hydrogen Leak vs Crossover Discrimination Fixed hydrogen concentration thresholds in balance-of-plant zones. Cannot distinguish between normal stack crossover and abnormal external leak signatures. ML-based gas signature analysis discriminates between stack crossover hydrogen (predictable by current, temperature, and membrane condition) and external leak hydrogen (uncorrelated with stack operating parameters). 82% fewer false alarms.
Operating Strategy Optimization Manufacturer-recommended fixed setpoints for humidification, air flow, and temperature — applied identically regardless of stack age or degradation state. AI-optimized setpoints adjusted per stack subsection based on real-time membrane hydration, cell voltage distribution, and degradation rate. Operating conditions evolve as the stack ages to minimize degradation.
Degradation Forecasting Linear extrapolation of average voltage decay rate — no probabilistic failure window modeling or confidence interval estimation. Time-series forecasting models predict remaining useful life per stack subsection with confidence intervals over rolling 2, 4, 6, and 10-week windows. Alerts include urgency tiers, confidence scores, and recommended operating adjustments.
CMMS Integration Standalone dashboards or manual alarm review. No automated work order generation or spare parts procurement integration. Native OPC-UA and REST connectors for SAP PM, Maximo, and hydrogen asset management platforms. Auto-generates prioritised work orders with degradation assessment, recommended operating adjustments, and replacement part procurement triggers.
Deployment Timeline 3–9 months for BMS integration, dashboard configuration, and baseline establishment. High engineering overhead and open-ended deployment scope. 6-week fixed deployment: data audit in week 1, pilot stack model in week 3, plant-wide rollout by week 6. BMS integration, gas detection system connection, and operations team training included.

6-Week Deployment and ROI Plan: From Data Audit to Live Predictive Stack Analytics

Every iFactory hydrogen fuel cell analytics engagement follows a structured 6-week program with defined deliverables per week — and measurable ROI indicators beginning from week 3 of deployment. No open-ended data science projects. No months of model tuning before a single prediction fires.

Weeks 1–2
Data Audit and Model Design
Historical cell voltage data quality assessment across BMS, EIS records, and stack replacement logs
Stack-specific ML model architecture designed per stack type — PEM, SOFC, or hybrid configuration
BMS, gas detection system, and CMMS integration planning with data schema mapping and API validation
Weeks 3–4
Pilot Model and Validation
Deploy trained ML models to highest-criticality stacks — membrane degradation and hydrogen crossover pilot
Degradation probability alerts, operating parameter recommendations, and CMMS integration activated and tested with operations team
First predictive interventions executed and unplanned stack replacement risks eliminated — ROI evidence measurable from week 3
Weeks 5–6
Fleet Rollout and Optimise
Expand predictive models to full stack fleet: all PEM and/or SOFC stacks, balance-of-plant equipment, and hydrogen safety monitoring
Automated operating parameter optimisation and work order generation activated plant-wide
ROI baseline report delivered — stack life extension, replacement cost avoidance, efficiency improvement, and safety event reduction metrics
ROI IN 3 WEEKS: MEASURABLE RESULTS FROM WEEK 3
Plants completing the 6-week program report an average of $185,000 in avoided stack replacement costs and emergency maintenance spend within the first 3 weeks of full production rollout — with membrane degradation prediction accuracy of 65–82% validated by week 3 pilot testing.
$185K
Avg. savings in first 3 weeks
65–82%
Degradation prediction accuracy by week 3
92%
Reduction in emergency stack replacements
Integration and Compliance Readiness Checklist
BMS and stack voltage monitoring system direct API ingestion — no manual data export required
SAP PM, IBM Maximo, and hydrogen asset management platform bidirectional integration
OPC-UA and Modbus TCP real-time telemetry ingestion from stack BMS, gas detectors, and BOP sensors
NFPA 2 and ISO 19880 hydrogen safety compliance documentation generated automatically
Electrochemical impedance spectroscopy (EIS) test data integration for membrane degradation modeling
Hydrogen gas detection system integration — point detectors, ultrasonic sensors, and ventilation monitoring

Conclusion: Stop Losing Stack Life and Revenue to Degradation Your Cell Data Already Predicted

Hydrogen fuel cell power plants across the USA, Canada, UK, and Germany are generating cell-level electrochemical data every millisecond of every operating day — data that sits in BMS archives while fixed-setpoint operating strategies accelerate membrane degradation and stack replacement costs erode the economic case for hydrogen power generation. The gap between industry-leading hydrogen plant availability and average operations is not a stack technology gap or a hydrogen supply gap. It is a gap in what gets done with the cell voltage and impedance data that already exists in every installation.

iFactory's AI-driven hydrogen fuel cell analytics platform closes that gap in six weeks. Stack-specific ML models trained on your own cell voltage history and impedance records, continuous model retraining that improves degradation forecasting accuracy with every stack lifecycle completed, automated CMMS work order generation for stack replacement planning, and 6 to 10 week membrane degradation detection lead times — deployed at operating hydrogen installations without disrupting power generation or requiring custom data science engagements.

The $620,000 average annual stack replacement cost avoidance per 10 MW plant, the 89% reduction in hydrogen leak safety events, the 8,000 hours of stack life extension, and the 3.2 percentage point electrical efficiency improvement are outcomes already measured at live hydrogen fuel cell deployments. They are available to any hydrogen plant operator willing to let their cell voltage data start working for them.
Frequently Asked Questions

iFactory's ML models begin producing meaningful degradation predictions with as little as 6 months of cell voltage and operating data, though 12–18 months delivers optimal accuracy for stacks with infrequent replacement events. During the Week 1 data audit, the team assesses your available BMS archive and adjusts model architecture to match your data depth — no minimum data volume requirement blocks deployment. For new installations without historical data, iFactory applies transfer learning from analogous stack types in its anonymised cross-fleet dataset.
iFactory integrates natively with major fuel cell BMS platforms including Ballard, Plug Power, Bloom Energy, Doosan, and custom BMS architectures via OPC-UA, Modbus TCP, and REST APIs. Cell voltage data, stack temperature sensors, pressure transducers, and coolant flow meters are ingested at BMS scan rate. Electrochemical impedance spectroscopy test results — including high-frequency resistance, charge transfer resistance, and hydrogen crossover current — are imported from standard EIS test equipment data files. Data schema mapping and integration validation are completed during the Week 1–2 data audit phase.
Yes — this is a core differentiator of the iFactory platform. Reversible voltage loss — caused by membrane drying, cathode flooding, reactant starvation, or carbon monoxide poisoning from impure hydrogen — can be recovered by adjusting operating conditions without stack replacement. Irreversible degradation — membrane thinning, catalyst layer agglomeration, and gas diffusion layer compression set — accumulates permanently and determines remaining useful life. iFactory's analytics model distinguishes between these by correlating cell voltage changes with the independent measurements: high-frequency resistance indicates membrane hydration state, charge transfer resistance indicates catalyst condition, and hydrogen crossover current directly quantifies membrane physical integrity. A voltage drop accompanied by rising HFR and stable crossover is likely reversible with humidification adjustment. A voltage drop accompanied by rising crossover current and stable HFR indicates irreversible membrane thinning requiring replacement planning.
iFactory's hydrogen safety module ingests data from point catalytic bead detectors, electrochemical hydrogen sensors, ultrasonic leak detectors, and ventilation air flow monitors simultaneously — building a zone-level risk assessment that accounts for the different response characteristics of each detection technology. Catalytic bead sensor drift is detected and compensated for automatically using cross-sensor validation against ultrasonic detectors. The ML-based gas signature model considers stack operating conditions — current density, temperature, humidity — to establish the expected background hydrogen level from normal stack crossover in each zone. When measured hydrogen exceeds the expected background by a statistically significant margin without correlation to stack operating parameters, iFactory generates a genuine leak alarm with specific zone location and estimated leak rate. This approach has reduced false hydrogen alarms by 82% in deployments while increasing genuine leak detection sensitivity by 44%.
iFactory's hydrogen fuel cell deployments typically reach full cost recovery within 5 to 10 months of deployment, with the fastest payback cases occurring when the platform identifies a high-frequency membrane degradation condition in the first 60 days that, once corrected, extends stack replacement intervals by more than 4,000 operating hours. For a 10 MW PEM installation with four stacks replaced at 36,000-hour intervals at a cost of $450,000 per stack, extending each replacement interval to 48,000 hours represents a stack replacement cost avoidance of approximately $620,000 per year. The electrical efficiency improvement of 3.2 percentage points adds an additional $180,000 to $350,000 in annual hydrogen fuel cost savings depending on local hydrogen pricing. An ROI modeling session using your installation's specific stack configuration, operating economics, and hydrogen pricing is available at no cost — book a demo for a personalized assessment.
Turn Years of Idle Cell Voltage Data Into a 24/7 Stack Degradation Prediction Engine. Deploy in 6 Weeks. ROI in Week 3.
iFactory gives hydrogen fuel cell plant operators stack-specific ML models trained on their own cell voltage and impedance data, automated CMMS work order generation, real-time degradation probability dashboards, and 6–10 week membrane degradation detection lead times — fully deployed in 6 weeks, with ROI evidence starting in week 3.
96% Voltage Uniformity
BMS and CMMS in 7 Days
OPC-UA and Modbus Native
Continuous ML Retraining
$620K Avg. Annual Savings

Share This Story, Choose Your Platform!