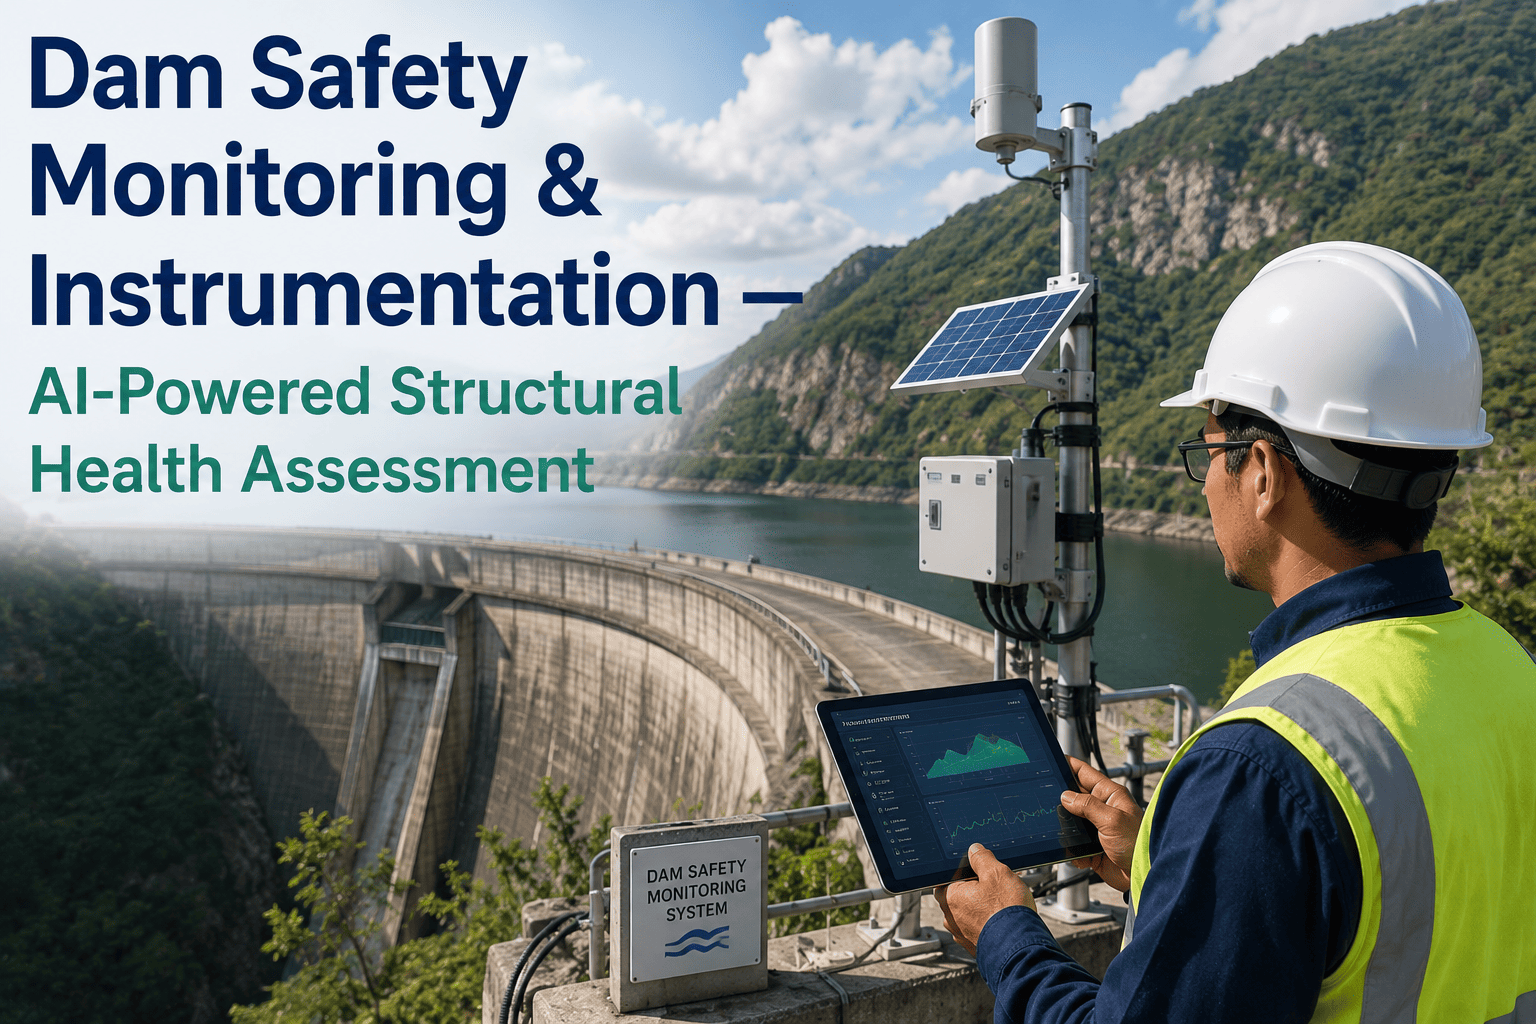
A dam rarely fails without warning. Long before any visible sign of distress, the structure is already telling a story through small shifts in piezometric pressure, tiny increases in seepage flow, and fractions of a millimeter of movement across joints and monoliths. The challenge for Reliability Engineers is that these signals are often collected manually on a weekly or monthly walk-down, which means a developing trend can go unnoticed for weeks between readings. AI-powered dam safety monitoring changes that by pulling instrumentation data continuously and flagging deviations the moment they appear rather than the next time someone walks the site with a clipboard, and teams evaluating this shift often start with a short dam monitoring walkthrough before changing anything in the field.
Hydropower / Dam Safety
Dam Safety Monitoring & Instrumentation
AI-powered analysis of piezometric levels, seepage flow, structural deformation, and seismic response, built to meet FERC dam safety expectations with continuous data instead of periodic spot checks.
24/7
Continuous instrumentation coverage
The Four Signals of Dam Health
What Continuous Monitoring Actually Watches
Every dam safety program is built around a handful of core instrumentation categories, and each one tells engineers something different about the structure's condition. Treated together instead of in isolation, these signals give a far more complete picture than any single reading on its own.
01
Piezometric Levels
Tracks internal water pressure within the dam body and foundation, where unexpected rises can indicate changes in seepage paths or drainage system performance.
02
Seepage Flow
Measures water passing through or under the dam via weirs and drains, where a gradual increase can signal internal erosion long before it becomes visible.
03
Structural Deformation
Captures movement across joints, monoliths, and the crest using survey and inclinometer data, distinguishing normal seasonal movement from concerning trends.
04
Seismic Response
Records how the structure responds to ground motion events, comparing actual behavior against the design assumptions used in the dam's original seismic analysis.
Want to see how your current instrumentation data would look under continuous analysis? A short review usually shows it clearly.
From Sensor to Decision
How Automated Monitoring Moves Faster Than a Manual Round
1
Instrumentation readings stream continuously from piezometers, weirs, inclinometers, and seismic sensors
2
The model compares live readings against historical baseline and seasonal trend patterns for that specific structure
3
Deviations are ranked by severity and cross-checked against related instruments to rule out sensor error
4
Engineers receive a real-time alert with the specific reading, trend, and recommended inspection priority
Manual vs. Automated
Where Continuous Monitoring Closes the Gap
| Monitoring Aspect | Manual Walk-Down | Continuous AI Monitoring |
|---|---|---|
| Reading frequency | Weekly or monthly | Continuous, near real time |
| Trend detection | Depends on inspector recognizing a pattern | Automated comparison against historical baseline |
| Seismic response | Reviewed after the fact | Flagged immediately against design assumptions |
| Sensor error handling | Often caught only on the next round | Cross-checked against related instruments automatically |
Regulatory Alignment
Supporting FERC Dam Safety Requirements
FERC-regulated hydropower projects are expected to maintain robust instrumentation programs, timely data review, and documented response procedures as part of ongoing dam safety compliance. Continuous monitoring supports each of these expectations directly, turning what is often a paperwork-heavy manual process into a system that produces its own audit trail as a byproduct of normal operation.
Documented Reading History
Every instrumentation reading is logged automatically, creating a continuous audit trail without manual data entry.
Timely Anomaly Review
Deviations are surfaced as they occur rather than discovered during a periodic data review cycle.
Response Procedure Support
Alerts include the specific reading and trend needed to trigger the appropriate step in an existing emergency action plan.
Common Questions
Dam Safety Monitoring, Explained Simply
Does this replace the periodic inspections required for dam safety compliance?
Continuous monitoring is designed to complement periodic inspections rather than replace them, since regulatory dam safety programs still require scheduled visual inspections and formal engineering reviews. What changes is the quality of information available going into those inspections, since engineers arrive already knowing which instruments have shown trending behavior since the last visit. Many teams find their formal inspections become more focused and productive once continuous data is available.
Can this work with the instrumentation we already have installed?
Most existing piezometers, seepage weirs, inclinometers, and seismic instruments can feed directly into a continuous monitoring platform without being replaced, since the value comes from analyzing the data rather than the specific sensor hardware collecting it. Older instruments that use manual readout may need a data logger added to enable continuous collection. A short review of the current instrumentation inventory is usually enough to map out what is needed.
How does the system avoid false alarms from normal seasonal changes?
Piezometric levels and seepage flow naturally shift with reservoir level and seasonal precipitation, so the model is trained on that structure's own historical seasonal pattern rather than a fixed threshold. An alert is only generated when a reading deviates from what is expected for that time of year and reservoir condition, not simply because a number moved. This is a major part of why continuous monitoring produces meaningfully fewer nuisance alerts than a fixed-threshold alarm system.
What happens when a seismic event occurs at the site?
Seismic sensor data is compared automatically against the structural response predicted in the dam's original design analysis, giving engineers an immediate read on whether actual behavior matched expectations or diverged from them. This comparison typically happens within minutes of the event rather than during a scheduled post-event review. That speed matters most in the hours immediately following a seismic event, when a quick engineering assessment is most valuable.
Who at the plant receives the real-time alerts?
Alert routing is configured around the plant's existing dam safety organization, typically reaching the Reliability Engineer or dam safety officer responsible for that structure first, with escalation paths for more severe deviations. The goal is to fit into an existing emergency action plan rather than create a parallel notification system. Configuration is discussed during setup so alerts reach the right person without adding noise to inboxes that do not need it.
See what continuous instrumentation monitoring would surface on your dam. Book a walkthrough with our team.