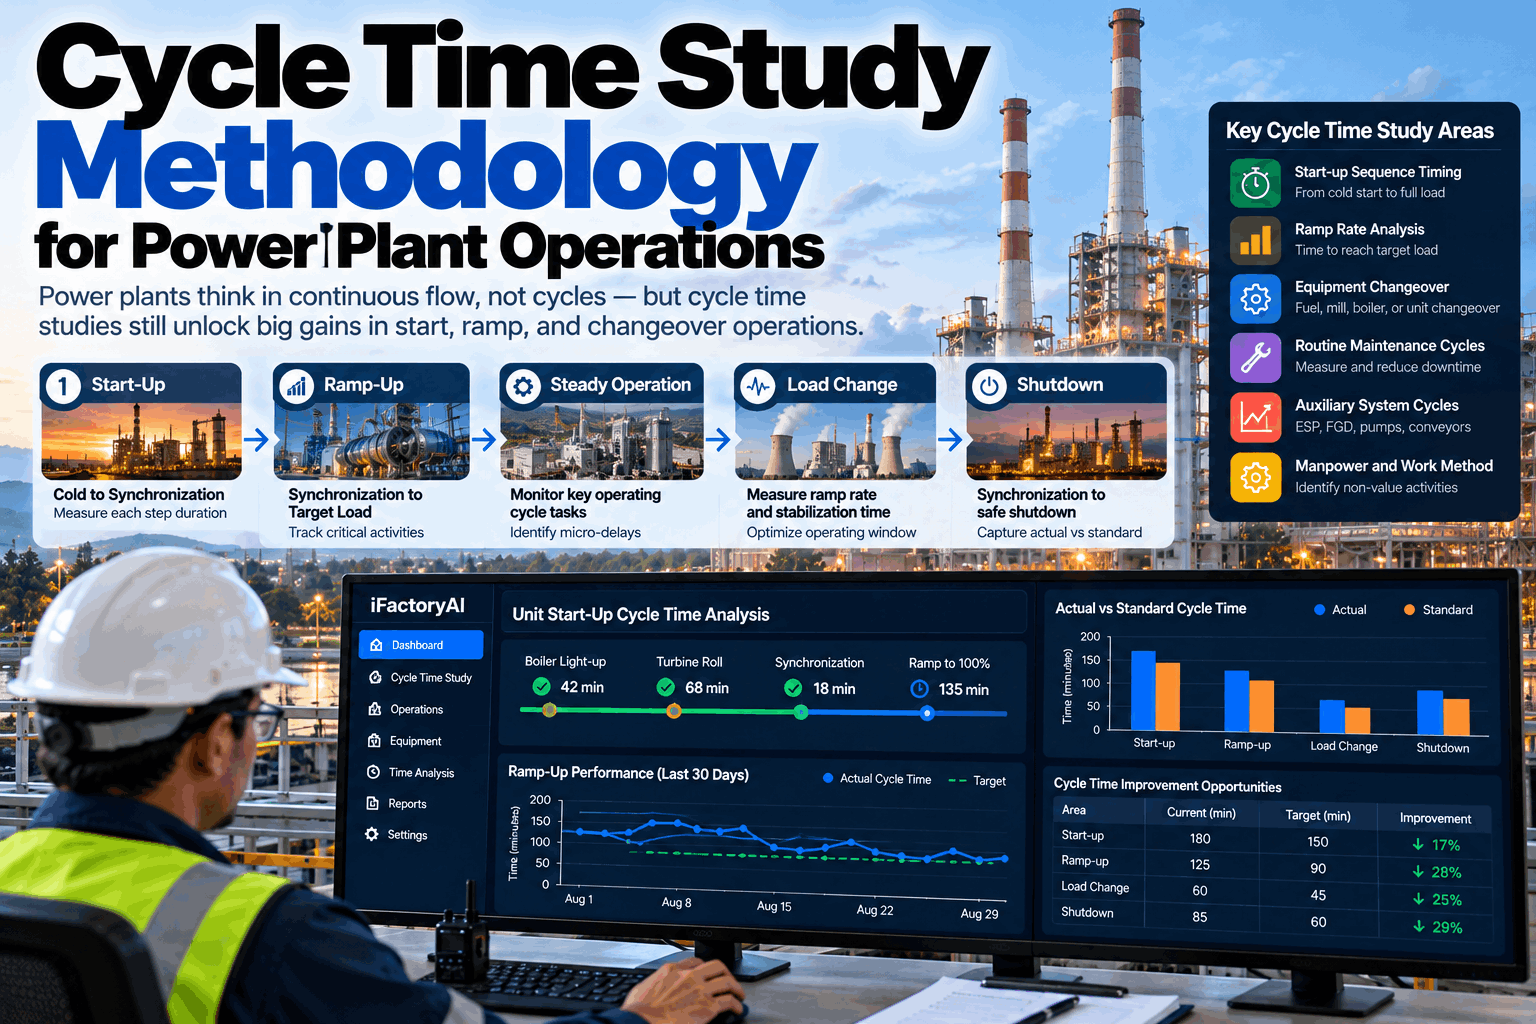
Power plants are built for steady flow, so few teams think in cycles. Yet every start, ramp and shutdown is a repeated cycle with its own phases, delays and best-ever time. When two warm starts on one unit differ by two hours, that gap is money. This guide shows how to run a cycle time study on power plant operations. Start with a start-up review.
Cycle Time Study Methodology for Power Plant Operations
Break starts, ramps and shutdowns into measured phases, compare every run with your best one and find the waiting time hidden between steps. Keep the hold times that protect the equipment and remove the ones that only protect habits.
- Which power plant operations behave like cycles
- A step-by-step study method using historian data
- How to tell thermal limits from avoidable waiting
Where Cycles Hide in a Continuous Plant
The plant runs in flow. Its transitions run in cycles.
At full load a unit is a continuous process. But plants spend more time in transition than they used to, as they follow demand and work alongside renewables. Each transition has a clear start, a clear end and a series of steps in between, run by the same crews on the same equipment. That makes it a cycle, and it can be measured, compared and improved like any production cycle. Our operations specialists can help list the cycles on your units.
Starts
Hot, warm and cold starts from fire to dispatch load.
Ramps
Load increases and reductions between set points.
Shutdowns
Planned unloading, trip recovery and cool-down.
Equipment changeovers
Mill, pump and fan switches during operation.
Maintenance turnarounds
Isolate, repair, test and return equipment to service.
A unit that starts a hundred times a year has more to gain from a study of warm starts than from a once-a-year shutdown. Frequency multiplies every minute you save. Rank your cycles by how often they happen and how much they vary, and study the top one first.
Know Your Start Types Before You Measure
A warm start and a cold start are different cycles. Compare like with like.
How long a unit has been offline decides how hot its metal still is, and that decides how fast it can start. NREL's study of cycling costs defines a warm start by an offline window that varies by unit type. Anything shorter is a hot start, anything longer is a cold start. Group your start records the same way before comparing them. Plan your start groups in a study plan session.
Median lower-bound capital and maintenance cost per start, per MW of capacity, in 2011 dollars, from NREL's power plant cycling cost study. NREL notes costs vary widely between units.
The Cycle Time Study Method, Step by Step
Define, split, measure, compare, then improve.
A cycle time study in a power plant follows the same logic as in any factory, with one difference: most of the data already sits in the DCS and the historian. The work is to define the phases clearly, pull enough past cycles to see the pattern and separate necessary time from waiting. Questions on the method go to our study team.
Define the cycle
Set a clear start and end event, such as first fire and dispatch load reached.
Split it into phases
Choose phase boundaries tied to events you can find in the historian.
Pull past cycles
Extract every start of the same type from the last one or two years.
Observe a few live
Watch some cycles in the control room to explain what the data cannot.
Separate limits from waiting
Mark time set by thermal and safety limits apart from time spent waiting.
Benchmark against your best
Compare each phase with the best safe run on the same unit and start type.
Standardise and re-measure
Fix the causes, write the best practice into the procedure and track the next cycles.
Operators trust a target that their own crew has already hit on the same unit. Benchmarking each phase against the best safe run avoids arguments about whether a vendor figure or another plant's number really applies. Combining the best time from each phase also shows a realistic stretch target for the whole start.
Find the Events That Mark Each Phase
Good phase boundaries are events the historian already records.
A study is only as good as its phase boundaries. Choose events that leave a clear trace in the data, so every cycle can be split the same way without manual notes. The examples below fit a typical drum-type coal unit. Map yours in a tag mapping session.
Agree exactly which tag and threshold marks each event, and keep that rule fixed. If the definition changes halfway through, the study compares different things and the trend means nothing. Store the rules with the study so the next team can repeat it and get the same answer.
What Faster Starts Are Worth
Minutes saved on a start mean earlier synchronisation, earlier revenue and less fuel burned before the unit earns anything. Across a year of starts, they add up.
Thermal Limits Are Not Waste
Some waiting protects the equipment. Some only protects old habits.
A cycle time study must never treat every hold as waste. Thick-walled components such as drums, headers and turbine rotors need time to heat evenly, and rushing them adds stress and shortens their life. NREL's work shows that faster ramping multiplies cycling damage, sometimes several times over. The goal is to keep the necessary holds and cut the rest. Questions about safe limits go to our support desk.
Time to keep
- Heating rates set by drum and header metal limits
- Turbine soak times tied to rotor stress
- Purge times required by burner safety rules
- Chemistry holds before raising load
Time to remove
- Waiting for a field operator to confirm a check
- Equipment found not ready at the start order
- Holds kept "to be safe" with no written basis
- Slow handoffs between control room and field
Two units with the same average start time can behave very differently. One may start consistently, while the other swings from fast to very slow. The spread between the best and worst runs of the same start type shows how much is down to crew, readiness and practice rather than physics, and that is usually the easiest time to win back.
Cycle Time Study Mistakes to Avoid
The study can do harm if it chases speed alone.
Faster is only better when it is also safe and consistent. Studies that ignore equipment life, compare unlike starts or rely on memory instead of data tend to produce targets that crews cannot meet or should not try to. A short rollout plan session helps set safe targets.
What works
- Group starts by type and unit before comparing
- Use historian events, not handwritten times
- Involve operators and the turbine engineer from day one
- Track equipment stress alongside start time
What fails
- Comparing hot and cold starts in one average
- Cutting holds without checking their technical basis
- Targets taken from other units or vendor brochures
- Studying once and never measuring again
Record metal temperature differences and ramp rates for every start you study. If a faster start also raises stress, the saving may cost more in maintenance than it earns. A good study shows both numbers side by side.
How iFactory Automates Cycle Time Studies
Every start measured, split and compared without a stopwatch.
iFactory reads DCS and historian data through an on-prem AI server inside your network. It finds each start, ramp and shutdown, splits it into phases using your event rules, compares it with your best runs and explains where the time went. Results are ready for the morning meeting, not weeks later, and every start adds to the history. Fit questions go to our solutions team.
Automatic cycle detection
Starts, ramps and shutdowns found in historian data and grouped by type.
Phase breakdown
Each cycle split into phases using event rules your team agrees.
Best-run benchmark
Every phase compared with the best safe run on the same unit and start type.
Delay causes
AI links extra time to equipment readiness, limits and crew actions.
Stress tracking
Metal temperature differences and ramp rates shown beside each start time.
Start reports
A short report after every start, with phase times and the main delay.
Results depend on your historian data, event rules and how findings are acted on. We measure start times, phase variation and stress indicators on your own data during the pilot, rather than promising a general figure.
Turnkey AI: Delivered, Connected and Live in 6–12 Weeks
You do not build this. It arrives ready.
iFactory ships as a pre-configured NVIDIA AI server with the software pre-loaded, racked and ready. Rack it, plug in power and Ethernet, and the AI is live on your network. Our team handles cabling, network setup, DCS, SCADA, PLC and historian integration, operator training and 24×7 remote monitoring. Plant data stays on your network. For a scope matched to your units, request a turnkey quote.
Ship, network and data
Server installed. DCS and historian connected. Event tags mapped for the pilot unit.
Model training and pilot
Past starts analysed. AI trained on your delay causes. Pilot reports after each start.
Go-live and training
Studies live across units and cycle types. Operations teams trained. 24×7 monitoring begins.
Frequently Asked Questions
What is a cycle time study in a power plant?
It measures recurring transitions, such as starts, ramps and shutdowns, by splitting each into phases, timing every phase across many runs and finding where time is lost compared with the best safe run.
How are hot, warm and cold starts defined?
By how long the unit has been offline. NREL defines a warm start window for each unit type, such as 12 to 72 hours for supercritical coal or 5 to 40 hours for combined cycle. Shorter is hot, longer is cold. Many plants also use metal temperatures to classify starts.
Can faster starts damage equipment?
Yes, if they break heating rate or stress limits. NREL found that faster ramping multiplies cycling damage. A good study keeps holds that protect equipment and only removes waiting time.
What data do we need?
Mostly what the DCS and historian already record: flame signals, pressures, temperatures, turbine speed, breaker status and generator output, plus shift logs to explain unusual runs.
How many starts are enough for a study?
Twenty or more of the same type on the same unit usually show a clear pattern. Fewer can still point to large delays, but the best-run benchmark is more reliable with more history.
Does this apply to gas turbines and combined cycle plants?
Yes. Combined cycle starts have their own phases, such as gas turbine start, heat recovery steam generator warm-up and steam turbine roll, and the same study method applies.
Can the same method be used for ramps?
Yes. A ramp is a cycle from one load to another. Define the start and end loads, split the ramp into steps such as mill starts or burner changes, and compare actual ramp rates with the unit limit and with your best ramps under similar conditions.
How do we start?
Start with the most frequent start type on one unit. A 6-week pilot connects the historian, sets the event rules, analyses past starts and reports on new ones. To plan it, contact our team.
Find the Hours Hidden in Your Starts
In thirty minutes we look at your units, your start history and your procedures, and point to where time is likely being lost. You keep the notes whether or not you go further with iFactory.
- 1A year of start dates, types and durations
- 2Your start-up procedure and hold points
- 3Historian tag list for the unit
- 4Thermal stress limits from the OEM
- 5The slowest start you remember and why