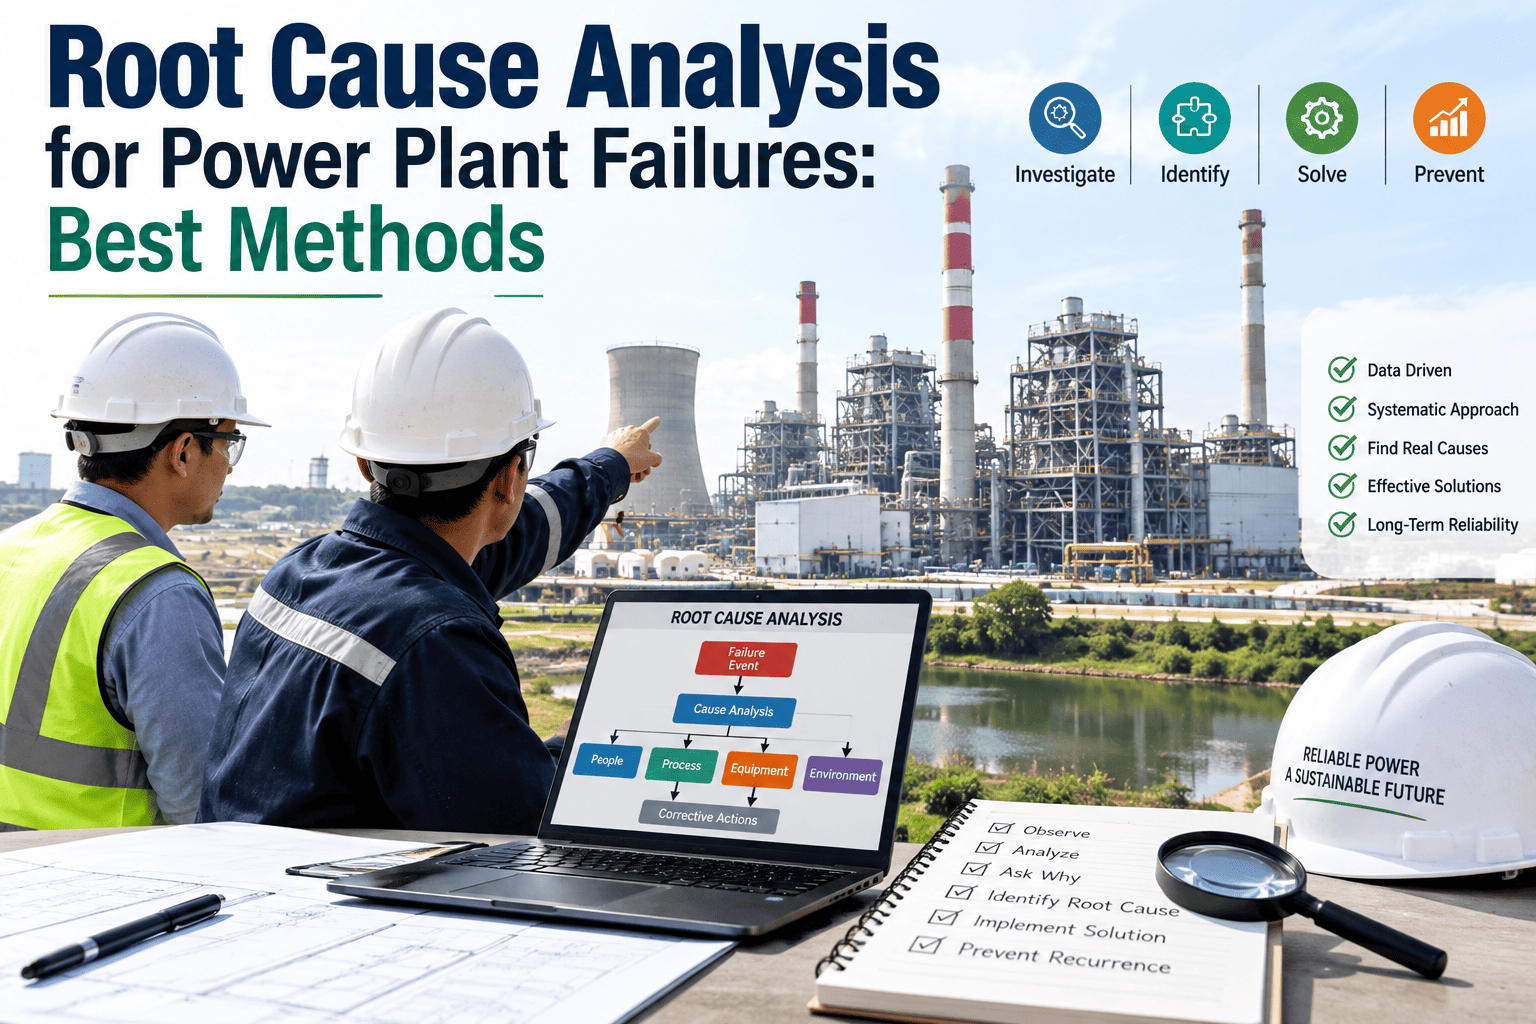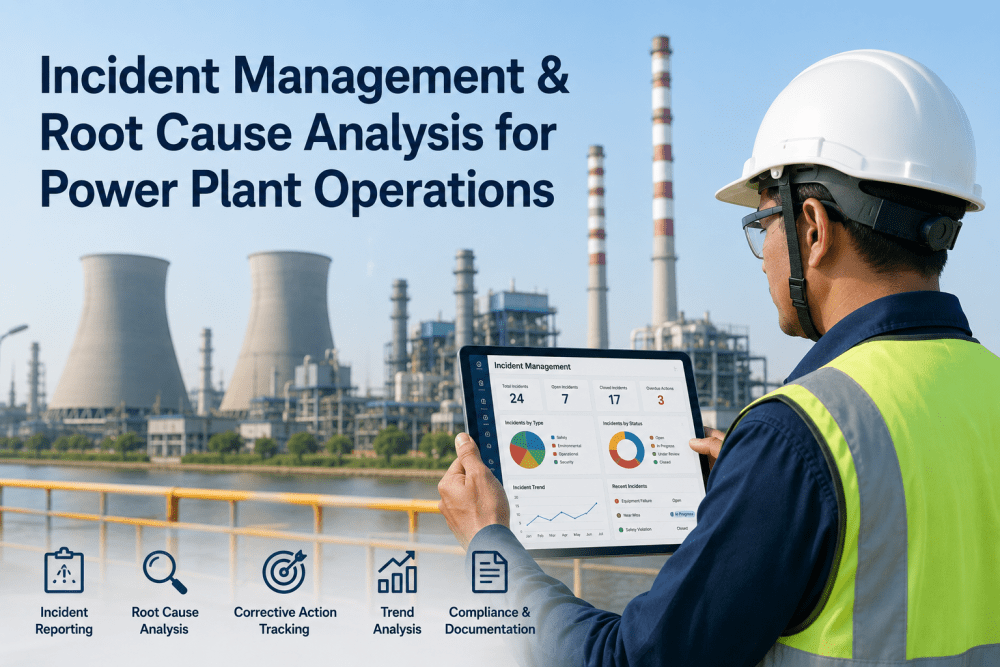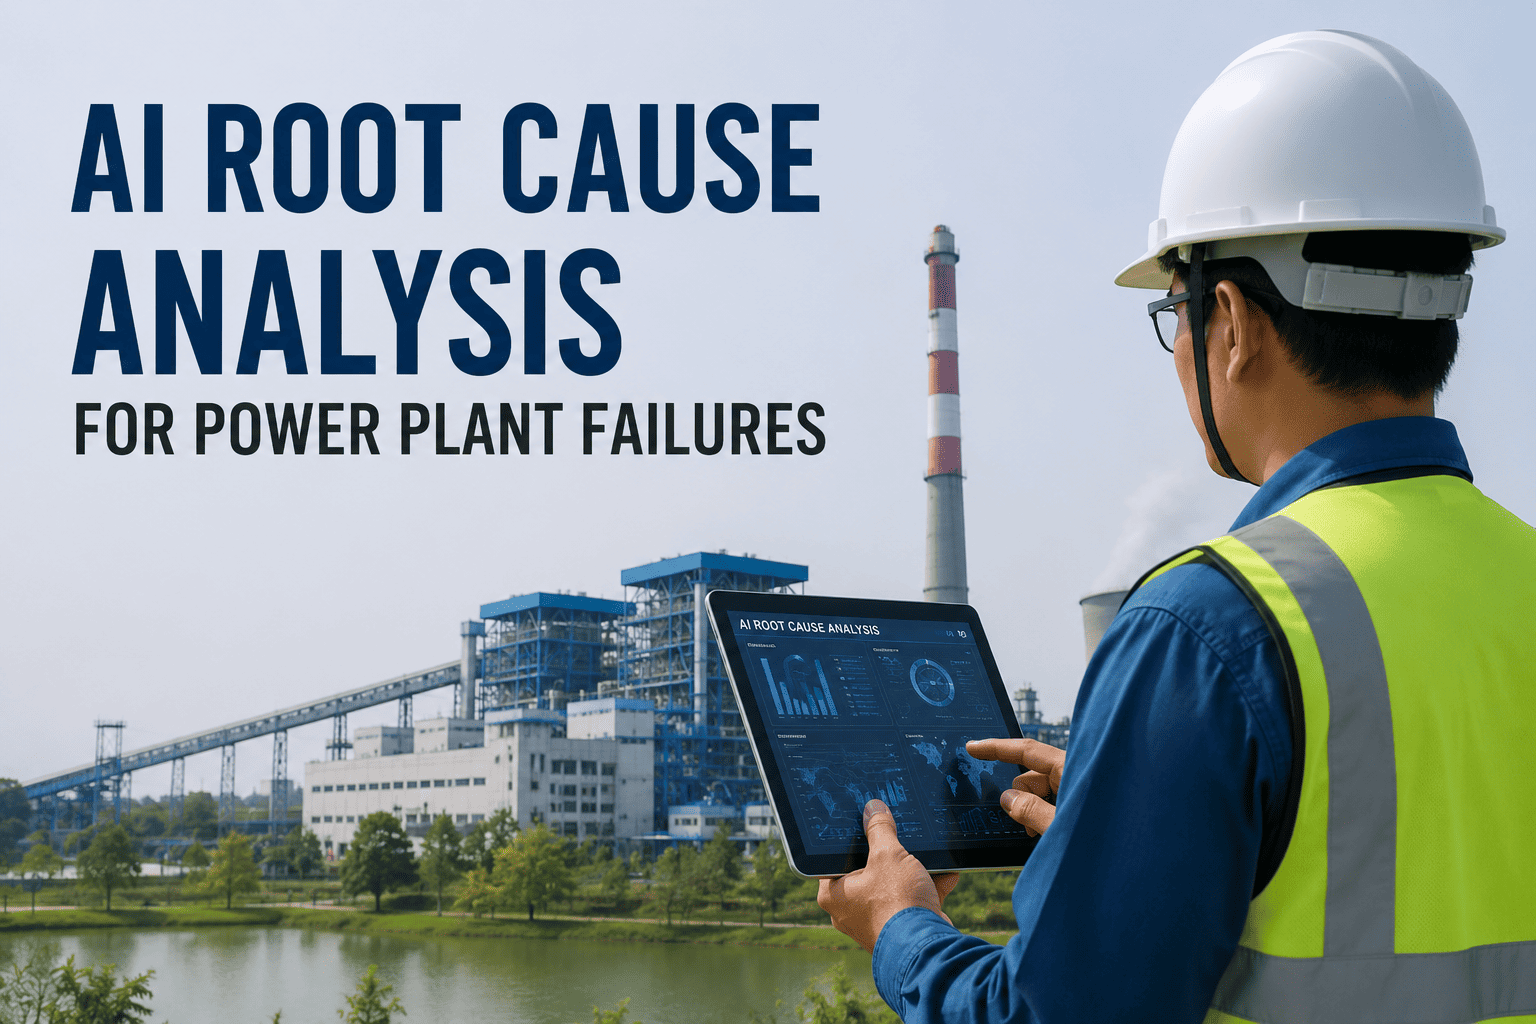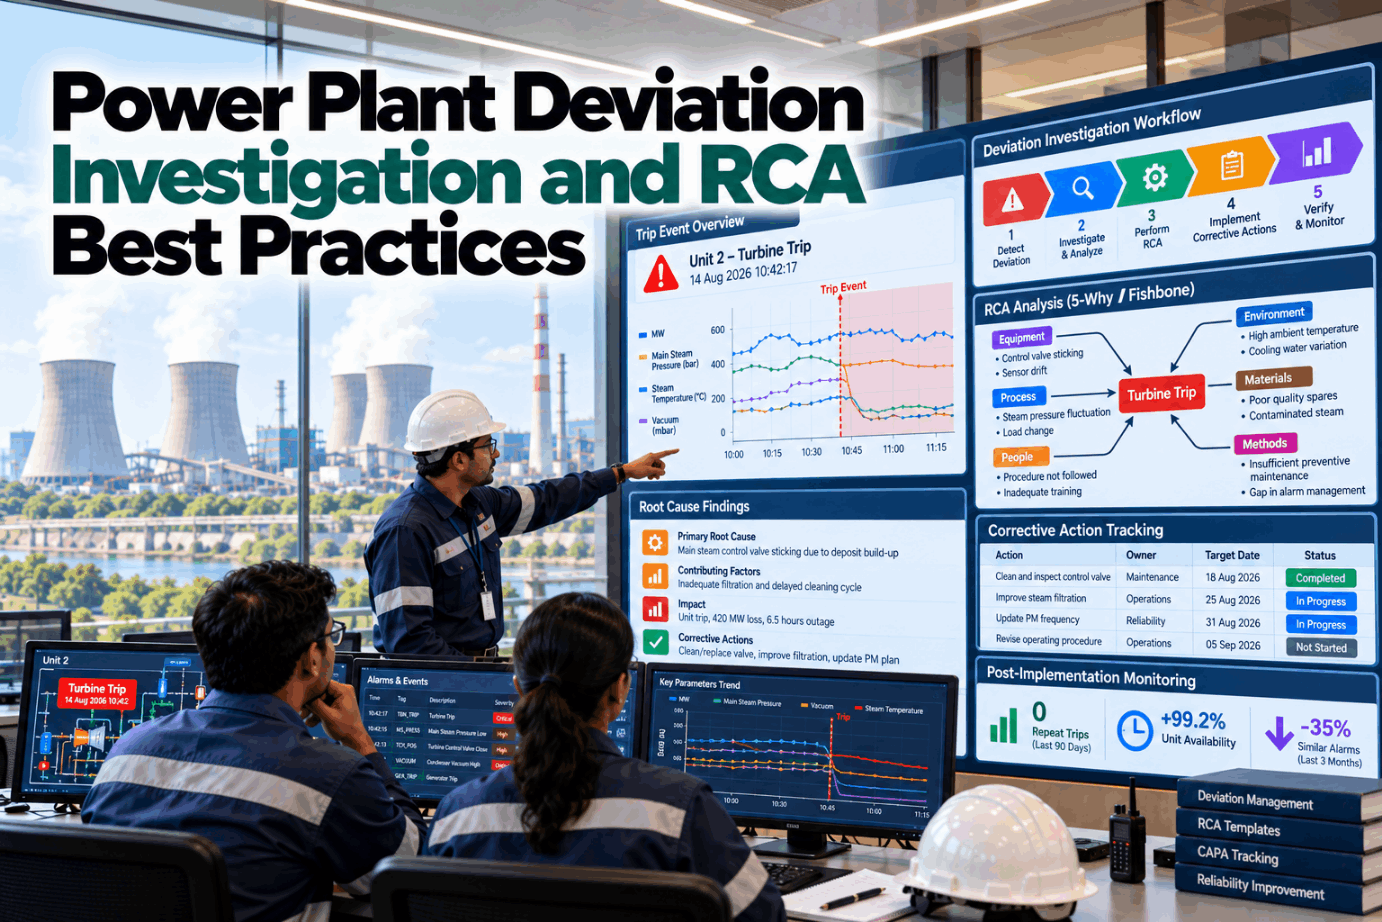
Power plant deviation investigation and root cause analysis (RCA) turn a trip, a chemistry excursion or a limit breach into a fix that stops it happening again. Too often the event is logged, a report is filed and the unit goes back on line, only for the same sequence to repeat months later. A structured model changes that: capture the evidence, find the real cause, act on it and check that the action worked. This guide sets out each step with the standards behind it. To see a closed-loop investigation on one of your events, book a short walkthrough.
Power Plant Deviation Investigation and RCA Best Practices: Close the Loop on Repeat Trips
From first evidence to verified fix. A clear model for investigating trips, chemistry excursions and limit breaches so the same event does not return.
A unit back on line with the cause unknown is waiting for the next trip.
Secure sequence-of-events data, trends and statements in the first hour.
Industry data shows design and organisational causes far outnumber individual error.
The effectiveness check is what breaks the repeat cycle.
What Counts as a Deviation?
A deviation is any event where the plant, a process or a product moved outside its defined limits.
A protective shutdown, planned or not.
A parameter outside its limit for longer than allowed.
Temperature, pressure, vibration or emission above a set value.
A delivery or sample that fails specification.
An event that could have caused a trip or injury.
Any event that matches an earlier one.
In the words of US Department of Energy guidance: “the cause that, if corrected, would prevent recurrence of this and similar occurrences.”
That last phrase matters. A good investigation prevents similar events on other equipment too, not only the one that failed.
One clear definition of what gets investigated is the starting point. We can review yours on a call.
Why the Same Events Come Back
After a trip, pressure to restart is high. Finding the cause can lose out to getting back on line.
- Repair without mechanism. The tube is replaced; why it failed is never established.
- Report without action. The form is filed, and nothing in the plant changes.
- Action without check. A fix is made and closed, and nobody confirms it worked.
- No link between events. Each trip is treated as new, so patterns are missed.
One industry review notes that tube failures “are usually repetitive in nature and result in multiple forced outages”, and that return to service has historically come before finding the mechanism.
A count of repeat events in your last two years is a revealing first exercise. See how in a demo.
A Five-Phase Investigation Model
US Department of Energy guidance sets out five phases that fit any power plant event.
Data, trends, alarms, statements, physical evidence.
Analyse to find the causes.
Define and carry out actions.
Report and share the lessons.
Confirm the actions were effective.
| Phase | Key question | Output |
|---|---|---|
| Collect | What exactly happened, in what order? | Timeline and evidence file |
| Assess | Why did it happen? | Direct, contributing and root causes |
| Correct | What will stop it happening again? | Actions with owners and dates |
| Inform | Who else needs to know? | Report and lessons for other units |
| Follow up | Did it work? | Effectiveness review |
The source is DOE-NE-STD-1004-92, a root cause analysis guidance document written for nuclear facilities and widely borrowed since.
Most plants do the first three phases. The last two are where loops stay open. Our specialists can show a full cycle.
Secure the Evidence in the First Hour
The order of events decides the cause, and only some systems record it precisely enough.
Logic that identifies which of several near-simultaneous trip signals came first. It points to the initiating event.
- Sequence-of-events printout. Save it before it is overwritten.
- Trends. Key parameters for at least an hour before the event.
- Alarm and event list. Including alarms that were standing beforehand.
- Statements. From each operator, written separately and soon.
- Physical evidence. Failed parts, photographs, samples.
- Plant state. Line-ups, permits, work in progress, bypasses in force.
A historian sampling every few seconds cannot tell which of two signals a few milliseconds apart came first. The sequence-of-events record can.
Automatic capture of this data at every trip removes the scramble. We set it up in every rollout.
Choosing an Analysis Method
Different methods suit different events. Simple events need simple tools.
| Method | How it works | Best for |
|---|---|---|
| 5 Whys | Ask why repeatedly until the underlying cause appears | Simple events with one causal chain |
| Fishbone diagram | Group possible causes under headings such as machine, method and material | Brainstorming when the cause is unclear |
| Events and causal factors chart | Timeline with conditions and causes attached | Trips with a sequence of steps |
| Change analysis | Compare this event with a time it went right | Events after a modification or new procedure |
| Barrier analysis | Identify the defences that failed or were missing | Safety and protection events |
| Fault tree analysis | Work down from the top event through logic gates | Complex or high-consequence events |
For most trips, a timeline chart plus 5 Whys on each causal factor is enough. Ask our team for worked examples.
Look Beyond “Operator Error”
Stopping at human error is the most common reason corrective actions fail.
of root causes in 1,007 bulk power system events from 2010 to 2023 were individual human performance. Organisational causes were 41% and design or engineering 26.4%.
| Cause category | Example in a power plant |
|---|---|
| Equipment or material | Failed transmitter, worn seal |
| Procedure | Step missing or unclear in the start-up procedure |
| Personnel | Wrong valve operated |
| Design | Single sensor with no redundancy on a trip |
| Training | Operator never practised the scenario |
| Management | Known defect deferred without risk review |
| External | Grid disturbance, fuel quality, weather |
The seven categories are from the Department of Energy guidance. If the answer is “personnel”, ask one more question: what in the system made that error likely?
Coding every event to one of these lets you see patterns across years. Our engineers can set up the coding.
Chemistry Deviations and Action Levels
Chemistry excursions rarely trip a unit, but they cause the tube and turbine damage that leads to later outages.
A band above the normal limit for a chemistry parameter. Each band sets how long the plant may keep running before it must act.
| Level | Meaning | Example response |
|---|---|---|
| Normal | Within target | Routine monitoring |
| Action level 1 | Outside target | Find and correct the cause; escalates if not restored in time |
| Action level 2 | Further outside | Shorter time allowed; load reduction if not restored |
| Action level 3 | Severe | Immediate shutdown |
In one US nuclear plant procedure for secondary water, Level 1 escalates after a week, Level 2 requires a power reduction after eight hours and Level 3 requires immediate shutdown.
For fossil and combined cycle plants, IAPWS guidance suggests a first action level at twice the target value and a second at four times. Time limits come from each plant’s own chemistry guidelines.
- Record time outside limits. Hours at each level, not just the peak value.
- Investigate like a trip. Condenser leak, dosing fault, sampling error or resin exhaustion.
- Link to later failures. A tube leak investigation should always check chemistry history.
Tracking cumulative hours at each level turns chemistry into a leading indicator. See it in a session.
Which Events Need a Full RCA?
Not every deviation deserves a team and a week. Grade the effort to the consequence.
| Grade | Typical events | Investigation |
|---|---|---|
| A: significant | Unit trip with damage, safety event, repeat trip, action level 3 | Full root cause analysis by a team |
| B: moderate | Unit trip without damage, action level 2, equipment trip with load loss | Apparent cause by one investigator |
| C: minor | Limit breach caught early, action level 1, near miss | Record, code and trend |
- Any repeat moves up a grade. A second minor event is no longer minor.
- Trend the C events. Many small events in one system signal a larger one coming.
- Decide within a day. Grade the event while the evidence is fresh.
The grades above are an illustration. Set your own criteria and write them down so grading does not depend on who is on shift.
A clear grading rule keeps investigators for the events that matter. Discuss yours with our advisors.
Corrective Actions That Work
The strongest actions change the plant. The weakest ask people to be more careful.
Design change: add redundancy, change the material, remove the hazard.
Interlock, alarm or automatic action.
New task, interval or condition check.
Clearer steps, hold points, checklists.
Useful as support, weak on its own.
- One action per cause. Every root and contributing cause has a matching action.
- A named owner and date. Not a department.
- Check other units. The same weakness may exist elsewhere.
- Define success in advance. State what result will show the action worked.
If the only action is retraining, the investigation probably stopped too early. We review action quality in a working session.
The Effectiveness Review
Checking that an action worked is a requirement in quality standards, and the step most often skipped.
Illustrative. The gap between the second and third rings is where repeat events come from.
Scheduling the review at the moment the action is closed makes sure it happens. Try it in a pilot.
Paperwork-Driven vs Closed-Loop Investigation
Both produce a report. Only one changes what happens next time.
- Evidence gathered by hand, hours later
- Cause recorded as the failed part
- Report filed and forgotten
- Actions closed when done
- Each event stands alone
- Same trip returns
- Event data captured automatically
- Direct, contributing and root causes
- Findings shared across units
- Actions closed when proven effective
- Events coded and trended
- Repeat events fall
The checklist fits on one page beside the control desk. A process review compares it with your current practice.
How iFactory Closes the Loop
iFactory captures the evidence, guides the analysis and tracks every action to a verified result.
Sequence of events, trends and alarms saved at every trip.
Timeline, 5 Whys and cause coding.
AI matches new events against history.
Owners, dates and links to work orders.
Scheduled and reported automatically.
Hours at each action level, by unit.
It runs on premises and reads from your DCS, historian and laboratory data. Share your last ten trip reports and we will show the patterns in a trial.
Find the Patterns in Your Trip History
Share your trip and deviation reports for the last two years. We code the causes, match repeat events and list the actions never verified.
First-out was drum level low-low. Feed pump B had tripped nine seconds earlier on lube oil pressure, the same sequence as the trip in July. That corrective action was closed without an effectiveness check.
A Trip That Had Happened Before
This is how a shift engineer might use the system after a trip.
iFactory ships as a pre-configured NVIDIA AI server, racked and ready with the deviation and event investigation models loaded. Rack it, plug in power and Ethernet, and the AI is live. Scope covers data connections across units, control room, stores and planning office, DCS, historian, CMMS and ERP integration, cabling and network setup, team training and 24×7 remote monitoring.
Server installed, DCS, historian and CMMS links live, history loaded.
Models tuned on your own plant data, then piloted on one unit with your team reviewing every output.
Rollout to the agreed units, team training done, 24×7 remote monitoring in place.
Software, server and integration come as one package. For pricing, contact our sales team.
Frequently Asked Questions
A structured investigation that finds the cause which, if corrected, would prevent the event and similar events from recurring, then confirms the fix worked.
US Department of Energy guidance lists five: data collection, assessment, corrective actions, informing others and follow-up.
The sequence-of-events record, trends for at least the hour before, the alarm list, operator statements, physical evidence and the plant state at the time.
For most trips, a timeline chart with 5 Whys on each causal factor. Use fault tree analysis for complex or high-consequence events.
A check, some months after a corrective action, that it was carried out as written and that the event has not returned. ISO 9001 requires it.
Automatic event capture, cause coding and action tracking typically fit within a 6–12 week rollout. Plan it with our specialists.
Stop Investigating the Same Trip Twice
iFactory captures event evidence, guides root cause analysis and tracks every action until it is proven effective.
Illustrative. Categories follow the US DOE root cause guidance.