Every bar and rod mill producing long products — rebar, wire rod, merchant bars, specialty rounds, and engineered shapes — operates under a set of constraints that are fundamentally different from flat product rolling. The workpiece is being shaped in three dimensions simultaneously, with spread, elongation, and temperature interacting in ways that make dimensional control significantly more complex than in plate or strip mills. The finishing speeds on modern wire rod blocks exceed 120 meters per second, leaving mill operations virtually zero reaction time when a cobble begins to develop or when an ovality deviation emerges from a pre-finishing stand. The mills that consistently deliver tight dimensional tolerances, minimize cobble events, and maintain stable mechanical properties across long production runs are not necessarily the ones with the newest rolling equipment. They are the ones with the most complete, most continuous visibility into the temperature, speed, and reduction conditions at every stand in the rolling train — and the AI-driven analytical capability to turn that visibility into preventive action before a quality deviation becomes a cobble or a reject coil. iFactory's Long Product AI platform delivers that analytical layer for bar and rod mills, combining real-time stand-level process monitoring with predictive models that anticipate cobble risk, dimensional drift, and property deviation before they occur. Schedule a bar mill optimization assessment to evaluate how AI-driven temperature control, cobble prevention, and dimensional monitoring can improve your long product mill's yield and throughput.
Why Bar and Rod Mill Analytics Requires a Different Approach from Flat Product Monitoring
The analytical challenge in a long product mill is structurally different from flat product monitoring — and applying plate mill or strip mill methodologies to a bar and rod operation produces blind spots in the areas where long product quality is most vulnerable. In a bar mill, the workpiece undergoes a continuous series of cross-sectional shape transformations — from billet to rough oval to round to finished bar — across a rolling train that may include 12 to 28 stands depending on the product. Each stand in the train applies a specific reduction that depends on the entry shape, temperature, and stand speed, and the interaction between successive stands creates a compounding error risk: a 1% ovality deviation at stand 5 is amplified to 3-4% by stand 12. This shape-propagation dynamic does not exist in flat rolling and demands a fundamentally different monitoring framework.
iFactory's Long Product AI platform was purpose-built for this shape-propagation environment. The platform monitors each stand as an independent process event — entry shape class, rolling load, temperature, exit speed, and exit shape — and links successive stand measurements to detect developing dimensional drift before it reaches rejection threshold. The difference between catching an ovality trend at stand 14 versus stand 18 is the difference between a quick roll gap adjustment and a cobble that takes 45 minutes to clear from the cooling bed.
- Ovality and dimensional deviations detected at the cooling bed — after full processing cost incurred
- Temperature control managed by stand pyrometer readings without cross-stand correlation analysis
- Cobble root cause investigation begins after the cobble — data needed for prevention was never captured
- Roll gap adjustments based on operator judgment and end-of-run sample measurements
- Finishing block vibration monitored as a standalone signal — not correlated with incoming bar condition
- Mill utilization tracked as an aggregate OEE metric — stand-level bottlenecks invisible at shift level
- Ovality trend detected at stand 14 — corrective action applied before stand 18 passes it to the finishing block
- Cross-stand temperature correlation identifies the specific water box or inter-stand cooling zone causing drift
- Cobble risk score calculated in real time from speed, tension, and temperature data — preventive slowdown initiated
- AI gap optimization model recommends roll adjustments based on actual mill response, not scheduled values
- Finishing block vibration signature correlated with bar entry temperature and speed — bearing life prediction updated per coil
- Stand-level utilization and bottleneck analysis identifies the specific stand limiting overall mill throughput
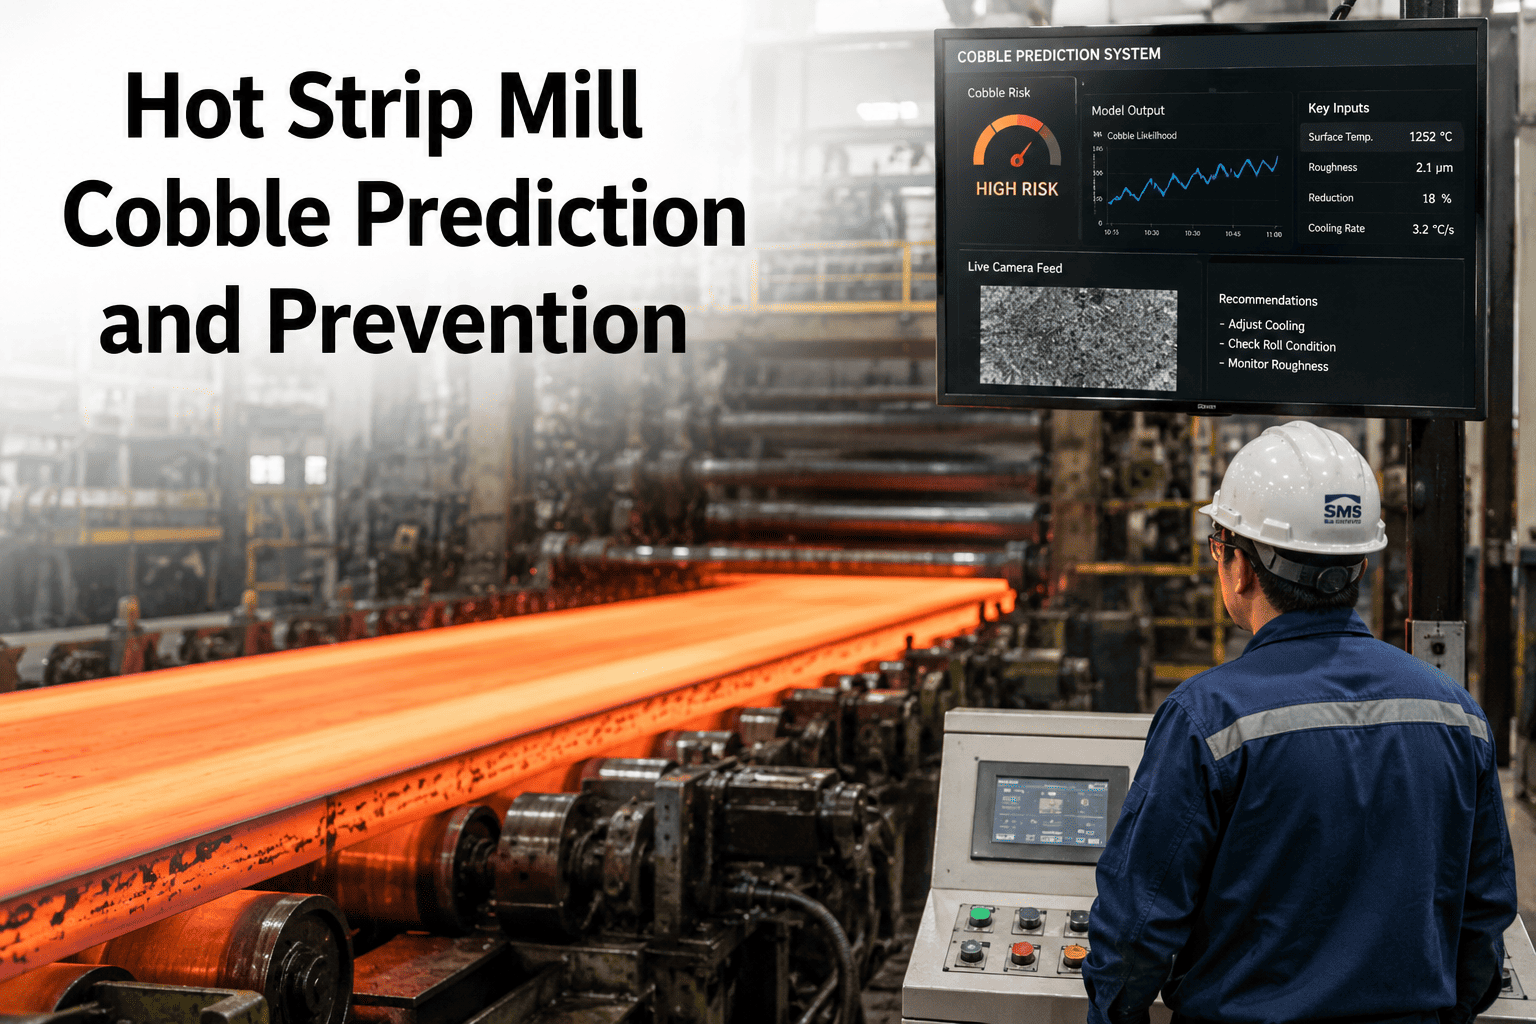
Temperature Control and Cobble Prevention: Real-Time Risk Detection Across the Rolling Train
Temperature uniformity across the billet length and between passes is the single most influential variable in bar and rod mill stability. A temperature differential of 30 to 50 degrees Celsius from the front to the tail of a billet — a common condition in mills with variable reheating furnace performance — produces enough change in deformation resistance to shift rolling loads, alter the spread pattern, and create tension fluctuations between stands that are the primary mechanism for cobble initiation. In a wire rod mill running at finishing speeds above 100 m/s, the distance between the first indication of a cobble and the actual cobble event is measured in meters of bar travel — roughly 0.3 to 0.8 seconds of reaction time. No operator can process that information and act within that window. The response must be automated, and the trigger must be predictive rather than reactive. Book a demo to see how iFactory's cobble prediction model works in high-speed rod mill environments.
Dimensional Control Analytics: Ovality, Roundness, and Cross-Section Consistency
Dimensional control in long product rolling is a shape-propagation problem. The ovality of the bar exiting a roughing stand becomes the entry condition for the intermediate stand, and any deviation at that stage is amplified through successive reductions as the bar is elongated and the section is refined. The final bar roundness that the customer measures with a micrometer at the receiving dock is the cumulative result of shape errors that began 15 stands upstream, and isolating the root cause of a finished dimensional deviation requires tracing the shape measurement backward through the stand sequence to identify where the deviation originated. This backward-tracing analysis is computationally intensive and not feasible with manual methods at production speed. iFactory's Long Product AI performs the full stand-to-stand shape propagation analysis for every billet in real time, giving process engineers the dimensional root cause identification that manual data collection and spreadsheets cannot deliver at any speed. Schedule a dimensional control review to benchmark your mill's ovality performance against AI-optimized benchmarks.
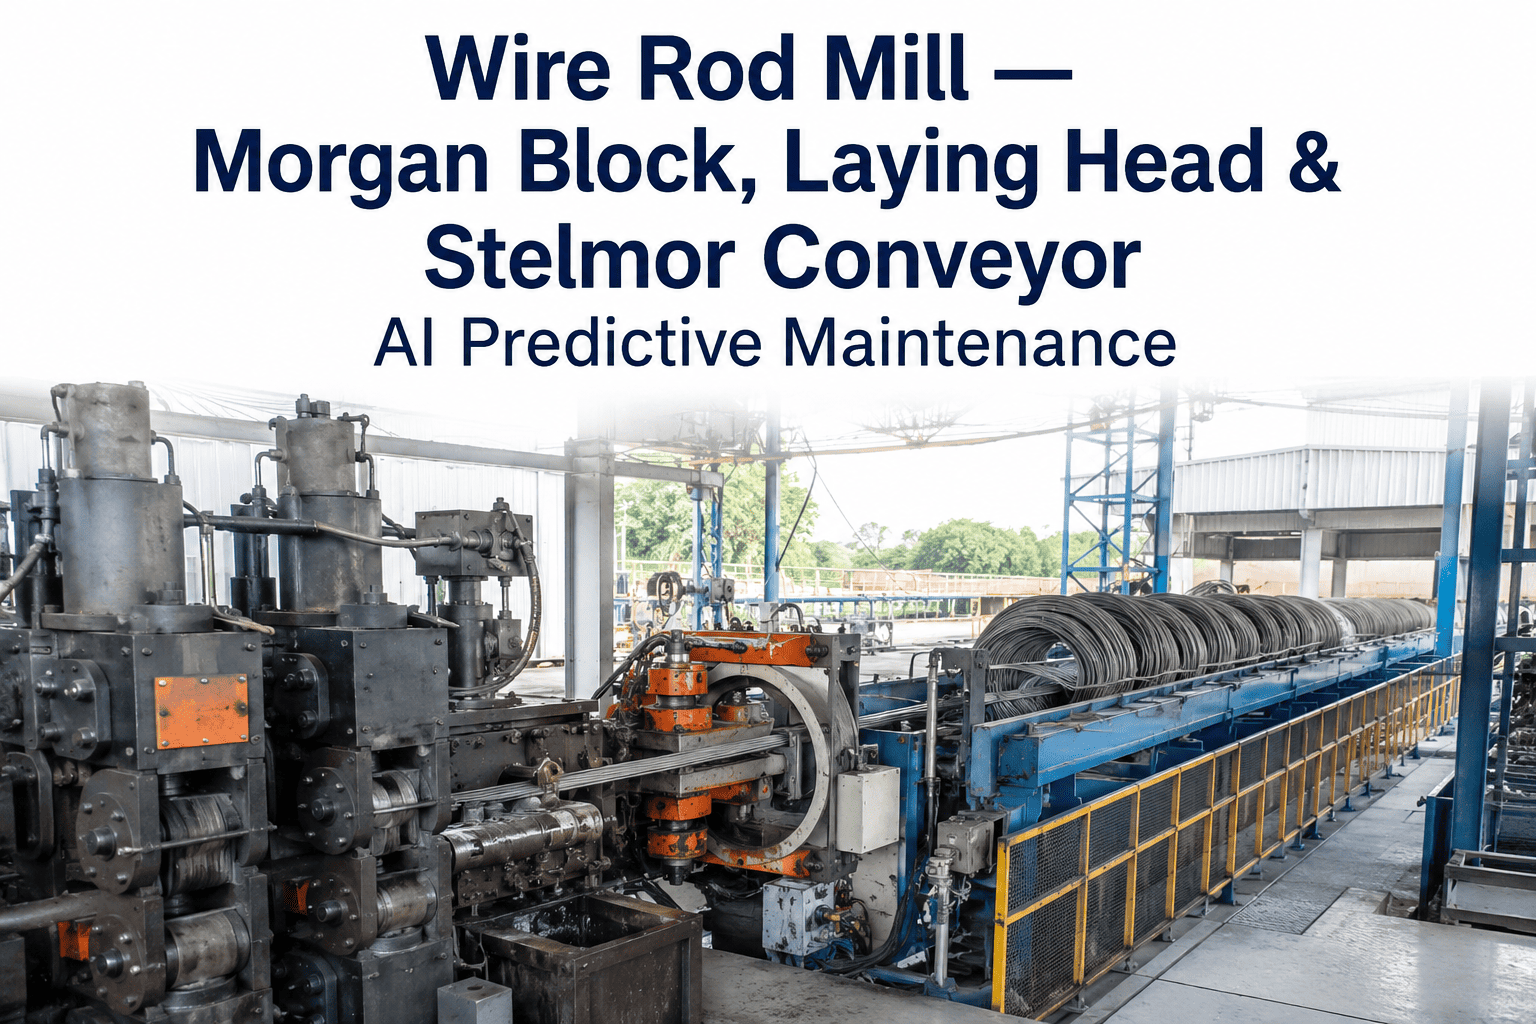
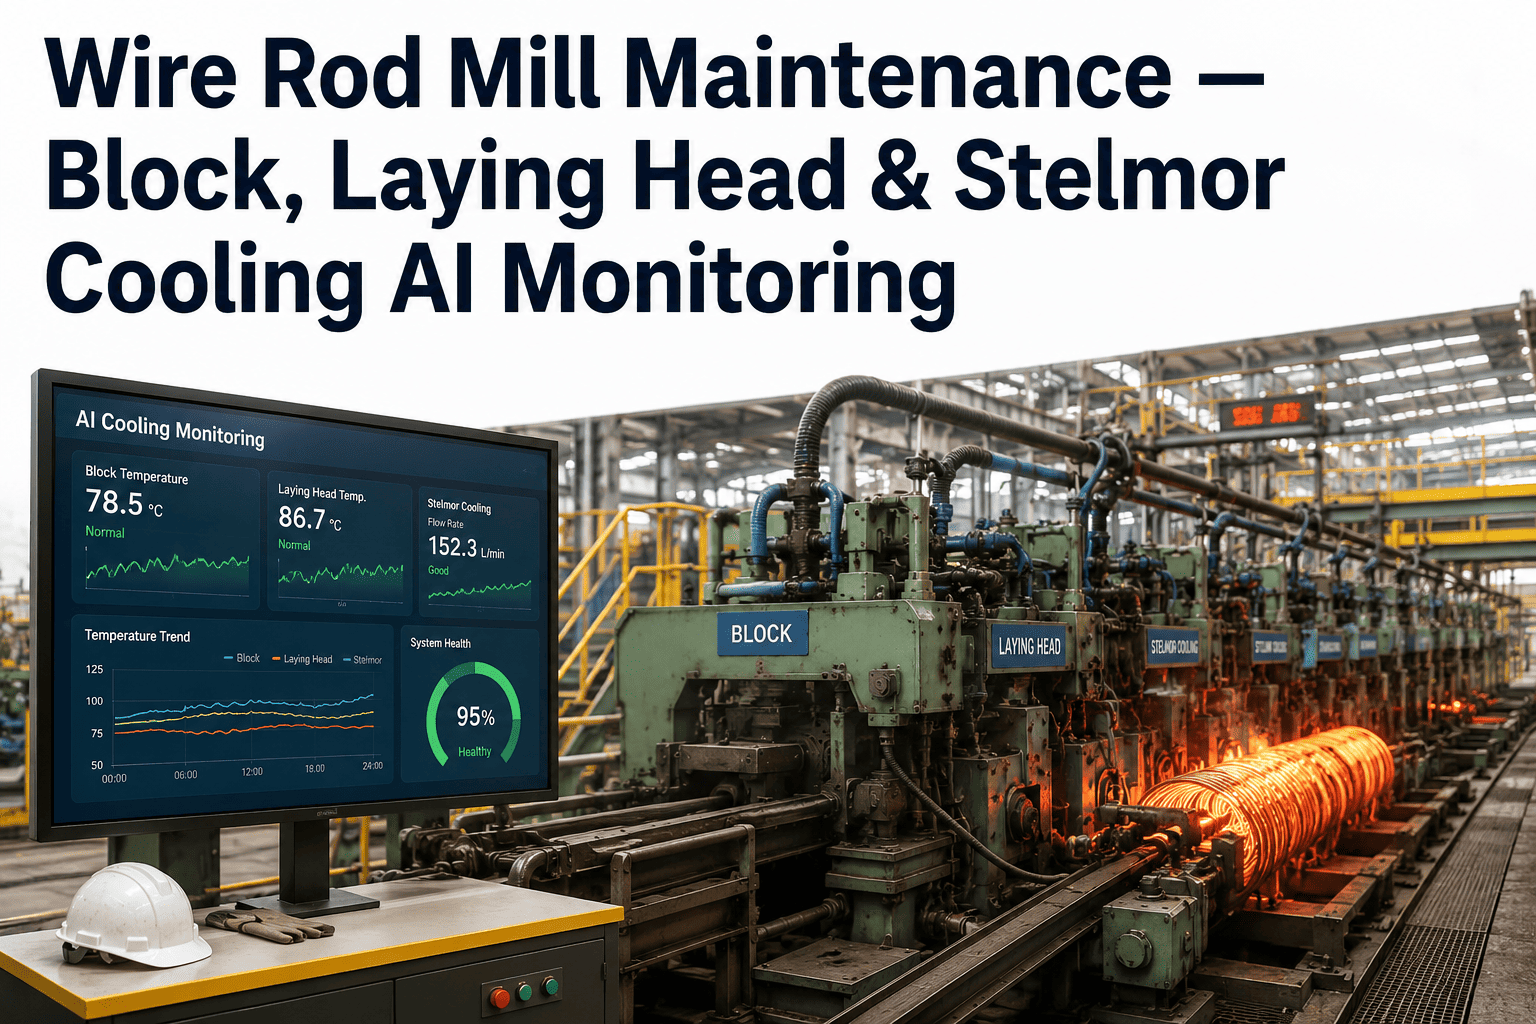
Finishing Block, Controlled Cooling, and Coil Quality Analytics
The finishing block — whether a no-twist mill for wire rod or a two-stand finishing group for bar — operates at speeds and reduction intensities that make it the highest-risk zone of the entire rolling train. The block compresses the total elongation into a compact physical space, and the combination of high speed, high reduction, and tight inter-stand distances means that even small deviations in entry shape, temperature, or tension are amplified into significant quality impacts within milliseconds of entering the block. For wire rod production, the controlled cooling process — the Stelmor line or equivalent — determines the final mechanical properties and surface quality of the coil, and the cooling rate profile across the ring pattern on the conveyor is the primary variable controlling the transformation of austenite to ferrite, pearlite, or bainite. iFactory's controlled cooling analytics module integrates finishing block exit parameters with cooling conveyor settings to predict finished wire rod mechanical properties before the coil reaches the compacting and bundling station.
| Process Zone | iFactory Monitoring Parameters | Quality Risk Detected | AI Response | Measured Improvement |
|---|---|---|---|---|
| No-Twist Finishing Block | Vibration signature, rolling load per stand, inter-stand tension, entry shape, exit speed | Bearing wear, roll pass shift, tension-induced ovality | Vibration trend analysis predicts bearing replacement timing — shape drift triggers upstream speed trim | 45% reduction in finishing block cobbles |
| Water Box / Inter-Stand Cooling | Water flow rate per zone, exit temperature, bar speed, pressure stability | Non-uniform cooling, incomplete temperature recovery, surface quench cracking | Flow rate adjustment recommended per grade — temperature recovery zone length optimized for each product | Surface defect rate reduced by 38% |
| Stelmor Controlled Cooling Conveyor | Ring pattern density, conveyor speed, cover position, fan zone air flow, entry and exit temperature | Non-uniform transformation, tensile strength deviation, decarburization | Cooling rate profile optimized per grade — ring pattern density adjusted via laying head speed modification | Tensile strength variation reduced from 52 MPa to 23 MPa |
| Coil Compacting & Bundling | Coil weight, compacting pressure, banding tension, coil geometry | Coil collapse during transport, banding failure, dimensional non-compliance | Compacting pressure optimized per coil weight and wire diameter — banding pattern verified before dispatch | Coil-related dispatch rejections reduced by 62% |
| Shear & Cutting Station | Cutting force per cycle, blade position accuracy, crop end length | Blade wear, crop length deviation, cold end accumulation | Blade change prediction from cutting force trend — crop length optimized per billet to maximize yield | Yield improvement of 1.8% from crop optimization |
| Roller Guide & Funnel Monitoring | Guide roller wear, opening drift, alignment angle, lubrication flow | Bar surface scratching, shape deviation, cobble initiation at guide entry | Guide replacement prediction from roller wear trend — alignment angle correction recommendation | Cobble rate at guide entry points reduced by 54% |
Expert Perspective: What AI Analytics Changes in Bar and Rod Mill Operations
Our wire rod mill was experiencing an average of 2.8 cobbles per shift — primarily in the no-twist finishing block — and each cobble cost us approximately 22 minutes of production time plus an average of 1.6 tonnes of scrap from the material that had to be cut out of the block. We had accepted this as a normal operating cost for high-speed rod production because we had no way to predict when a cobble was going to happen or what was triggering it. After deploying iFactory's cobble risk model — which monitors temperature, tension, shape, and load across every stand simultaneously — our cobble rate dropped to 0.9 per shift within 90 days. The platform was identifying cobble precursors that we had never connected: a specific temperature gradient pattern from the reheating furnace that produced a tension swing at stand 14, which the AI would flag 8 seconds before the cobble, giving us enough time for the mill PLC to reduce speed automatically. The annual cost saving from cobble reduction alone was over $1.8 million. The dimensional stability improvements — tighter roundness, fewer ovality rejects — added another $1.1 million in yield and reduced customer claims. The platform paid for itself in the first five months.
Frequently Asked Questions: Bar and Rod Mill AI Optimization
At minimum, iFactory requires access to the rolling mill's Level 2 process data historian containing stand-level rolling force, motor current, speed setpoints, pyrometer temperature readings, and guide position data. This is sufficient to begin cobble risk modeling, temperature analytics, and stand-level performance monitoring. For full dimensional quality integration — linking stand shape data to finished bar roundness and ovality — iFactory additionally connects to the dimensional gauge system and the Level 3 MES where quality measurements are recorded. Integration is typically completed in 1 to 2 weeks without production disruption.
iFactory maintains separate cobble risk models for each product family — rebar, wire rod, merchant bar, specialty rounds — because the cobble initiation mechanisms differ significantly between products. Wire rod cobbles are primarily driven by finishing block entry conditions, while rebar cobbles are more frequently initiated at the intermediate stand group where the deformation from the roughing oval to the finished section creates the highest tension sensitivity. The platform automatically loads the appropriate model set based on the production order and adjusts risk thresholds dynamically based on the mill's recent cobble history for each product family.
Yes. iFactory supports all major controlled cooling conveyor configurations, including Stelmor lines, cooling beds for bar products, and slow-cooling pit operations for specialty grades. The cooling analytics module adjusts its thermal model to the specific conveyor geometry, fan configuration, cover automation, and ring pattern parameters of each installation. For mills producing wire rod on a Stelmor line and bar products on a separate cooling bed, iFactory maintains independent cooling models for each system and correlates cooling performance with downstream mechanical property testing results.
Yes. iFactory integrates with all major long product mill automation platforms, including Siemens, ABB, Primetals, Danieli, and Nidec-Sundwig systems. The platform reads stand-level process data from the existing Level 2 historian via OPC-UA or Modbus TCP and writes cobble risk scores, temperature deviation alerts, and dimensional drift notifications to the operator level display. The platform operates as a monitoring and recommendation layer alongside the existing control system — it does not require modification to the Level 1 or Level 2 automation logic.
iFactory's long product mill deployments typically reach full cost recovery within 6 to 12 months of deployment, with cobble reduction delivering the fastest payback. For a mill producing 500,000 TPY with a cobble rate of 2.0 per shift costing $3,800 per cobble in scrap and downtime, reducing that rate to 0.8 per shift represents approximately $2.5 million in annual savings. Dimensional yield improvement — reducing ovality rejects from 1.8% to 0.9% — adds $0.9 to $1.6 million depending on product mix and market pricing. An ROI modeling session using your plant's specific production economics is available at no cost.
Conclusion: The Analytics Layer Your Bar and Rod Mill Has Been Missing
The gap between what a bar and rod mill is capable of producing and what it actually achieves on any given day is a data visibility problem before it is a mill equipment problem. Stands that could run at higher speeds are constrained by conservative setpoints that have not been reviewed since the last product mix change. Water boxes and cooling conveyors that are not perfectly tuned for the current product grade are consuming margin that shows up as rejected coils at the bundling station. Finishing block bearings that are approaching end of life are detected only when vibration reaches alarm level — not when the wear trend first began to accelerate. These are solvable problems, and they are solvable with the data that most bar and rod mills are already generating at every stand, on every billet, on every shift.
iFactory's Long Product AI platform brings stand-level process visibility, integrated cobble prediction, dimensional drift detection, and controlled cooling analytics to bar and rod mill operations that have been managing these risks in isolation. The result is a mill that produces fewer cobbles, delivers tighter dimensional tolerances, achieves more consistent mechanical properties, and dispatches more saleable tonnes per operating hour — with no new equipment and no capital approval required to begin. The data is already there. The analytics just needs to be applied to it.