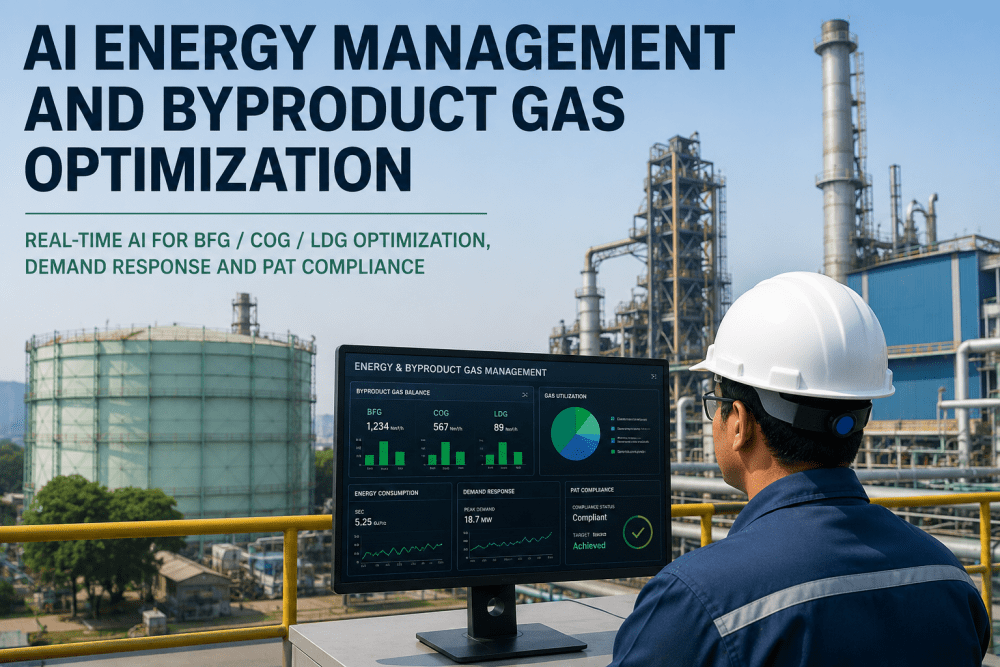
A typical integrated steel plant generates three distinct byproduct fuel gases — blast furnace gas (BFG) at 700–800 kcal/Nm³, coke oven gas (COG) at 4,000–4,500 kcal/Nm³, and Linz-Donawitz converter gas (LDG) at 1,800–2,200 kcal/Nm³ — with a combined energy content equivalent to 15 to 20 percent of the plant's total purchased fuel. Managing this energy in real time means continuously balancing variable gas generation against fluctuating consumer demand while maintaining gas holder levels within safe operating limits, minimizing flaring, and optimizing the fuel mix across boilers, reheat furnaces, annealing lines, and power generation turbines. Without AI-driven optimization, gas balance decisions rely on operator experience and rule-based systems that cannot anticipate generation swings or demand shifts fast enough to prevent either holder overfill events that force flaring or holder depletion events that force costly fuel oil or natural gas substitution. iFactory's Energy and Gas AI platform addresses this challenge by deploying machine learning models that predict gas generation 30 to 120 minutes ahead, forecast consumer demand based on production schedules, and compute optimal holder level trajectories that minimize flaring and purchased fuel consumption while maintaining compliance with PAT (Perform, Achieve, Trade) specific energy consumption targets and enabling participation in grid demand response programs. Energy managers evaluating AI solutions for their gas network can book a demo to review how the platform maps to their specific gas holder configuration and energy mix.
18%
Average reduction in specific energy consumption (SEC) across validated steel plant deployments, achieved through AI-optimized byproduct gas utilization and reduced purchased fuel dependency
95%
Byproduct gas utilization rate achieved by AI-optimized plants, compared with the industry average of 78–85 percent — representing measurable reductions in flaring and environmental impact
$2.4M
Average annual energy cost savings achieved through reduced purchased fuel, optimized gas holder operation, and demand response revenue across fully deployed steel plant implementations
12-16
Weeks to first gas optimization prediction after platform deployment — phased rollout across holder monitoring, generation forecasting, and consumer optimization without disrupting production
Assess Your Steel Plant's Energy Optimization Potential
A 30-minute consultation with iFactory's energy practice lead will map your gas holder configuration, consumer network, current utilization rate, and PAT compliance status against the AI optimization platform's capabilities. You will receive a quantified savings estimate and deployment timeline specific to your plant.
The Byproduct Gas Balancing Challenge in Integrated Steel Plants
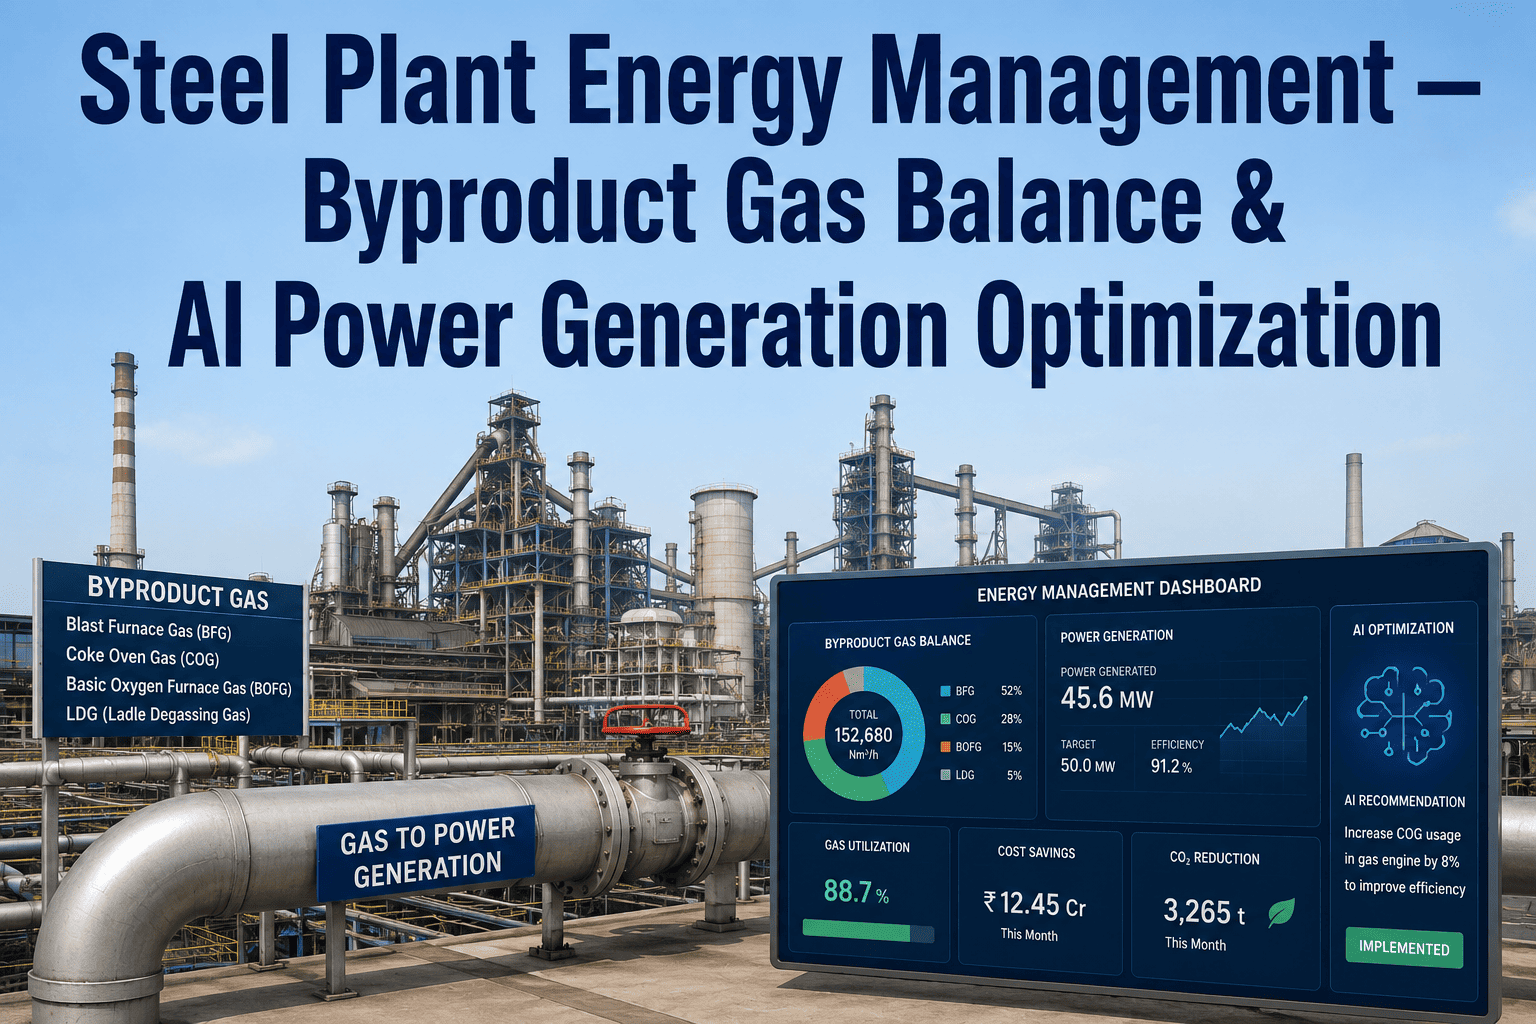
The energy network of an integrated steel plant operates as a continuous real-time balancing problem with three interdependent gas systems, each with distinct generation profiles, calorific values, and consumer compatibility constraints. BFG is produced continuously at 400,000 to 800,000 Nm³/hour from the blast furnace, with calorific value too low for direct use in reheat furnaces or annealing lines — it is typically enriched with COG or consumed in boilers and hot stoves. COG is produced continuously from the coke ovens at 80,000 to 150,000 Nm³/hour with high calorific value, making it the preferred fuel for quality-sensitive heating processes. LDG is produced in batch cycles during BOF blowing, lasting 15 to 20 minutes per heat, and must be captured, stored, and consumed within a narrow time window before the gas holder overflows. The optimization challenge is compounded by the fact that each gas type has separate storage holders with finite capacity, and the consumer network — boilers, reheat furnaces, soaking pits, annealing lines, and power turbines — has specific fuel compatibility and flow rate constraints. A mismatch between generation and consumption on any single gas system triggers either an expensive flaring event or a costly substitution with purchased natural gas or fuel oil.
Blast Furnace Gas (BFG)
Calorific Value: 700–800 kcal/Nm³
Production Rate: 400,000–800,000 Nm³/h
Primary Consumers: Boilers, hot stoves, power turbines (enriched with COG)
AI Challenge: Low CV makes holder management critical — overfill forces flaring, depletion forces fuel oil substitution in boilers
Coke Oven Gas (COG)
Calorific Value: 4,000–4,500 kcal/Nm³
Production Rate: 80,000–150,000 Nm³/h
Primary Consumers: Reheat furnaces, annealing lines, soaking pits, COG enrichment
AI Challenge: High value and limited storage make demand forecasting critical — every Nm³ flared is a direct energy cost loss
LD Converter Gas (LDG)
Calorific Value: 1,800–2,200 kcal/Nm³
Production Pattern: Batch (15–20 min per BOF heat)
Primary Consumers: Boilers, mixed gas networks, power generation
AI Challenge: Batch generation with narrow capture window requires predictive holder management to avoid flaring 10–15 percent of available gas
AI-Driven Real-Time Byproduct Gas Optimization Pipeline
iFactory's Energy and Gas AI platform processes data through a seven-stage optimization pipeline that transforms raw plant data — gas generation rates, holder levels, consumer flows, and production schedules — into actionable recommendations for gas balance, fuel mix, and demand response participation. All computation runs on an on-premise AI appliance with sub-second inference latency, ensuring control room operators receive real-time guidance without cloud dependency or data latency.
01
Stage 1: Multi-Source Data Acquisition and Fusion
IoT gateways ingest data from DCS historians, PLC networks, gas analyzer systems, holder level transmitters, and production scheduling systems at one-second to one-minute intervals. Data is timestamped, validated for sensor drift and communication errors, and fused into a unified real-time gas network model that tracks generation, storage, and consumption for all three gas types simultaneously.
02
Stage 2: Generation Forecasting — 30 to 120 Minute Horizon
LSTM neural network models predict BFG, COG, and LDG generation rates 30, 60, and 120 minutes ahead using blast furnace burden and wind parameters, coke oven coking cycle data, and BOF heat scheduling. BFG models capture tuyere level and top gas temperature influences. COG models track coking time and coal blend effects. LDG models predict generation volume per blow cycle based on lance position and oxygen flow rate. Forecast accuracy averages 93 percent at 30 minutes and 87 percent at 120 minutes.
03
Stage 3: Consumer Demand Forecasting by Production Schedule
Gradient-boosted regression models forecast gas demand for each major consumer — boilers, reheat furnaces, soaking pits, annealing lines, and power turbines — based on the production schedule, product mix, and planned operating rates. The demand model accounts for fuel switching constraints, minimum flow requirements, and ramp rate limitations for each consumer asset.
04
Stage 4: Optimal Holder Level Trajectory Computation
A constrained optimization engine computes the optimal holder level trajectory for the next 120 minutes for each gas system, balancing generation forecasts against demand forecasts while respecting holder upper and lower limits, minimum safety buffers, and flaring valve capacity. The objective function minimizes a weighted combination of flaring events, purchased fuel substitution, and holder level volatility. Optimization runs every five minutes or on demand when a significant schedule change occurs.
05
Stage 5: Fuel Mix Optimization Across Consumer Network
For mixed-fuel consumers (boilers and power turbines that can accept BFG-COG blends or switch to natural gas), the platform computes the optimal fuel mix that minimizes purchased fuel cost while maintaining combustion stability and meeting steam or power generation targets. The optimizer accounts for natural gas spot pricing, COG availability, and each boiler's efficiency characteristics at different fuel mix ratios.
06
Stage 6: Demand Response Signal Integration
When the plant receives a demand response curtailment signal from the grid operator, the platform computes the optimal load reduction strategy by adjusting gas consumption across the consumer network. It identifies which consumers can reduce load without affecting steel production, estimates the curtailment capacity in megawatts, and tracks the response in real time. Historical DR performance is logged for reconciliation and revenue verification.
07
Stage 7: Closed-Loop Validation and Model Retraining
Every gas balance recommendation is tracked through execution, with actual holder level outcomes, flaring events, and purchased fuel volumes compared against the platform's predictions. Deviations trigger automated model retraining cycles that incorporate the discrepancy and improve forecast accuracy. The continuous validation loop ensures the platform adapts to changes in blast furnace burden, coke oven coal blend, BOF operating practice, and production schedule patterns.
Schedule an Energy Management Consultation
Discuss your steel plant's gas network configuration, current utilization rates, and energy cost structure with an iFactory energy engineer. The consultation includes a live demonstration of the AI optimization platform using your plant's gas generation and holder data to show projected savings.
Demand Response, PAT Compliance, and SEC Reduction
Energy management in steel plants increasingly intersects with regulatory compliance and grid services revenue. India's PAT (Perform, Achieve, Trade) scheme mandates specific energy consumption reduction targets for steel plants, with excess energy savings convertible to tradable energy saving certificates (ESCerts). Grid demand response programs in North America and Europe offer revenue for load curtailment during peak events. The table below maps the compliance and revenue requirements against the AI platform's enabling capabilities.
Measured Results from Steel Plant Deployments
The metrics below represent average results from iFactory Energy and Gas AI platform deployments across integrated steel plants over 12-month periods. Individual results vary based on facility size, gas network complexity, existing energy management maturity, and deployment scope.
18%
Specific Energy Consumption Reduction
Measured reduction in gigacalories per tonne of crude steel, driven by optimized byproduct gas utilization and minimized purchased fuel consumption across boiler and furnace operations.
95%
Byproduct Gas Utilization Rate
AI-optimized plants achieve 95 percent utilization of BFG, COG, and LDG combined, compared with 78–85 percent industry average. Every percentage point increase represents $120,000–$200,000 in annual energy value.
42%
Reduction in Purchased Fuel Substitution
Natural gas and fuel oil consumption for holder shortfall management decreased by 42 percent, representing direct cost savings from avoided purchased fuel.
$2.4M
Average Annual Energy Cost Savings
Combined impact of reduced purchased fuel, increased byproduct utilization, demand response revenue, and ESCert earnings across fully deployed steel plant implementations.
12-16
Weeks to First Optimization Prediction
Phased deployment timeline from sensor integration and data validation to first AI-driven gas balance recommendation — enabling energy teams to begin realizing value within the first quarter.
7
Months to Full Platform ROI
Average payback period across steel plant deployments — driven primarily by purchased fuel reduction and increased byproduct gas utilization. Plants with demand response programs achieve ROI in 5 months or less.
Phase 1
Data Integration and Baseline
Gas holder sensors validated, DCS historians connected, generation and consumption baselines established — 3-5 weeks
Phase 2
AI Forecasting Activation
Generation and demand forecasting live on all three gas systems, holder level trajectory optimization active — 5-8 weeks
Phase 3
Full Optimization Deployment
Fuel mix optimization, demand response integration, DR program enrollment, SEC tracking, compliance reporting — 12-16 weeks
$2.4M
Annual Energy Savings
Average total annual savings across purchased fuel reduction, DR revenue, and ESCert earnings
Expert Perspective — Energy Management in Steel Manufacturing
The byproduct gas network in an integrated steel plant is the most complex energy optimization problem I have encountered in 30 years of industrial energy management. You have three gas streams with completely different generation profiles, four to six holders with finite capacity, and a consumer network that includes everything from blast furnace hot stoves that operate cyclically to power turbines that need stable fuel quality. Before AI, our best approach was a rule-based system that worked reasonably well in steady-state conditions but consistently failed during transitions — a blast furnace blow-in, a coke oven battery push schedule change, or a BOF reline that shifted LDG generation patterns for weeks. The AI platform does not replace the operator's judgment; it gives the operator a 60-minute to 120-minute look-ahead that transforms gas balance from a reactive firefighting exercise into a proactive optimization decision. Our flaring rate dropped from 18 percent to 6 percent in the first six months, and our purchased natural gas consumption for fuel substitution fell by 38 percent.
Energy Management Director
30 Years in Steel Manufacturing Energy Management — Integrated and Mini-Mill Experience
The PAT scheme compliance requirement was the initial driver for our investment in AI-driven energy management — we needed to demonstrate a 4 percent SEC reduction over three years, and our traditional energy management approach was not going to get us there without capital-intensive process modifications. What we discovered was that the AI platform delivered SEC reduction through operational optimization alone, without any capital expenditure on new equipment. The platform identified that we were running our boiler house with a BFG-COG blend that was richer than necessary for the steam demand, effectively burning high-value COG where low-value BFG would have sufficed. Adjusting the fuel mix based on the platform's recommendation reduced our COG consumption in the boilers by 14 percent, freeing that COG for use in the reheat furnaces and reducing natural gas consumption in the furnaces by 22 percent. The SEC reduction paid for the platform in six months, and we are now enrolling in demand response programs to generate additional revenue from our optimization capability.
Energy Manager — Integrated Steel Plant
18 Years in Steel Plant Energy Optimization, Certified Energy Auditor
Conclusion: AI Energy Optimization Is the New Standard for Steel Plant Energy Management
The steel industry has traditionally approached energy management as a monitoring function — track generation, track consumption, and react when holder levels approach limits. The AI-driven approach transforms energy management into a predictive optimization function: forecast generation before it happens, anticipate demand based on production schedules, compute optimal holder level trajectories, and adjust the fuel mix in real time to minimize cost and maximize byproduct utilization. The 18 percent SEC reduction, 95 percent gas utilization rate, and $2.4 million in annual energy cost savings that iFactory's Energy and Gas AI platform delivers across steel plant deployments are not theoretical projections — they are measured results from operating facilities that have made the transition from reactive gas balance to AI-optimized energy management. For energy managers and sustainability directors evaluating their path to PAT compliance, ISO 50001 certification, or demand response enrollment, the choice is clear: AI-driven energy optimization delivers the required outcomes without capital-intensive process modifications, and the gap between plants that have adopted AI energy management and those that rely on traditional monitoring will continue to widen as AI models improve and energy costs rise.
Frequently Asked Questions
Deploy AI Energy Management Across Your Steel Plant
iFactory's Energy and Gas AI platform is deployed and validated across integrated steel plants, optimizing BFG, COG, and LDG holder networks, reducing purchased fuel consumption, and enabling PAT compliance and demand response participation. Speak with an iFactory energy engineer about your plant's gas network configuration, current utilization rates, and energy cost reduction targets.
18% SEC Reduction
95% Gas Utilization
$2.4M Annual Savings
12-16 Week Deployment
7-Month ROI