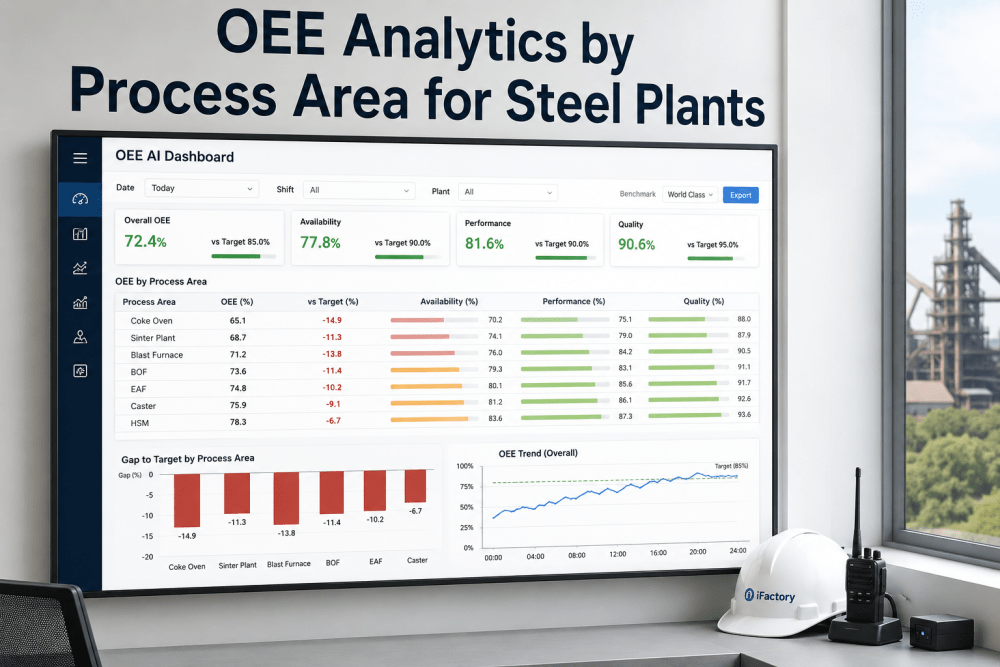
Overall Equipment Effectiveness has been the standard metric for manufacturing productivity since Nakajima formalized the OEE framework as part of Total Productive Maintenance in the 1980s and the methodology — Availability multiplied by Performance multiplied by Quality — remains the most effective single-number measure of production efficiency. In an integrated steel plant, however, OEE faces a structural problem that most plants have not solved: the metric is calculated at plant level or department level, which averages the performance of seven fundamentally different process areas — coke oven, sinter plant, blast furnace, BOF, EAF, continuous caster, and hot strip mill — into a single number that hides where the real losses are occurring. A plant-level OEE of 82 percent can mask a coke oven running at 84 percent OEE with a coking time deviation that is slowly degrading battery health a blast furnace at 87 percent OEE with a tuyere-level blow distribution problem that reduces iron production by 40 tons per day, and a hot strip mill at 81 percent OEE where cobble rates have been climbing for six weeks without triggering a formal investigation. iFactory's OEE AI Dashboard solves this by calculating OEE, Availability, Performance, and Quality at the process-area level with automated loss categorization, real-time gap-to-target visualization, and AI-driven root-cause identification that pinpoints the specific loss driver in each area. Plant operations heads evaluating OEE modernization for their facility can book a demo to review how the platform maps to their specific process areas and production targets.
Gap-to-Target Analysis — Quantifying the Opportunity per Process Area
A gap-to-target OEE of 82 percent plant-wide does not tell the operations head where to invest improvement resources. The iFactory OEE AI Dashboard calculates the gap between current OEE and target OEE for each process area independently and translates the gap into annual production impact and financial value, enabling data-driven prioritization of capital and maintenance spending. The table below shows the gap analysis for a typical 3-million-ton-per-year integrated steel plant with a target of moving from 82 percent plant-wide OEE to 92 percent over a 24-month improvement program.Book a Demo
| Process Area | Current OEE | Target OEE | Gap | Annual Production Impact | Annual $ Opportunity |
|---|---|---|---|---|---|
| Coke Oven | 84% | 92% | 8% | 42,000 tons coke | $4,200,000 |
| Sinter Plant | 80% | 90% | 10% | 60,000 tons sinter | $5,000,000 |
| Blast Furnace | 87% | 94% | 7% | 65,000 tons iron | $5,800,000 |
| BOF | 84% | 91% | 7% | 50,000 tons steel | $1,200,000 |
| EAF | 76% | 89% | 13% | 85,000 tons steel | $7,600,000 |
| Caster | 85% | 93% | 8% | 48,000 tons slab | $3,900,000 |
| HSM | 81% | 90% | 9% | 55,000 tons coil | $5,100,000 |
Availability, Performance, and Quality — The Three Levers across Seven Process Areas
The OEE formula decomposes into three independent loss categories that behave differently in each process area. Availability losses in the sinter plant are dominated by planned maintenance windows for strand components, while in the EAF they are driven by unplanned delays from electrode breaks and roof refractory repairs. Performance losses in the blast furnace stem from blow rate efficiency correlated with campaign age, while in the HSM they come from speed reduction during cobble recovery. Quality losses are most significant in the BOF and caster, where chemistry deviations and surface defects generate downgrade revenue loss. Understanding which lever to pull in which area requires OEE data at the process-area level, not a plant-wide number. The comparison below shows how the traditional plant-wide approach obscures area-level APQ dynamics versus the iFactory OEE AI Dashboard that surfaces each area independently.Book a Demo
- Single OEE number of 82 percent reported daily — operations head cannot determine whether the 0.5 percent decline from yesterday is in the coke battery, BOF, or caster without manual investigation across multiple data sources
- Availability, Performance, and Quality averaged across all areas — the EAF Availability loss of 16 percent is hidden by the blast furnace Availability of 97 percent, making the plant-wide Availability of 93 percent misleadingly healthy
- Loss categorization by Six Big Losses applied at plant level — a plant-level "equipment failure" category aggregates BF tuyere changes, caster SEN exchanges, and HSM cobble recovery into a single bucket that provides no actionable insight
- Gap-to-target calculated as a single number — operations head knows the plant is 10 percent below the 92 percent target but has no data on which area contributes the largest share of the gap or which improvement program will deliver the highest ROI
- Monthly OEE reviews with shift-level data that is 30 days old by the time it reaches the operations review meeting — improvement actions are based on stale data and lagging indicators
- OEE calculated independently for each of the seven process areas and displayed in a single dashboard — the operations head can see within 500 milliseconds of shift end that coke oven OEE dropped to 82 percent due to a Performance loss from coking time deviation in ovens 24 through 31
- Availability, Performance, and Quality reported per process area with independent targets and control limits — the EAF Availability of 84 percent is visible alongside the BF Availability of 97 percent, with each area's APQ tracked against its own benchmark
- Loss categorization automated per area with AI-driven root-cause tagging — the platform distinguishes between tuyere-level blow distribution losses in the BF, mold level variation defects in the caster, and threading transition cobbles in the HSM, each tagged with the specific equipment and process parameter involved
- Gap-to-target calculated per area and aggregated into a plant-wide view with financial quantification — operations head sees that the EAF contributes 32 percent of the total OEE gap, the HSM contributes 22 percent, and closing the EAF gap alone would recover $7.6 million per year
- Real-time OEE dashboards updated with every coil, heat, or shift — operations head and area managers have current OEE data within seconds of production completion, enabling same-shift intervention on developing loss patterns
AI Benchmarking and the OEE Digital Twin
The OEE AI Dashboard extends beyond measurement into prediction and simulation through its digital twin capability. The AI engine builds a process-area-level OEE model that simulates the impact of improvement actions before they are deployed, enabling the operations head to evaluate scenarios — "what is the OEE impact of reducing coking time deviation from 45 minutes to 20 minutes?" or "how much would a $500,000 tuyere replacement program improve blast furnace OEE?" — using the plant's own data rather than generic industry benchmarks. The workflow below describes how the OEE digital twin operates across the seven process areas.
Industry Expert Perspective: OEE at the Process-Area Level Changes How You Run a Steel Plant
I spent eight years as plant operations head at a 2.6-million-ton integrated steel mill, and for the first five of those years I was managing OEE blind. Every morning I would get a report that said plant-wide OEE was 83.4 percent, and every morning I would ask my area managers what happened and get a different answer from each one. The coke plant manager would say coking time was within limits, the BF manager would say blow rate was normal, the caster manager would say surface quality was fine — and collectively, 83.4 percent told me nothing about where to focus. We installed iFactory's OEE AI Dashboard as a pilot across the EAF, caster, and HSM, and within the first two weeks the platform showed me something I had missed for three years: the EAF tap-to-tap time was drifting upward by 0.3 minutes per month, compounding into a 6 percent Availability loss that I had been attributing to "normal furnace operations" because the plant-wide number never triggered a threshold. The AI engine calculated that this drift alone was costing us $1.8 million per year in lost melting capacity. We replaced the furnace roof refractories two weeks ahead of the planned campaign end, which recovered 4.2 minutes of tap-to-tap time and added 18,000 tons of production in the following quarter. That single data point — a trend visible only at the process-area level, not in the plant-wide average — paid for the platform deployment three times over in the first six months. For any operations head who is managing a steel plant using a single OEE number, I would say the same thing: the number is lying to you. Break it down by area, break it down by APQ, and let the AI find the patterns that your monthly reports are hiding.
Conclusion: Process-Area-Level OEE Is the Foundation for Steel Plant Productivity Improvement
The OEE framework was designed to give manufacturing leaders a single number that captures the combined effect of equipment availability, production speed, and product quality. In a steel plant with seven fundamentally different process areas, that single number is not enough — it averages the efficient areas with the inefficient ones, hides developing loss patterns behind stable plant-wide trends, and prevents the operations head from allocating improvement resources where they will deliver the highest return. iFactory's OEE AI Dashboard solves this structural problem by calculating OEE, Availability, Performance, and Quality at the process-area level with automated data ingestion, AI-driven loss categorization, real-time gap-to-target visualization, and digital twin scenario simulation that enables the operations head to manage each area independently while maintaining a unified view of plant-wide performance. For operations heads and plant managers evaluating OEE modernization, the path forward is clear: plant-wide OEE tells you that you have a problem; process-area-level OEE tells you exactly where the problem is and how much it is costing you.Book a Demo