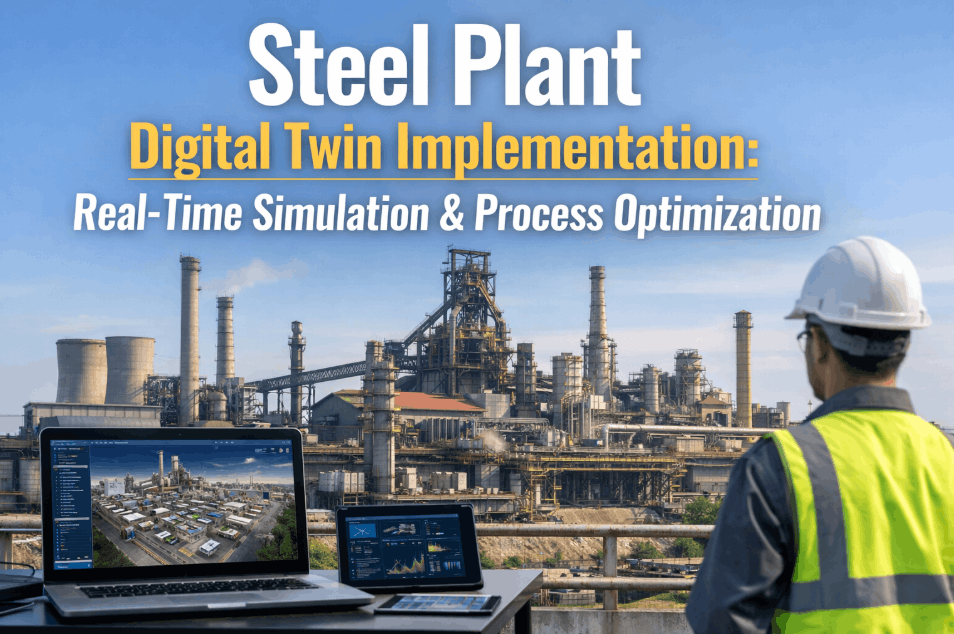
A steel plant is not one process. It is a chain of interdependent high-temperature, high-speed operations where a failure in any link cascades into every downstream process within minutes. A blast furnace cooling leak forces ironmaking offline. A caster breakout halts steelmaking and backs up the converter. A rolling mill bearing seizure stops production while upstream ladles queue and cool. The problem is that most plants monitor each stage separately — different screens, different teams, different data systems. Nobody has a unified, real-time view of the entire production flow. That blind spot between stages is where the most expensive losses hide.
End-to-End Production Intelligence
One Screen. Every Stage. Every Metric. Every Second.
Live process flow monitoring that connects scrap yard to finished goods, turning 10,000+ sensor data points per hour into real-time operational intelligence
15,000-40,000
Maintainable assets in a typical integrated steel plant
4,200+
Parameters monitored per furnace alone
16%
Of manufacturers have real-time shop floor visibility today
The Complete Steel Process Flow — And What AI Monitors at Each Stage
From raw material entry to finished coil dispatch, every stage generates data that affects the next. Live process flow monitoring doesn't just watch each stage — it connects them, so a deviation at the furnace automatically adjusts expectations at the caster and mill before problems arrive.
Scrap mix composition
Moisture content
Inventory levels
Feed rate
AI analyzes scrap composition via sensors and vision systems, optimizing the charge mix before it enters the furnace. Detecting moisture anomalies early prevents dangerous steam explosions and energy waste during melting.
Arc stability
Energy kWh/ton
Tap-to-tap time
Temperature
Electrode wear
Real-time monitoring of melting conditions, energy consumption, and arc behavior. AI detects electrode wear patterns, arc instability, and scrap irregularities, adjusting power profiles to minimize energy per ton while hitting target chemistry.
Chemistry targets
Alloy additions
Temperature hold
Ladle refractory
Thermal imaging monitors ladle refractory condition in real time, detecting hotspots that indicate thinning before a breakout occurs. AI tracks alloy additions against target chemistry and signals deviations within seconds.
Casting speed
Mold level
Breakout risk
Segment alignment
Surface quality
Mold condition monitoring and breakout prediction prevent the most catastrophic failure in steelmaking — a caster breakout that can cost $500,000+ in a single event. AI tracks segment roller temperatures and strand quality in real time.
Zone temperatures
Slab tracking
Fuel consumption
Discharge temp
Slab-level thermal modeling tracks every piece through 5-7 heating zones. AI dynamically adjusts zone temperatures for each slab's grade and dimension, responding to mill delays in seconds instead of the 10-30 minutes manual control requires.
Mill speed
Gauge accuracy
Strip profile
Stand loads
Surface defects
At 15-20 meters per second, AI vision systems inspect 100% of strip surface at full production speed, classifying scratches, scale patterns, and edge cracks in real time. Vibration signatures predict bearing failures 6-8 hours before speed restrictions appear.
Coiling temp
Mechanical properties
Coating weight
Packaging status
Final quality verification links finished product properties back to every upstream process parameter, building a complete digital genealogy for each coil. AI predicts mechanical properties from process data before physical testing completes.
This entire flow — on one screen, updating in real time. Book a demo to see your plant's process flow come alive.
Why Monitoring Stages Separately Is Costing You Millions
Most steel plants have monitoring at each stage. The problem is that these systems don't talk to each other. When the caster slows down, the furnace doesn't know. When the furnace over-heats a slab, the mill discovers it too late. The gaps between stages are where cascading failures originate.
Furnace over-heats slabs by 30°C during undetected mill delay
→
Excess scale forms on slab surface
→
Mill produces surface defects for 45+ minutes before detection
→
Result: Downgraded product, wasted fuel, customer quality claim
Caster nozzle clogging reduces casting speed by 15%
→
Ladles queue upstream, steel cools beyond spec
→
Reheating required, furnace schedule disrupted
→
Result: $500K+ in cascading losses from a single nozzle event
Scrap composition variance undetected at charge
→
Chemistry target missed at ladle refining
→
Mechanical properties fail at finished product testing
→
Result: Entire heat downgraded or scrapped — origin invisible without connected monitoring
Each stage has its own screen and team
Problems discovered when they arrive downstream
Root cause analysis takes days across departments
No automatic upstream/downstream coordination
55-65% of maintenance remains reactive
Unified dashboard shows every stage simultaneously
Deviations trigger alerts across the entire chain
AI traces root cause to origin in minutes
Upstream changes auto-adjust downstream parameters
Predictive insights shift maintenance to proactive
The IoT Sensor Architecture That Makes It Work
Real-time process flow monitoring requires data from thousands of sensors across extreme environments — temperatures exceeding 1,500°C, airborne metallic dust, and constant vibration. Here's the four-layer architecture that connects sensor data to operational decisions in milliseconds.
Layer 1
Physical Sensors
Temperature, vibration, pressure, and fluid sensors installed directly on critical equipment — furnaces, casters, rolling mills, motors, pumps, and hydraulic systems. Industrial-grade housings in stainless steel or ceramic protect against extreme conditions. Type K, S, and R thermocouples handle up to 1,700°C. Piezoelectric accelerometers withstand rolling mill vibration.
Thermocouples
Accelerometers
Pressure transducers
RTDs
Flow meters
IR cameras
Layer 2
Edge Processing
Industrial gateways aggregate sensor signals and perform initial processing — filtering noise, running threshold alerts, and compressing data before transmission. Edge AI runs ML models directly on the device, performing inference in milliseconds without cloud dependency. For a caster bearing that can cascade into a $500,000 breakout in 60 seconds, edge speed is critical.
Layer 3
AI Analytics Platform
Process data from all stages converges into a unified AI engine that correlates parameters across the entire production chain. The platform integrates with existing SCADA, DCS, and process historians via OPC-UA, OSIsoft PI, and standard APIs — no replacement of current infrastructure required. Most plants already collect 70-80% of the data they need.
Layer 4
Live Dashboard & Action Layer
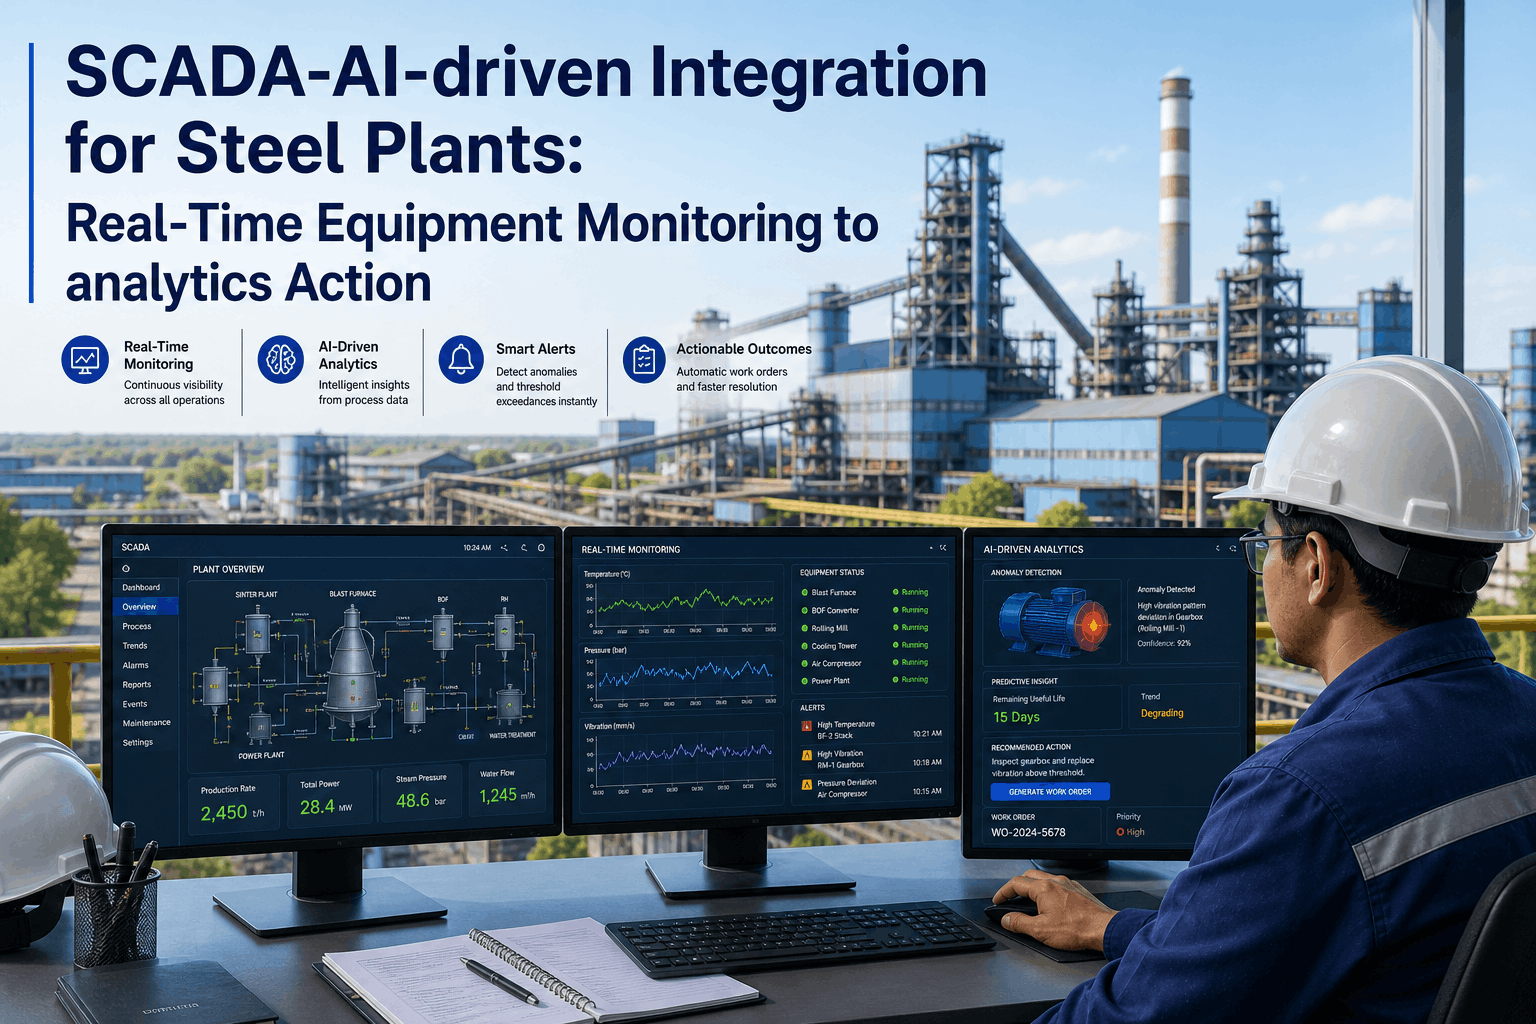
The unified process flow dashboard presents the complete production chain on a single screen — accessible from control rooms, mobile devices, or large-format displays on the shop floor. AI predictions become prioritized alerts with equipment ID, failure mode, severity, recommended action, and supporting sensor data. Critical findings escalate immediately; routine insights batch into planned actions.
Your Plant Already Has 70-80% of the Data. The Gap Is Connecting It.
iFactory bridges the gap between isolated sensor networks and unified production intelligence. No rip-and-replace. Connect your existing SCADA, PLCs, and historians into one real-time process flow dashboard with AI that turns data into decisions.
What Plant Managers See Every Morning
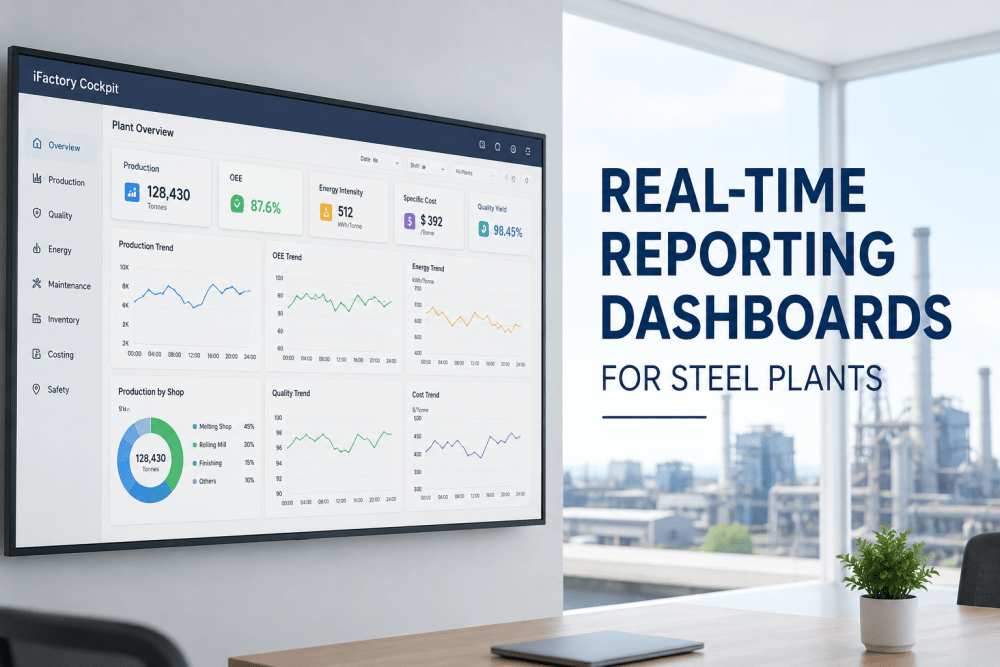
Forget cycling through 12 screens across 5 systems. A single unified view shows the health of every production stage, highlights bottlenecks, and surfaces the three or four things that need attention right now.
iFactory — Live Process Flow
All Systems Connected
Scrap Yard
Feed: 245 t/hr
Normal
Caster
1.2 m/min
Speed -8%
Finishing
96.2% FPY
Prime
AI Alert
Caster strand 2 speed reduced 8% due to nozzle clogging pattern. Reheat furnace zone 3 auto-adjusted -15°C to prevent over-heating queued slabs. Estimated upstream impact: zero if nozzle addressed within next sequence break. Maintenance work order #4827 auto-generated.
The Business Case: Connected Monitoring vs. Siloed Systems
Unplanned Downtime Cost
Industry Average
$1.2M+ per day
With Connected Monitoring
Predict failures 2-8 weeks ahead
Reactive Maintenance
Without Real-Time Data
55-65% reactive
With AI Process Monitoring
Shift to 80%+ planned work
Root Cause Analysis Time
Siloed Systems
Days across departments
Connected Flow Monitoring
Minutes with full data trail
Quality Traceability
Traditional
Post-production lab testing
AI-Powered
Real-time digital genealogy per coil
Frequently Asked Questions
What does live process flow monitoring actually show?
A single unified dashboard displays every production stage from raw materials through finished goods, with real-time KPIs at each stage — temperature, speed, throughput, energy, quality metrics. AI highlights deviations, predicts downstream impacts, and auto-generates alerts when any parameter drifts outside optimal range. Think of it as a control tower for your entire plant, not just individual equipment.
Do we need to install new sensors across the entire plant?
Most steel plants already collect 70-80% of the sensor data needed for live process monitoring. The system integrates with your existing SCADA, DCS, PLCs, and process historians through standard protocols like OPC-UA and standard APIs. New wireless sensors with 5-10 year battery life can fill any gaps without running cables — a maintenance team can instrument 200 assets in a week.
How does connected monitoring prevent cascading failures?
When the caster slows down, siloed systems let the furnace keep heating slabs at full power for 10-30 minutes before anyone adjusts. Connected monitoring detects the speed change instantly and auto-adjusts upstream and downstream parameters — the furnace reduces energy, the ladle schedule adapts, and the mill recalibrates. This prevents the cascade before it starts.
What is the ROI of plant-wide process monitoring?
Steel plants with connected monitoring consistently report major gains: unplanned downtime reduced by shifting to predictive maintenance, energy savings of 5-12% from coordinated furnace-mill control, quality improvements from real-time traceability, and faster root cause analysis that cuts investigation time from days to minutes. Payback typically arrives within the first year.
Can the system work with our legacy equipment?
Yes. iFactory connects to virtually any equipment, from decades-old PLCs to modern systems. Integration uses OPC-UA bridges for direct PLC/DCS connection, standard APIs for process historians like OSIsoft PI and Honeywell PHD, and wireless sensor gateways for assets without existing instrumentation. The system adds intelligence on top of your current infrastructure — nothing gets replaced.
Stop Managing Your Plant Through 12 Screens and 5 Systems
iFactory connects every stage of your steel production into one live, intelligent dashboard. See deviations before they cascade. Trace quality issues to their origin in minutes. Make decisions based on what's happening now — not what happened yesterday.