Lubrication is the most frequently performed maintenance task in any steel mill — and the most inconsistently executed. A single grease gun used on the wrong fitting, a hydraulic oil fill with the incorrect ISO viscosity grade, or an extended oil change interval on a gearbox operating under higher-than-rated load can initiate a failure sequence that costs $50,000 to $500,000 in unplanned downtime, component replacement, and production loss before the root cause is traced back to the lubrication event that started it. Steel mills that treat lubrication as a scheduled task rather than a precision engineering discipline are losing money on every shift — in accelerated wear reduced equipment efficiency, and maintenance cost that should have been avoidable. AI-driven oil analysis and lubrication program management changes this by applying continuous oil quality monitoring, automated particle count trending, and data-driven lubrication interval optimization to every critical asset class in the mill. The lubrication engineers who schedule a lubrication program assessment with iFactory are finding that the oil analysis data they have been collecting manually for years contains the predictive signals they need to transform lubrication from a cost center into a reliability driver.
Your Oil Analysis Program Is Generating Data — but Is It Generating Intelligence?
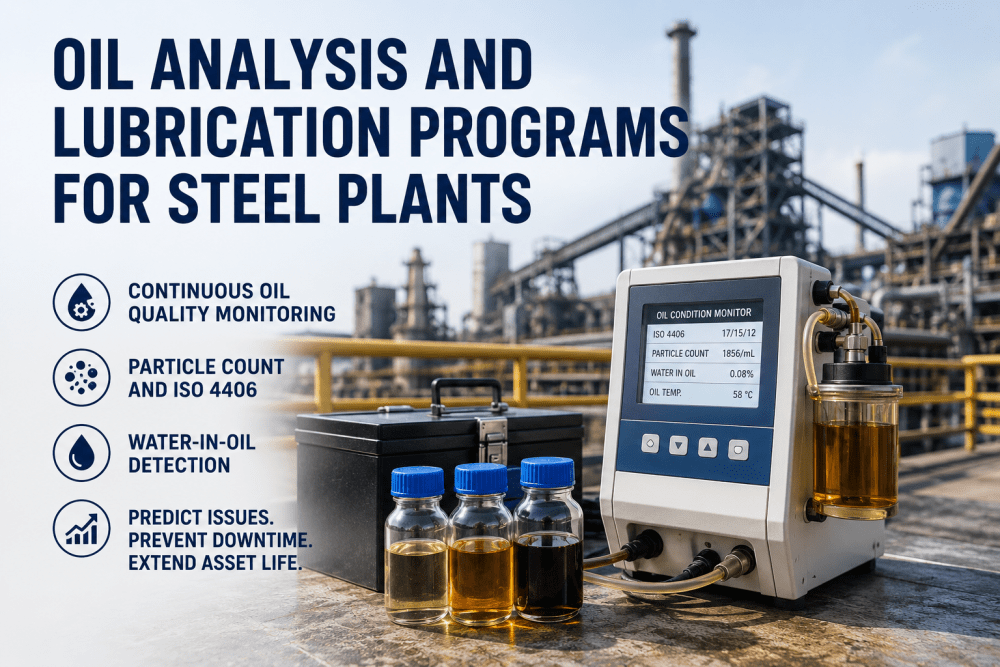
iFactory's Oil and Lube AI platform transforms your existing oil sampling data, sensor streams, and lubrication records into a continuous predictive model that identifies contamination events, lubricant degradation, and impending wear before they cause production losses. Purpose-built for steel mill lubrication programs.
The Real Cost of Lubrication Inconsistency in Steel Mills
The gap between a world-class lubrication program and an average one is not measured in the quality of the lubricant purchased — it is measured in the consistency and precision with which the right lubricant reaches the right component at the right interval, in the right quantity, under the right contamination control conditions. Most steel mills operate lubrication programs that are strong on procurement specifications and weak on execution discipline. Oil sampling is performed on schedule, but the results are reviewed days or weeks after collection — long after the contamination event or degradation trend that the sample was meant to detect has already progressed. Grease intervals are set during equipment commissioning and rarely adjusted for actual operating conditions. Oil change frequencies are determined by manufacturer recommendations that assume constant-duty operation rather than the thermal cycling, moisture ingress, and particulate loading that characterize steel mill equipment service. Book a lubrication program review
Particle Contamination
ISO 4406 cleanliness targets are set but rarely verified between sampling intervals. A gearbox operating at ISO 22/20/17 instead of the target 18/16/13 experiences 3 to 5 times faster wear rates — reducing gear and bearing life by 40 to 60 percent while the contamination goes undetected between quarterly samples.
Water Ingress
Water in oil accelerates bearing fatigue life by a factor of 10 at saturation levels above 500 ppm. Steel mill equipment — rolling mill gearboxes, caster hydraulics, cooling tower fan drives — operates in high-moisture environments where water ingress through seals and breathers is continuous but water content is typically tested only during scheduled oil sampling.
Viscosity Degradation
Thermal and oxidative stress degrades oil viscosity over time, reducing film thickness at the load zone and increasing boundary contact between rolling elements and raceways. A viscosity loss of 10 percent from the original grade doubles the wear rate in heavily loaded gear sets — a condition that periodic sampling often misses because degradation accelerates rapidly in the final weeks before oil change.
Additive Depletion
Anti-wear, extreme-pressure, and rust-inhibitor additives deplete at rates that vary with operating temperature, water contamination, and particulate loading. Without continuous or high-frequency additive level trending, the oil may appear physically normal while its protective chemistry has degraded below the level required to prevent wear under steel mill load conditions.
We were sending oil samples to the lab on a quarterly schedule for all major gearboxes and hydraulic systems. The lab reports came back with ISO codes, water content, and viscosity data — but by the time we reviewed them, the data was already 10 to 14 days old. We had no way to correlate the lab results with what the equipment was doing when the sample was taken. iFactory connected our existing oil sensors — particle counters, water-in-oil probes, and viscosity sensors — into a continuous monitoring dashboard that shows us contamination trends in real time. In the first month, the system flagged a gearbox where water content had risen from 80 ppm to 620 ppm over 11 days following a cooler tube failure. The quarterly sampling schedule would have caught that water level at the next scheduled sample three weeks later — by which point the gearbox bearings would have been operating at saturation level for 20 days. We drained and filtered the oil, replaced the cooler, and avoided a $140,000 gearbox rebuild that was three weeks from being necessary.
Oil Analysis Methods — Particle Count, Water Content, and Viscosity Monitoring
Effective lubrication program analytics requires monitoring three primary oil condition parameters — particle contamination, water content, and viscosity — at a frequency that matches the degradation rate of the equipment. For slow-speed, large-sump gearboxes where contamination develops over weeks, weekly or biweekly sampling may be sufficient. For high-speed rolling mill bearings and hydraulic systems where contamination events can occur within hours of a seal failure or breather bypass, continuous online monitoring is the only approach that captures the event before damage progresses. iFactory's Oil and Lube AI platform ingests data from both online sensors and offline laboratory analysis, correlating the results with equipment operating conditions to distinguish between normal contamination accumulation and developing failure events. Reliability teams who schedule an oil analysis audit often discover that their current sampling frequency is misaligned with the actual degradation rate of their highest-criticality assets.
| Oil Condition Parameter | Monitoring Method | Target Range (Steel Mill) | AI Prediction Capability | Typical Warning Lead Time |
|---|---|---|---|---|
| Particle Count (ISO 4406) | Online laser particle counter or offline lab analysis | Gearboxes: 18/16/13; Hydraulics: 16/14/11; Circulation: 17/15/12 | Contamination event prediction based on trend acceleration rate, seal condition data, and breather status | 3-14 days before alarm threshold exceeded |
| Water Content | Capacitive or IR absorption water-in-oil sensor | Gearboxes: less than 200 ppm; Hydraulics: less than 100 ppm; Turbines: less than 50 ppm | Water ingress detection through rising trend analysis correlated with ambient humidity, cooler condition, and seal health data | Immediate detection upon sensor deployment — hours vs. weeks for lab sampling |
| Kinematic Viscosity @ 40 C | Online vibrating element or lab viscometer | ISO VG 100: 90-110 cSt; ISO VG 150: 135-165 cSt; ISO VG 220: 198-242 cSt | Viscosity loss prediction based on thermal stress history, oxidation rate model, and additive depletion trending | 2-6 weeks before viscosity deviation exceeds acceptable band |
| Additive Level (AW/EP) | XRF spectroscopy or FTIR analysis | Phosphorus: 300-800 ppm; Zinc: 400-900 ppm; Sulfur: 500-2000 ppm | Additive depletion rate forecasting based on operating hours, temperature profile, and water contamination history | 4-12 weeks before additive level drops below minimum effective concentration |
| Ferrous Wear Debris | Online ferrous particle sensor or PQ index | Gearboxes: less than 100 ppm Fe trend; Hydraulics: less than 50 ppm Fe trend | Wear acceleration detection through ferrous particle trend rate correlation with load cycles and operating temperature | 2-8 weeks before wear rate requires component inspection or replacement |
Lubrication Program Optimization with iFactory Oil and Lube AI
Moving from a fixed-interval lubrication program to a condition-based, AI-optimized program requires a structured deployment that builds on existing oil analysis infrastructure while adding continuous monitoring capability where it delivers the highest return. iFactory's implementation approach follows a phased roadmap that prioritizes the assets with the highest failure consequence first, then expands condition-based lubrication to the full asset fleet based on demonstrated ROI. For plants ready to begin this transition, booking a program assessment provides a detailed roadmap specific to your current lubrication program maturity and asset criticality profile.
Assessment and Sensor Deployment
Review current oil analysis program: sampling frequency, lab test slate, ISO targets, change intervals, and asset criticality. Deploy online particle counters, water-in-oil sensors, and viscosity monitors on top-20 percent critical assets — gearboxes, hydraulic systems, and circulating oil systems with highest failure consequence. Timeline: 4-6 weeks.
AI Model Training and Baseline Establishment
iFactory trains oil condition prediction models on each asset class using 60 to 90 days of continuous sensor data combined with historical lab analysis records. Baseline degradation rates are established per asset, enabling the AI to distinguish between normal contamination accumulation and developing failure events. Timeline: 8-12 weeks.
Program-Wide Optimization and CMMS Integration
Expand condition-based lubrication intervals to full asset fleet based on demonstrated savings from Phase 2. Automated oil change recommendations, filter replacement triggers, and lubrication route updates are integrated into the plant CMMS through bidirectional API connectors. Timeline: Ongoing continuous improvement.
Steel Plant Oil Analysis and Lubrication — Frequently Asked Questions
What oil analysis sensors does iFactory support for continuous online monitoring?
iFactory integrates with all major online oil condition sensor brands including Pall, Parker, HYDAC, Eaton, and ifm — supporting laser particle counters for ISO 4406 cleanliness, capacitive and IR water-in-oil sensors, vibrating element viscometers, and ferrous particle detectors. Sensor data is ingested via Modbus TCP, OPC-UA, or 4-20 mA analog interfaces into the iFactory platform for continuous AI analysis and trending.
How does iFactory determine the optimal oil change interval for each asset?
iFactory calculates asset-specific oil change intervals by analyzing three degradation curves simultaneously: particle contamination accumulation rate, viscosity loss rate from thermal and oxidative stress, and additive depletion rate relative to the asset's operating temperature profile and load cycles. The AI recommends oil change when any parameter approaches the threshold, rather than on a fixed calendar or run-hour schedule.
Can iFactory integrate with an existing off-site laboratory oil analysis program?
Yes. iFactory ingests laboratory analysis data from all major oil analysis labs including Bureau Veritas, Intertek, ALS, and Polaris through standard data exchange formats. Lab results are combined with continuous sensor data to create a unified oil condition record per asset, with the AI model correlating lab findings with sensor trends to improve prediction accuracy across both data sources.
What is the typical ROI timeline for an iFactory Oil and Lube AI deployment?
iFactory Oil and Lube AI deployments in steel mills typically achieve full cost recovery within 6 to 10 months. The fastest payback cases occur when the initial sensor deployment identifies a high-consequence contamination event or water ingress condition in the first 30 days that, once resolved, prevents a gearbox or hydraulic system failure that would have exceeded the platform's annual cost.
Does iFactory support grease lubrication monitoring in addition to oil systems?
Yes. iFactory's lubrication analytics module includes grease management capability — tracking grease type, application frequency, quantity per point, and equipment-specific grease compatibility requirements. The platform generates optimized lubrication routes for grease applications, flags overdue points, and correlates grease-related bearing temperature trends with lubrication events to identify under-lubrication or over-lubrication conditions.
Stop Changing Oil on a Schedule. Start Changing It When the Oil Tells You.
iFactory's Oil and Lube AI platform transforms your lubrication program from a fixed-interval cost center into a continuous condition-based reliability driver — with real-time particle count, water content, and viscosity monitoring across all critical assets in your steel mill.