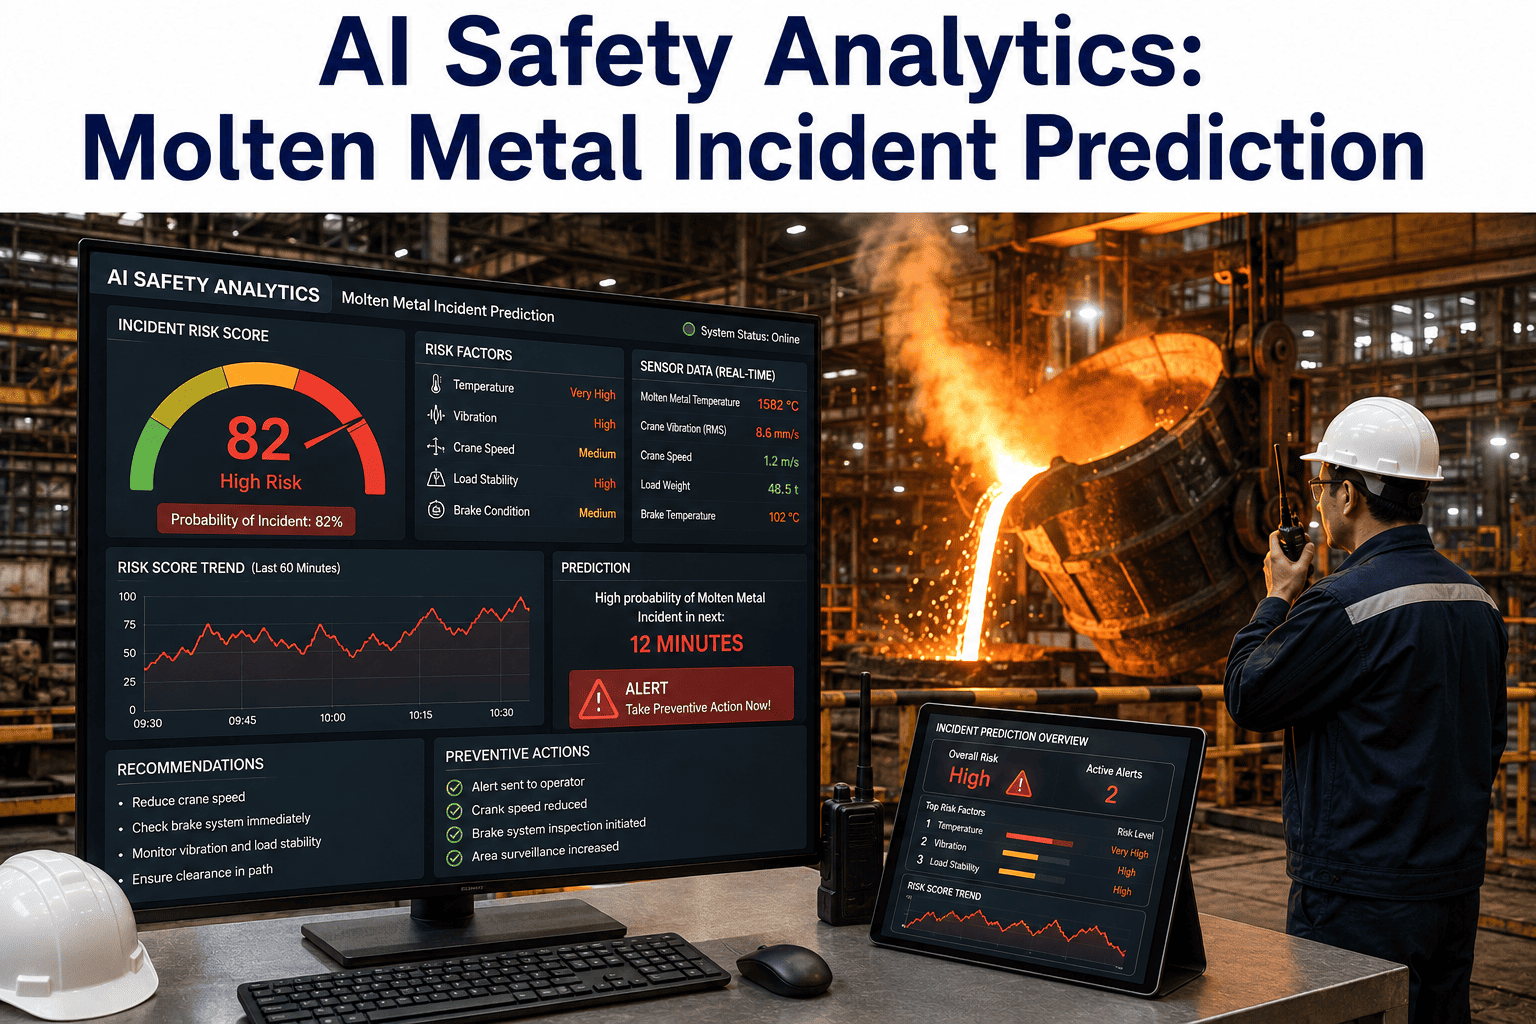
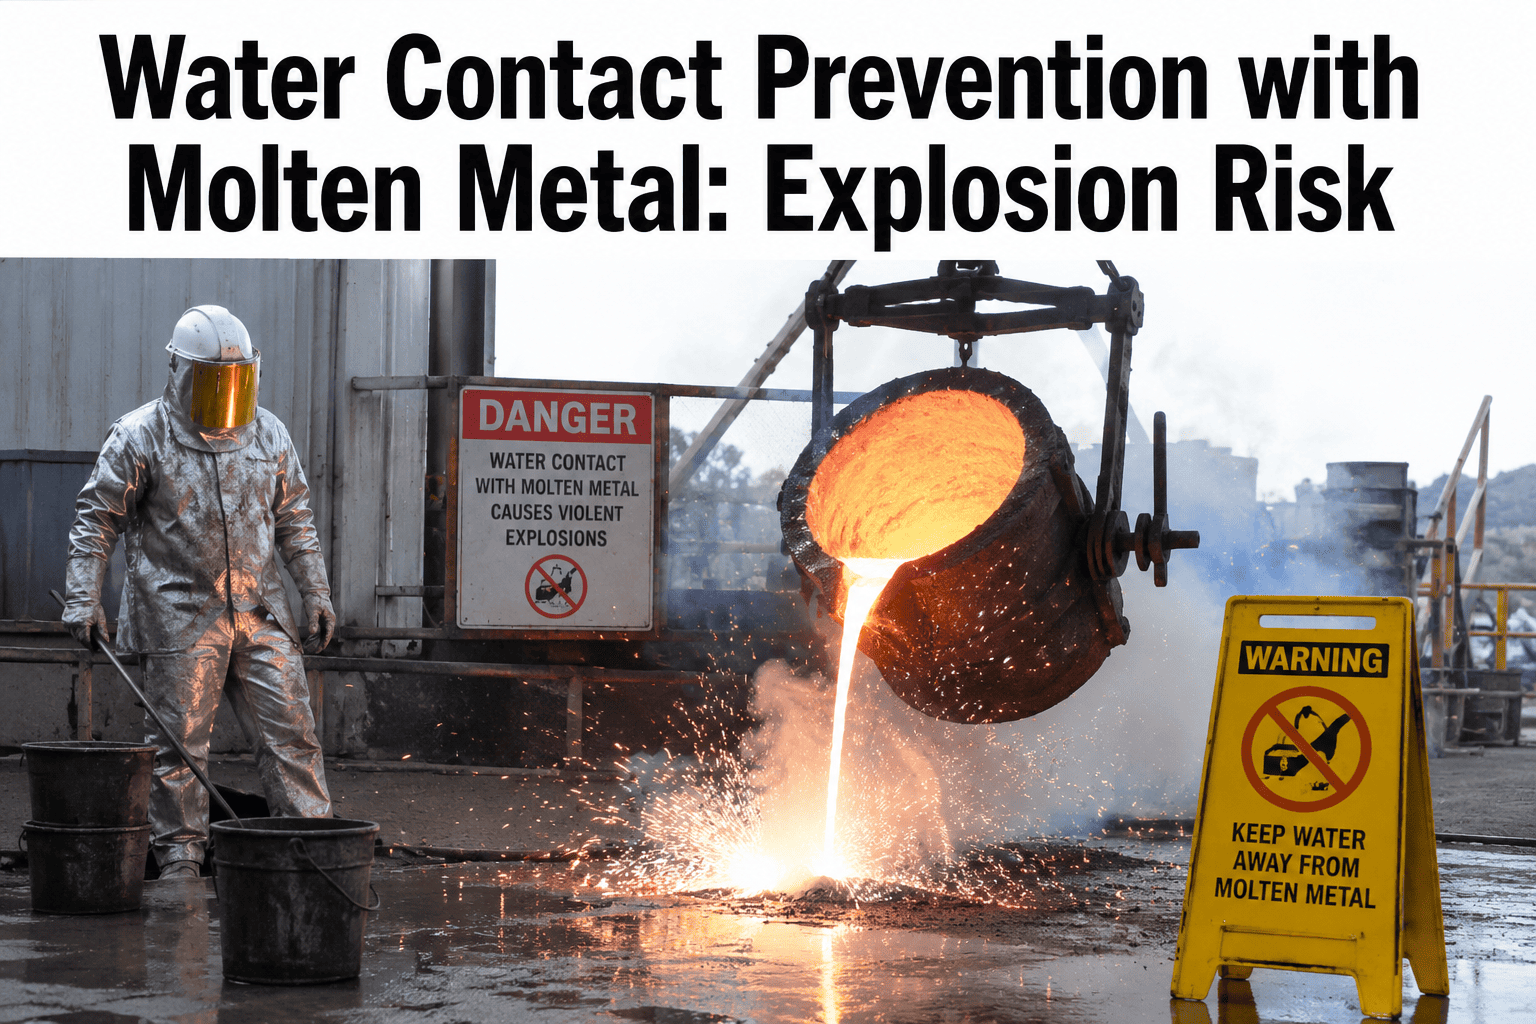
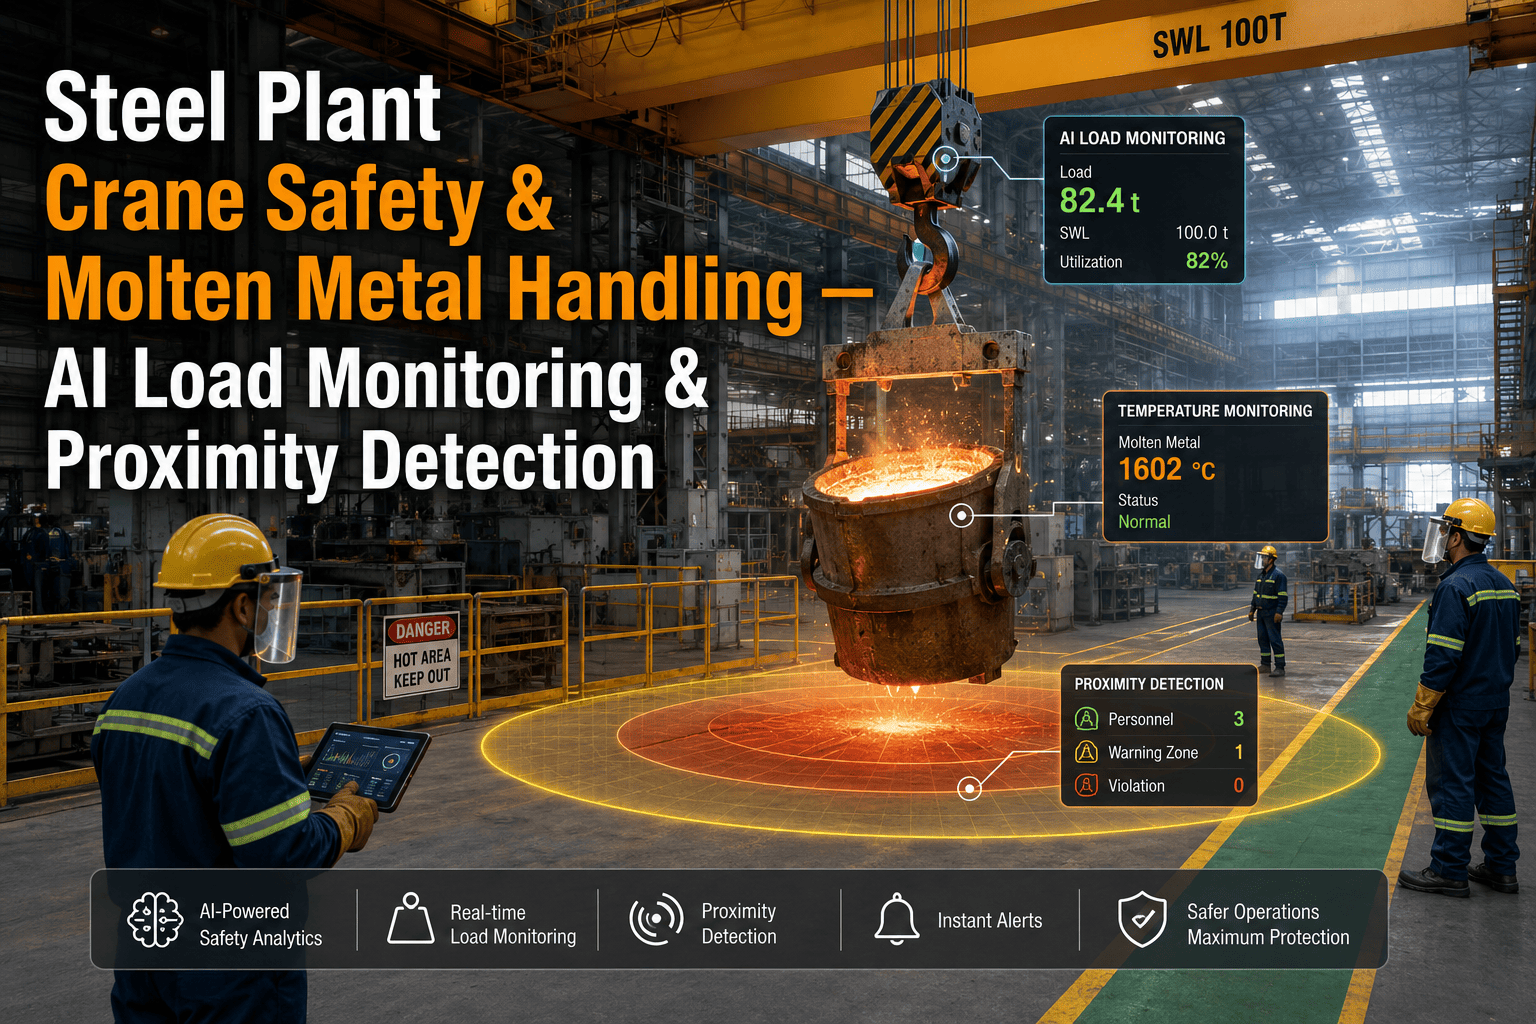
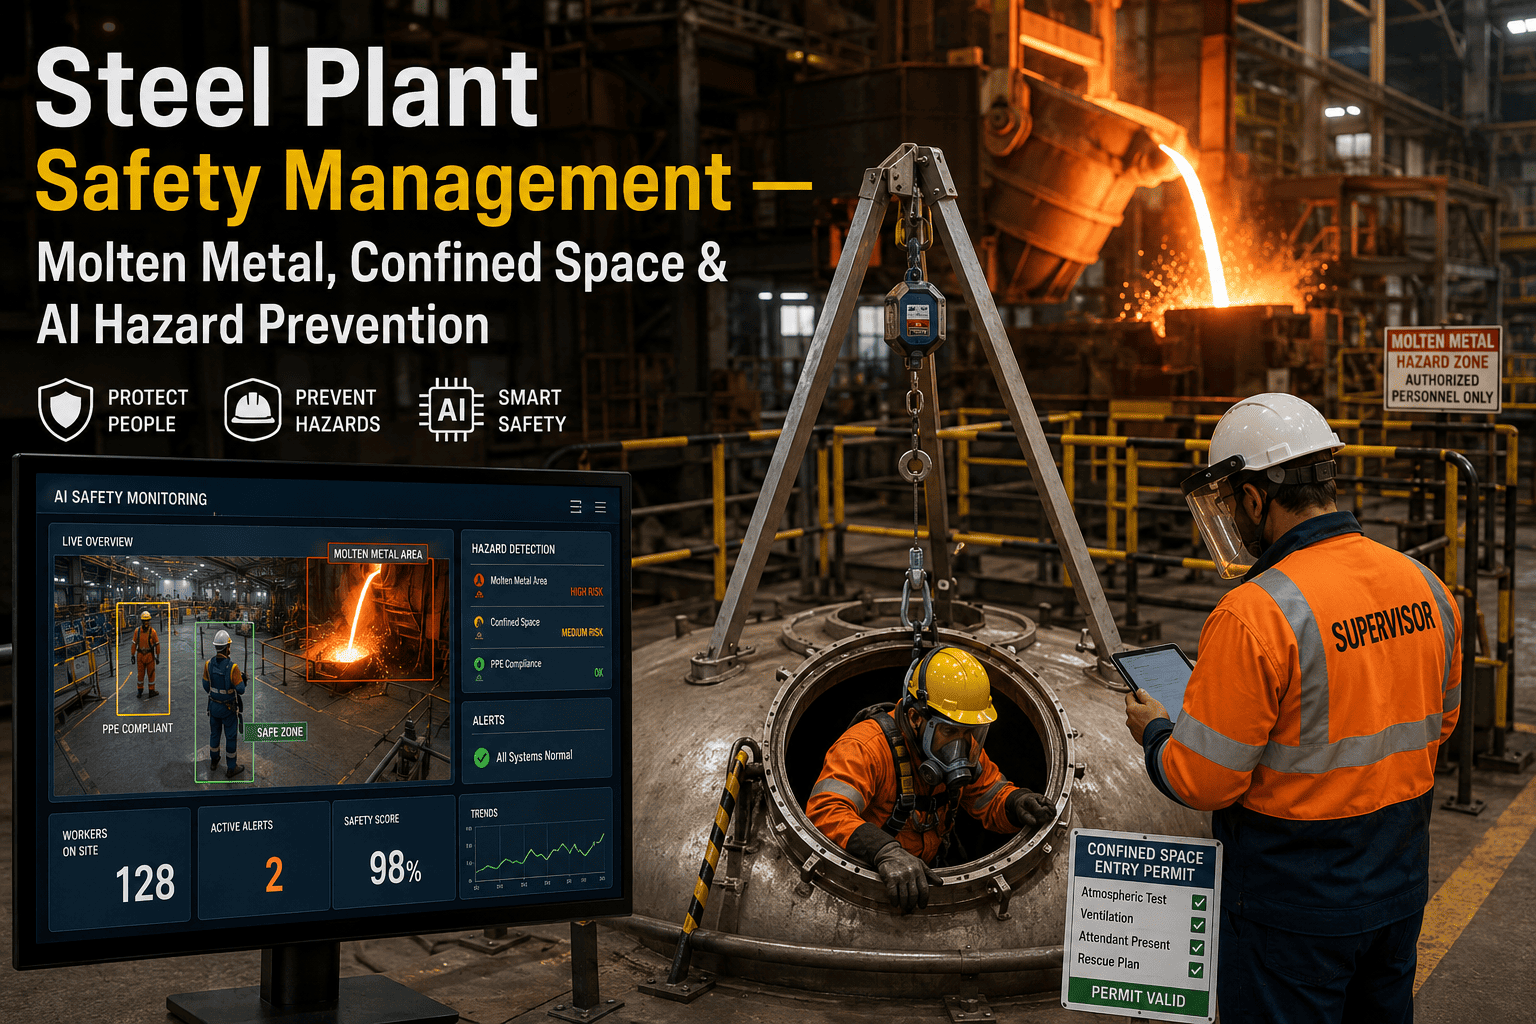
Molten metal operations carry some of the highest injury severity rates in heavy manufacturing — not because incidents are frequent, but because when they occur, the consequences are catastrophic. Traditional safety programs in steel plants and foundries rely on procedural compliance, PPE enforcement, and post-incident investigation, all of which address symptoms rather than predicting the conditions that make an incident likely before it happens. AI safety analytics changes this equation by continuously correlating equipment condition data, operational patterns, and environmental readings to generate a live risk score that identifies the specific combination of conditions preceding historical incidents, giving safety teams a prediction window they have never had before. Explore how iFactory's AI safety analytics platform builds incident prediction models for molten metal environments from your plant's own operational data.
AI Safety Intelligence
AI Safety Analytics for Molten Metal Incident Prediction
Moving from reactive investigation to predictive risk scoring — how AI correlates equipment condition, operational patterns, and environmental data to forecast molten metal safety incidents before they occur.
1,800+
Molten metal incidents reported annually in US metalcasting alone
72%
Of severe incidents traceable to equipment condition degradation over time
4-6 hr
Average prediction window AI models provide before incident conditions peak
3.2x
Reduction in recordable incidents after AI safety analytics deployment
The Prediction Gap
Why Traditional Molten Metal Safety Stops at Prevention, Not Prediction
Every steel plant and foundry has a safety program. The issue is not the absence of safety systems — it is the fundamental limitation of what those systems can actually detect. Safety checklists verify that PPE is worn and procedures are followed at a point in time. Thermal cameras alert when a skin temperature exceeds a threshold. Interlock systems prevent a crane from moving when a door is open. Each of these is valuable, but each operates in isolation against a single variable, and none of them model the interaction between multiple degrading conditions that collectively produce an incident. A molten metal splash incident, for example, is rarely caused by a single failure — it is typically the convergence of lining wear approaching its limit, a pour rate slightly above normal, and a moisture condition that would be harmless on its own but becomes catastrophic when combined with the other two. Traditional safety systems see each condition individually and none triggers an alert because each is within its individual threshold. AI safety analytics sees the combination and flags the convergence as a risk that no single-sensor system can detect.
Traditional Safety Stack
PPE compliance checks — point-in-time verification
Single-sensor thermal alerts — threshold-based, no context
Interlock systems — binary, no degradation modeling
Post-incident investigation — learning after the event
Safety audits — periodic sampling, not continuous
Reactive: responds to conditions already past the safe zone
VS
AI Safety Analytics Stack
Multi-variable correlation — sees condition combinations
Continuous risk scoring — live, not point-in-time
Degradation trajectory modeling — predicts when limits will be reached
Pre-incident intervention — acts on prediction, not evidence of failure
Pattern learning — improves from every shift of operational data
Predictive: intervenes before conditions converge into an incident
How It Works
The Incident Prediction Pipeline From Sensor to Risk Score
AI safety analytics for molten metal environments follows a structured pipeline that transforms raw plant data into an actionable risk score. The pipeline has five stages, and each stage adds a layer of interpretation that moves the output further from raw data and closer to a decision a safety manager can act on. Understanding this pipeline is important because the prediction quality depends on data quality at every stage — a model built on incomplete equipment condition data will produce risk scores that look confident but miss the specific conditions that actually matter in your plant.
01
Data Ingestion From Existing Plant Systems
Temperature sensors, vibration monitors, furnace lining thickness measurements, ladle tracking systems, pour timing logs, humidity and moisture readings, and PLC operational data are ingested continuously. The critical requirement is that these data sources already exist in most plants — the analytics platform connects to them rather than requiring new sensor installation for the initial model.
02
Historical Incident Correlation Analysis
The system analyzes historical incident reports, near-miss logs, and maintenance records to identify the specific combinations of equipment conditions, operational parameters, and environmental readings that were present in the hours preceding past incidents. This is where the model learns what "dangerous" looks like in your specific plant rather than applying a generic risk model.
03
Multi-Variable Risk Model Training
Using the correlated patterns from historical analysis, a multi-variable risk model is trained that weights each input factor according to its actual contribution to incident probability in your environment. Furnace lining wear might carry a different weight in your plant than in another facility depending on your specific operating temperatures, alloy types, and cycle frequencies.
04
Continuous Real-Time Risk Scoring
The trained model runs continuously against live data streams, producing a risk score that updates as conditions change. A score might be low at the start of a shift and gradually climb as lining temperature readings trend upward and pour rates increase — the trend direction matters as much as the absolute score at any given moment.
05
Predictive Alert With Contributing Factor Breakdown
When the risk score crosses a defined threshold, the system generates an alert that includes not just the risk level but a breakdown of which specific factors are driving the score and what interventions would reduce it. A safety manager receives not just "risk is elevated" but "risk is elevated because lining wear is at 78% of limit AND pour rate has exceeded baseline for 90 minutes AND ambient moisture has increased in the last 2 hours."
Equipment Condition Correlation
Which Equipment Conditions Actually Predict Molten Metal Incidents
Not every equipment reading carries equal predictive weight. Across molten metal safety deployments, a consistent set of equipment condition factors emerges as the strongest incident predictors — not because they are the only factors that matter, but because they represent the degradation pathways that most commonly converge into a dangerous condition. The table below maps the primary equipment conditions against the incident types they predict and the data source typically available in a metalcasting or steel plant environment.
| Equipment Condition |
Incident Type Predicted |
Primary Data Source |
Key Signal Pattern |
| Furnace lining wear progression |
Breakout, molten metal release |
Lining thickness surveys, thermal imaging |
Wear rate accelerating beyond historical baseline for same operating cycle |
| Ladle refractory condition |
Laundry spill, splash during transfer |
Ladle cycle tracking, thermal profiles |
Temperature profile deviation from expected cooling curve after preheat |
| Crane and ladle mechanism wear |
Dropped ladle, uncontrolled pour |
Vibration sensors, maintenance logs |
Vibration amplitude trending upward over consecutive cycles |
| Mold and runner system condition |
Runout, uncontrolled metal flow |
Visual inspection logs, thermal mapping |
Hotspot development in areas without historical pattern |
| Cooling system performance |
Thermal stress fracture, water-molten metal contact |
Flow rate sensors, temperature differential |
Reduced flow rate or narrowing temperature differential over time |
| Moisture content in charge materials |
Steam explosion during charging |
Moisture sensors, material storage duration |
Moisture reading above threshold combined with charge timing |
The insight that makes this table actionable rather than just informational is the "Key Signal Pattern" column. A raw lining thickness reading tells you where the lining is today. A trend showing that the wear rate is accelerating — meaning the lining is degrading faster than the historical average for the same point in its service cycle — tells you that something about current operating conditions is causing accelerated degradation, and that the remaining lining life may be shorter than a simple thickness measurement suggests. AI safety analytics captures this distinction by modeling not just the current state but the rate of change, because the rate of change is often the earliest detectable signal that conditions are converging toward an incident. A lining that is thin but stable is a maintenance scheduling issue. A lining that is thin and degrading faster than expected is a potential incident that needs immediate intervention, and that difference is invisible to a threshold-based alert but obvious to a trend-based AI model.
Risk Scoring Methodology
How the Live Risk Score Is Calculated and What It Actually Means
The risk score is the central output of an AI safety analytics system — the single number that a safety manager or shift supervisor looks at to understand the current incident probability for a specific work area or operation. But a risk score without transparency about how it is calculated becomes a black box that operators either ignore or overreact to, and neither outcome improves safety. The methodology below describes how a well-designed scoring system works in practice, and why each component matters for the score to be trustworthy enough that people actually respond to it.
0-30
Low Risk
Normal operations. All equipment conditions within expected parameters. Standard monitoring continues. No intervention required.
31-60
Elevated Risk
One or more conditions trending toward limits. Increased monitoring frequency recommended. Review contributing factors for potential early intervention.
61-85
High Risk
Multiple conditions converging. Specific intervention actions identified. Safety team notification triggered. Operational adjustments should be evaluated.
86-100
Critical Risk
Incident conditions present or imminent. Immediate intervention required. Consider halting the specific operation until conditions are addressed.
The score is not a simple average of individual factor readings. Each contributing factor is weighted based on its correlation strength with historical incidents in that specific plant, and the weighting is not static — it adjusts as the model ingests more operational data and refines its understanding of which combinations actually preceded incidents. A moisture spike in a plant where moisture has never been a primary incident contributor might add 5 points to the score. The same moisture spike in a plant where moisture was a contributing factor in three of the last five incidents might add 20 points. This plant-specific weighting is what separates a useful AI risk score from a generic safety dashboard that looks sophisticated but produces alerts that experienced operators already knew about from reading the individual sensor values directly. The value of the AI is not in detecting what a single sensor can detect — it is in detecting the interaction between sensors that no single sensor and no human monitoring a single screen can see simultaneously.
Furnace lining wear trajectory
Weight: 82%
Pour rate deviation from baseline
Weight: 67%
Ambient moisture trend
Weight: 54%
Ladle thermal profile deviation
Weight: 73%
Crane mechanism vibration trend
Weight: 41%
Cooling system performance delta
Weight: 38%
The weight visualization above represents a sample plant's factor weights — your plant's weights will differ based on your specific incident history, equipment types, and operating conditions. The point is not that any particular factor should carry a specific weight, but that the weighting exists and is derived from your data rather than assigned by a consultant's judgment. A safety engineer who has worked in a plant for twenty years has strong intuition about which factors matter most, and that intuition is often largely correct. But intuition cannot simultaneously monitor six interacting variables across three shifts and update its assessment every fifteen minutes — that is what the model does, using the historical patterns that validate (or occasionally correct) the engineer's intuition as its foundation.
Operational Pattern Analysis
The Operational Patterns That Signal Rising Incident Probability
Equipment condition tells you what is degrading. Operational pattern analysis tells you what you are doing that might be accelerating the degradation or creating the specific conditions where a degraded component becomes dangerous. The two data streams are complementary — equipment condition without operational context can identify a worn lining but cannot explain why it is wearing faster than expected, while operational data without equipment condition can identify unusual operating patterns but cannot connect them to the physical risk those patterns create. Together, they form the complete picture that a prediction model needs.
P1
Extended High-Temperature Holding Cycles
When molten metal is held at pouring temperature significantly longer than the standard cycle time — often due to downstream delays, quality holds, or scheduling gaps — the sustained thermal load on furnace and ladle linings accelerates wear beyond the rate the standard maintenance schedule accounts for. The AI model detects when a holding cycle exceeds the duration threshold where lining degradation rate measurably increases, even if the temperature itself is within normal operating range, and factors that extended hold into the risk score as an accelerating condition rather than a static one.
P2
Rapid Sequential Pour Sequences
Back-to-back pours with reduced inter-pour cooling time create thermal cycling stress that accumulates faster than the ladle refractory can dissipate. The pattern is not any single pour — it is the sequence frequency. A plant that normally allows 45 minutes between pours but compresses to 20 minutes to meet a production target creates a thermal stress pattern that, over a full shift, can push ladle lining temperature profiles into ranges where micro-cracking accelerates. The AI model tracks inter-pour intervals as a pattern variable and flags when the cumulative thermal stress from compressed sequencing crosses a predictive threshold.
P3
Shift-Transition Operational Drift
Incident data consistently shows elevated risk during shift transitions, not because of any single handoff failure, but because operational parameters — pour rate, temperature setpoints, charging sequence — tend to drift during transitions as incoming crews adjust to the current state. The AI model detects when operational parameters diverge from the established baseline in the hours surrounding a shift change, and weights that divergence differently than the same parameter deviation would be weighted at mid-shift when operations are typically more stable.
P4
Production Rate Push Above Validated Envelope
When production throughput exceeds the rate at which the safety validation was originally conducted — a common occurrence during demand surges or end-of-quarter pushes — the operating envelope effectively changes without a corresponding safety re-assessment. Faster cycle times mean less cooling margin, quicker ladle turns mean less inspection opportunity, and higher throughput means more simultaneous operations creating more concurrent risk vectors. The AI model flags when the current production rate exceeds the rate band in which the historical incident baseline was established, adding an uncertainty premium to the risk score that reflects the reduced predictive confidence at unvalidated operating rates.
From Reactive to Predictive
Your Plant's Incident History Contains the Prediction Model — It Just Needs AI to Extract It
iFactory's safety analytics platform ingests your existing sensor data, maintenance records, and incident logs to build a risk scoring model specific to your equipment, your operating patterns, and your incident history — not a generic template from another industry.
Reconstructed Scenario
A Molten Metal Splash Incident Reconstructed Through the AI Lens
The following scenario is reconstructed from patterns observed across multiple incident analyses in steel and foundry environments. The specific details are composited to protect plant identities, but the sequence of conditions and the way each one contributed to the final incident is representative of the most common pattern AI safety analytics is designed to detect — the slow convergence of individually tolerable conditions into a collectively dangerous one.
Shift Start — 06:00
Risk Score: 18 — Low
Furnace lining at 72% of remaining life, within normal parameters for its position in the service cycle. Ladle preheat completed successfully with thermal profile matching expected curve. Ambient conditions dry and within range. All equipment conditions individually within thresholds. No alert generated — correctly, because no dangerous convergence exists at this point.
Mid-Shift — 09:30
Risk Score: 47 — Elevated
Downstream delay extends holding time by 40 minutes beyond standard cycle. AI model detects extended hold and begins factoring accelerated lining degradation into the risk trajectory. Pour rate increases as the shift attempts to recover lost throughput. The model now sees two conditions trending simultaneously — extended thermal load and elevated pour rate — and the score climbs. An elevated-risk notification is generated with the specific contributing factors listed, but no mandatory intervention is triggered at this level.
Late Shift — 12:15
Risk Score: 74 — High
Ambient humidity has increased as weather conditions changed through the morning — a factor that would be irrelevant on its own but now adds to the convergence. The ladle being used for this pour sequence has completed three more turns than the standard rotation allows because the spare ladle is in maintenance, so its refractory has accumulated more thermal cycling than the model expects at this point in its rotation. The AI model now identifies three converging factors — extended hold degradation, elevated pour rate, and reduced ladle margin — and upgrades the alert to high risk with a recommendation to evaluate pausing the specific pour sequence for ladle inspection.
Incident — 13:40
Risk Score: 91 — Critical
During a pour at the elevated rate, a section of ladle refractory that had been weakened by the accelerated thermal cycling fails, creating a localized breach. Molten metal contacts the ladle shell, generating steam and pressure that forces metal outward in a splash pattern. In the reconstructed AI analysis, the model's critical-risk alert at 13:20 — twenty minutes before the incident — identified the specific convergence and recommended halting the pour sequence. Had that alert been acted on, the ladle would have been removed from rotation for inspection, and the breach would have been detected before metal was poured through the weakened section. This is the prediction window that AI safety analytics creates: not a guarantee that every incident will be prevented, but a structured, data-driven opportunity to intervene that did not exist before.
Common Questions
Frequently Asked Questions
Does AI safety analytics require installing new sensors in our plant?
In most cases, the initial model can be built entirely from data sources that already exist in the plant — temperature sensors, PLC data, maintenance management systems, and inspection records that are already being collected for operational or compliance purposes. The analytics platform connects to these existing systems rather than requiring a greenfield sensor deployment. In some cases, after the initial model identifies specific gaps in data coverage for high-weight factors, targeted sensor additions may be recommended to improve prediction accuracy, but these are informed by the model's identified needs rather than deployed speculatively upfront.
Book a demo to discuss what data sources your plant already has available for model building.
How long does it take to build a plant-specific incident prediction model?
The initial model build typically requires four to eight weeks of historical data analysis combined with current data stream integration, depending on the quality and completeness of available historical incident records and equipment condition data. A plant with well-maintained digital maintenance records and at least twelve to eighteen months of operational sensor history will produce a more robust initial model faster than a plant where historical data exists primarily in paper records that need to be digitized and structured before the correlation analysis can begin. The model then continues to improve with every shift of live operational data it ingests after deployment, so prediction accuracy typically increases meaningfully in the first ninety days of live operation as the model encounters real-world condition combinations that may not have been represented in the historical training set.
What happens when the AI generates a high-risk alert that conflicts with production pressure?
This is the most important implementation design decision, and it needs to be made before the system goes live rather than in the moment of first conflict. A well-designed AI safety analytics deployment includes pre-defined escalation protocols that map risk score thresholds to specific response actions, including the authority level required to override a high-risk or critical-risk alert. The system does not shut down operations autonomously — it provides a structured, data-backed recommendation with full transparency about which factors are driving the risk score, and the decision to act or override rests with designated personnel who have the authority and context to make that judgment. The value of the system in these moments is that the safety argument is no longer an opinion about whether conditions "feel" risky — it is a specific, traceable risk score with a documented factor breakdown that can be reviewed and evaluated against production needs.
Talk to our safety engineering team about designing escalation protocols that fit your plant's operational culture.
How does the model handle rare incident types where there is limited historical data?
For incident types with very few historical occurrences — which is fortunately the case for severe incidents in most plants — the model uses a combination of the available incident data, near-miss reports, and industry-wide pattern databases to establish the initial correlation factors. Near-miss events are particularly valuable in these cases because they represent the same converging conditions that produced an incident in a different plant but were caught or did not fully develop in yours. The model treats near-misses as weighted training data — not as severe as actual incidents, but carrying the same pattern signature. As the model operates live, it also actively looks for condition combinations that resemble the rare-incident pattern even if the score has not reached the critical threshold, generating informational alerts that help build the data set for that incident type over time.
Can the risk scoring model be validated before we rely on it for operational decisions?
Yes, and validation is a standard phase of the deployment process. The model is first run in retrospective mode against historical data — feeding it the sensor and operational data from a period that includes known incidents and verifying that the model's risk score trajectory correctly identified the rising risk leading up to those incidents. This retrospective validation establishes a baseline prediction accuracy rate before the model is ever connected to live data. After retrospective validation passes defined accuracy thresholds, the model enters a shadow mode phase where it runs against live data and generates risk scores that are logged but not displayed to operators, allowing the implementation team to compare the model's live risk assessments against actual operational outcomes without affecting decision-making. Only after both phases demonstrate acceptable performance does the model go into active mode where its alerts are visible to operators and integrated into the escalation protocol.
Start Predicting, Not Just Investigating
Your Incident History Already Contains the Prediction Model
iFactory's AI safety analytics platform transforms your existing plant data into a live risk scoring system that identifies the specific condition combinations preceding molten metal incidents — giving your safety team a prediction window that traditional safety systems cannot provide. The model learns from your equipment, your operations, and your incident history, not a generic industry template.