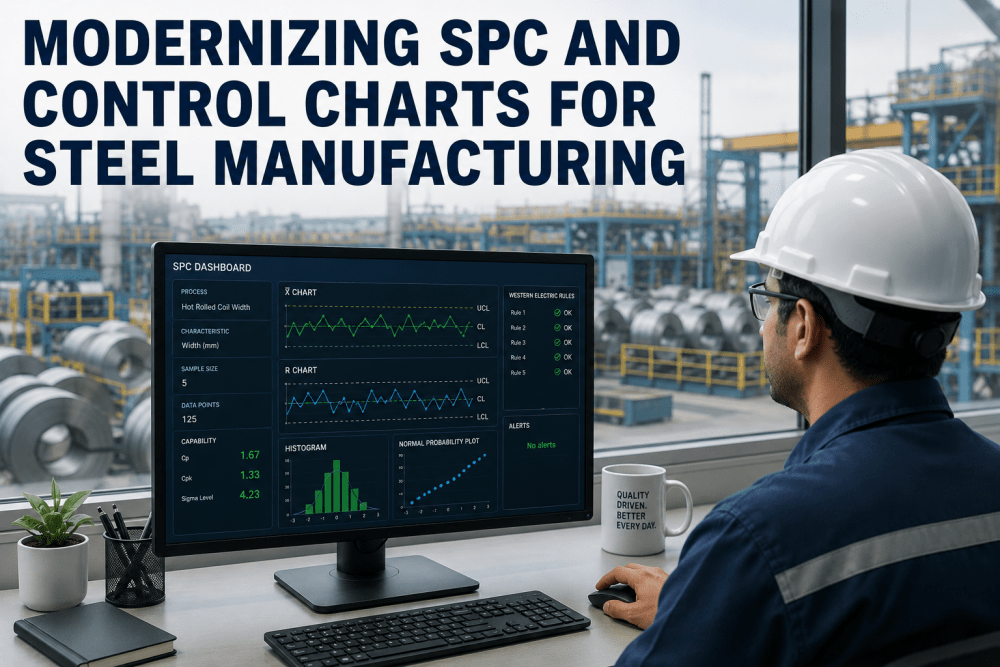
Statistical process control has been the foundation of quality assurance in steel manufacturing since Shewhart first published his control chart theory in 1931, and the tools have evolved remarkably little in the nine decades since — X-bar and R charts, p-charts for attribute data, Cp and Cpk capability indices calculated from periodic sample measurements, and Western Electric rules applied manually by QA engineers reviewing charts at the end of each shift. In a steel plant producing 3 million tons per year across 12 grades with multiple process parameters per stage, the volume of data generated per shift far exceeds what manual SPC methods can process: 200+ process variables per coil, 300+ coils per day, and control limits that must be recalculated as product mix shifts, raw material sources change, and process equipment ages. The result is that SPC in most steel plants operates as a retrospective reporting function — charts are reviewed after the fact, out-of-control signals are identified when the product is already off-spec, and capability studies are conducted quarterly using samples that may not represent current process conditions. iFactory's SPC AI Engine changes this by automating control chart generation, real-time out-of-control detection with AI-augmented Western Electric rules, and continuous process capability analysis that updates with every coil — transforming SPC from a retrospective reporting tool into a real-time process control system. QA engineers evaluating SPC modernization for their facility can book a demo to review how the platform maps to their specific process parameters and quality standards.
The SPC Modernization Challenge in Steel Manufacturing
The volume and velocity of process data in modern steel plants have outstripped the capacity of traditional SPC methods. A single hot strip mill generates finishing temperature, coiling temperature, cooling header flow, roll force, torque, and speed data at sub-second intervals across every coil — producing 50,000 to 200,000 individual data points per coil that contain information about process stability and capability that manual SPC simply cannot extract. The cost of this gap is measured in off-grade coils that could have been prevented with real-time detection, quarterly capability studies that miss process shifts between sampling intervals, and out-of-control signals that are identified hours after the assignable cause has passed. Comparison of the two approaches is provided below.
- Control charts generated manually or via spreadsheet — updated at end of shift, reviewed the following day, with out-of-control signals identified 4–24 hours after the assignable cause occurred
- Western Electric rules applied visually to plotted points — shift patterns, trends, and runs detected by the QA engineer reading the chart after production has moved to the next grade or product
- Cp and Cpk calculated quarterly using 25–50 sample measurements — capability metrics that are 90 days old by the time they reach production review meetings
- Control limits calculated annually or per grade campaign — limits that do not reflect current process variation from raw material changes, roll wear, or seasonal ambient temperature shifts
- Sample-based data covering 1–5 percent of production — statistically significant patterns in the 95–99 percent of unmeasured data are invisible until they produce off-spec product
- Control charts generated in real time — every coil updates X-bar, R, S, and individual moving range charts automatically with Shewhart control limits calculated from the current process window
- Western Electric Rules applied by AI inference engine — all eight Western Electric zone tests evaluated on every new data point with sub-second latency, flagging rule violations immediately for operator action
- Cp, Cpk, Cpm, and Pp/Ppk calculated continuously — capability metrics updated with every coil and displayed in real time on the SPC dashboard, replacing quarterly snapshots with live process visibility
- Control limits recalculated dynamically — limits adapt to process state using a hybrid approach that combines fixed specification-based limits with statistically computed limits from the most recent production window
- 100 percent of process data analyzed — every coil, every measurement, every process variable is incorporated into control charts and capability calculations
AI-Augmented Control Charts: Western Electric Rules at Machine Speed
The eight Western Electric zone tests — the standard set of out-of-control detection rules used in SPC — were designed for manual application to control charts where a QA engineer reviews plotted points and identifies patterns visually. At steel plant data volumes, manual application of all eight rules across multiple process parameters is impractical, and most plants apply only a subset (typically one point beyond Zone A, or seven points on one side of the centerline) to reduce the review burden. iFactory's SPC AI Engine evaluates all eight Western Electric rules on every new data point across every monitored process parameter with sub-second latency, and augments the standard rules with AI-detected patterns that traditional Western Electric rules cannot capture.
Process Capability Analysis: Cp, Cpk, Cpm, and Pp/Ppk in Real Time
Process capability indices — Cp (process capability), Cpk (capability index adjusted for centering), Cpm (Taguchi capability index), and Pp/Ppk (process performance indices) — are the standard metrics for quantifying whether a steel process can consistently produce product within specification limits. Traditional practice calculates these indices quarterly from 25 to 50 sample measurements, producing snapshot values that may not represent current process state. iFactory's SPC AI Engine calculates all capability indices continuously using 100 percent of production data, updating with every coil and displaying trends over user-selectable time windows. The table below compares the traditional quarterly capability study approach with AI-driven continuous capability analysis.
| Capability Metric | What It Measures | Traditional Calculation | AI Continuous Calculation | Value to QA Engineer |
|---|---|---|---|---|
| Cp | Process capability ratio — specification width divided by process spread (6 sigma) | Calculated quarterly from 25–50 samples; uses estimated process sigma from sample range or standard deviation | Calculated per coil and per production window (shift, day, grade campaign) using 100% of process data; multiple sigma estimation methods available | Continuous Cp visibility enables QA engineers to detect capability degradation within shifts rather than quarters — a Cp dropping from 1.67 to 1.33 becomes visible immediately |
| Cpk | Centered capability index — minimum of (USL - mean)/3 sigma and (mean - LSL)/3 sigma | Calculated quarterly; assumes process is centered at midpoint of specification; does not track centering shifts between sampling intervals | Calculated continuously with real-time centering adjustment; separate upper and lower Cpk displayed to identify which specification limit drives capability | Real-time Cpk reveals when a process is drifting toward a specification limit — enabling centering adjustment before Cpk drops below the 1.67 minimum target |
| Cpm | Taguchi capability index — accounts for both process spread and deviation from target value | Rarely calculated in traditional SPC due to additional computation complexity; requires target value specification | Calculated continuously for every parameter with a defined target; displayed alongside Cp and Cpk on SPC dashboard | Cpm penalizes processes that are centered but over-controlled — identifying parameters where precision is achieved at the cost of excessive adjustment |
| Pp / Ppk | Process performance indices — similar to Cp/Cpk but uses total process variation (long-term sigma) instead of within-subgroup variation | Calculated quarterly from all available historical data; long-term sigma includes between-subgroup variation from raw material and environmental changes | Calculated continuously over user-selectable time windows (30, 60, 90 days) to track long-term process performance trends | Pp/Ppk trends reveal whether process improvements are sustaining over time — a stable Cpk with declining Ppk indicates that between-subgroup variation is increasing |
Measured Results from SPC AI Engine Deployments
The metrics below represent average results from iFactory SPC AI Engine deployments across steel plants over 12-month validation periods. Individual results vary based on facility size, process complexity, existing SPC maturity, and deployment scope.
Industry Expert Perspective: SPC Modernization in Steel Manufacturing
I spent 11 years as a QA engineer at an integrated steel plant producing 2.8 million tons annually, and SPC was the most frustrating part of my job — not because the methodology is wrong, but because the data volume made it impossible to apply correctly. We had 30-plus process parameters per grade that we were supposed to monitor with X-bar and R charts, and our SPC software required manual data import and chart review. I would spend the first two hours of every shift exporting data from the DCS historian, updating control charts, and looking for out-of-control signals from the previous shift. By the time I found a rule violation — say, four of five points beyond Zone B on finishing temperature — the assignable cause had already passed, and we had produced 15 to 20 coils that were potentially affected. The iFactory SPC AI Engine automated the entire process. Now every coil updates every control chart within 500 milliseconds of production, all eight Western Electric rules are evaluated on every data point, and I get an alert on my phone when a rule violation occurs — not the next morning. Within the first month, the platform detected a Zone A violation on coiling temperature that was caused by a cooling header nozzle blockage that had been developing for three days. The blockage was barely visible on the manually reviewed charts because it progressed gradually, but the AI engine flagged it the moment the fourth consecutive point crossed the Zone B boundary. We cleared the nozzle during the next roll change and avoided a full shift of off-coil production. That single event paid for the first year of the platform subscription.
Conclusion: Real-Time AI-Augmented SPC Is the New Standard for Process Control in Steel Manufacturing
Statistical process control was developed for an era when data was scarce and computing was expensive. The fundamental methodology — control limits, zone tests, and capability indices — remains valid, but the implementation must evolve to match the data volume and production speed of modern steel plants. Manual chart review and quarterly capability studies cannot provide the real-time process visibility that QA engineers need to prevent off-grade production and maintain process capability at competitive levels. iFactory's SPC AI Engine closes this gap by bringing Shewhart's methodology into the age of AI — automating control chart generation, applying all eight Western Electric rules at sub-second latency, augmenting standard rules with AI-detected patterns, and calculating capability indices continuously from 100 percent of production data. For QA engineers and quality directors evaluating SPC modernization, the path forward is clear: the tools that served the industry for 90 years must be adapted to the data environment of the 21st century, and AI-augmented SPC is the adaptation that preserves the methodology while eliminating the manual limitations that have prevented it from reaching its full potential.