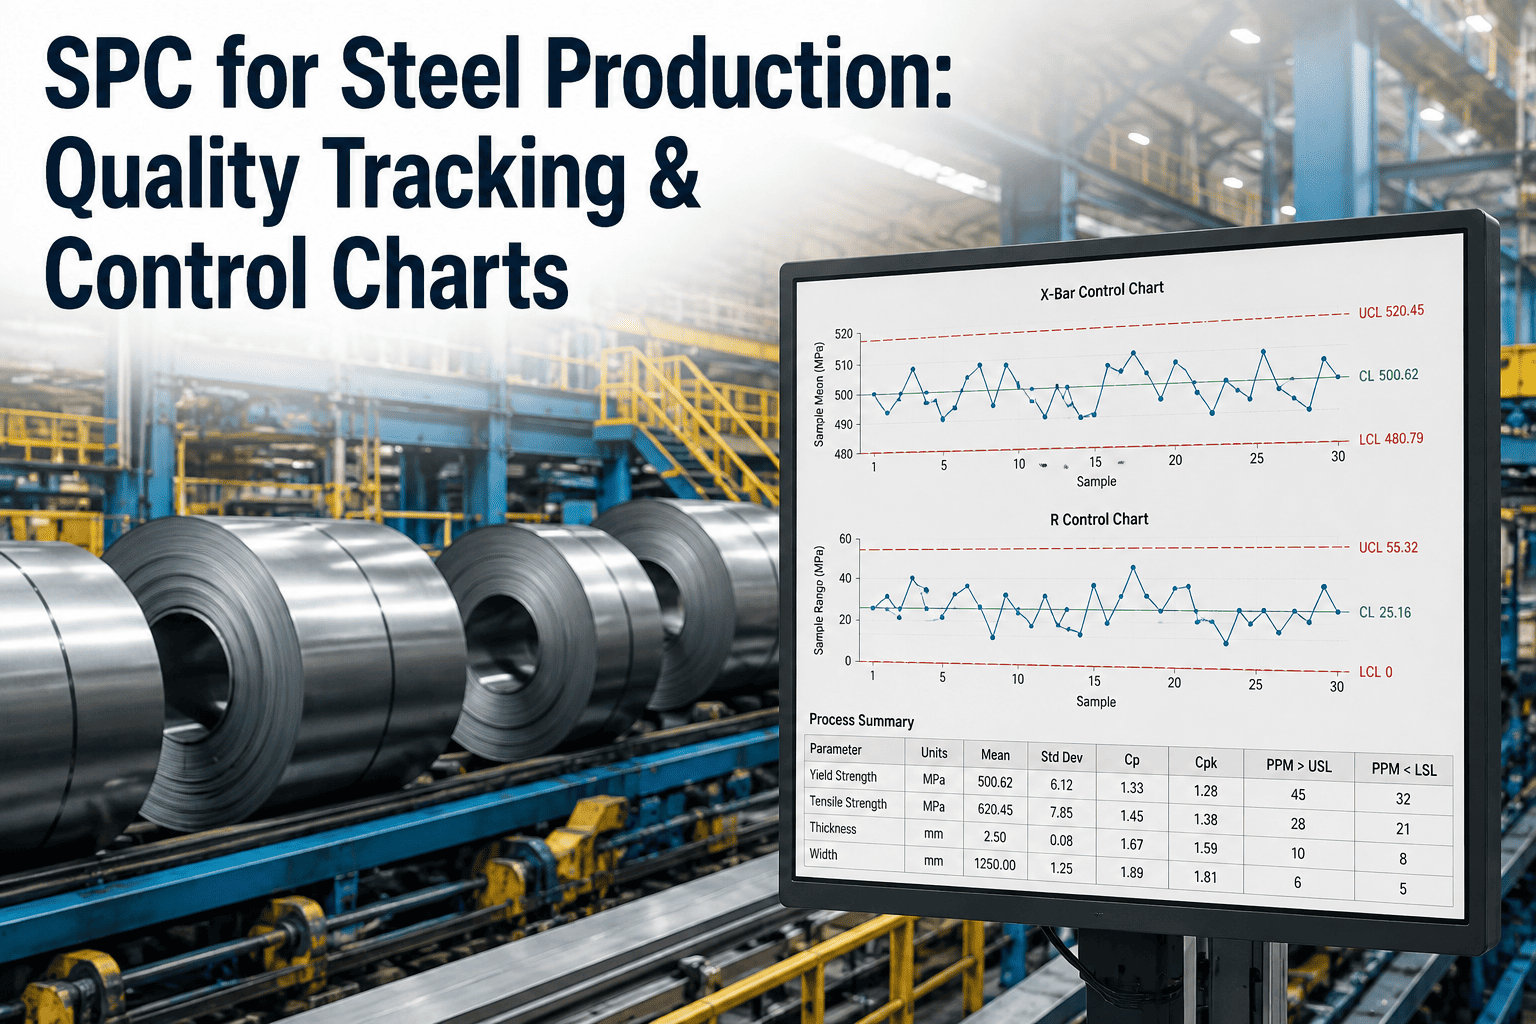
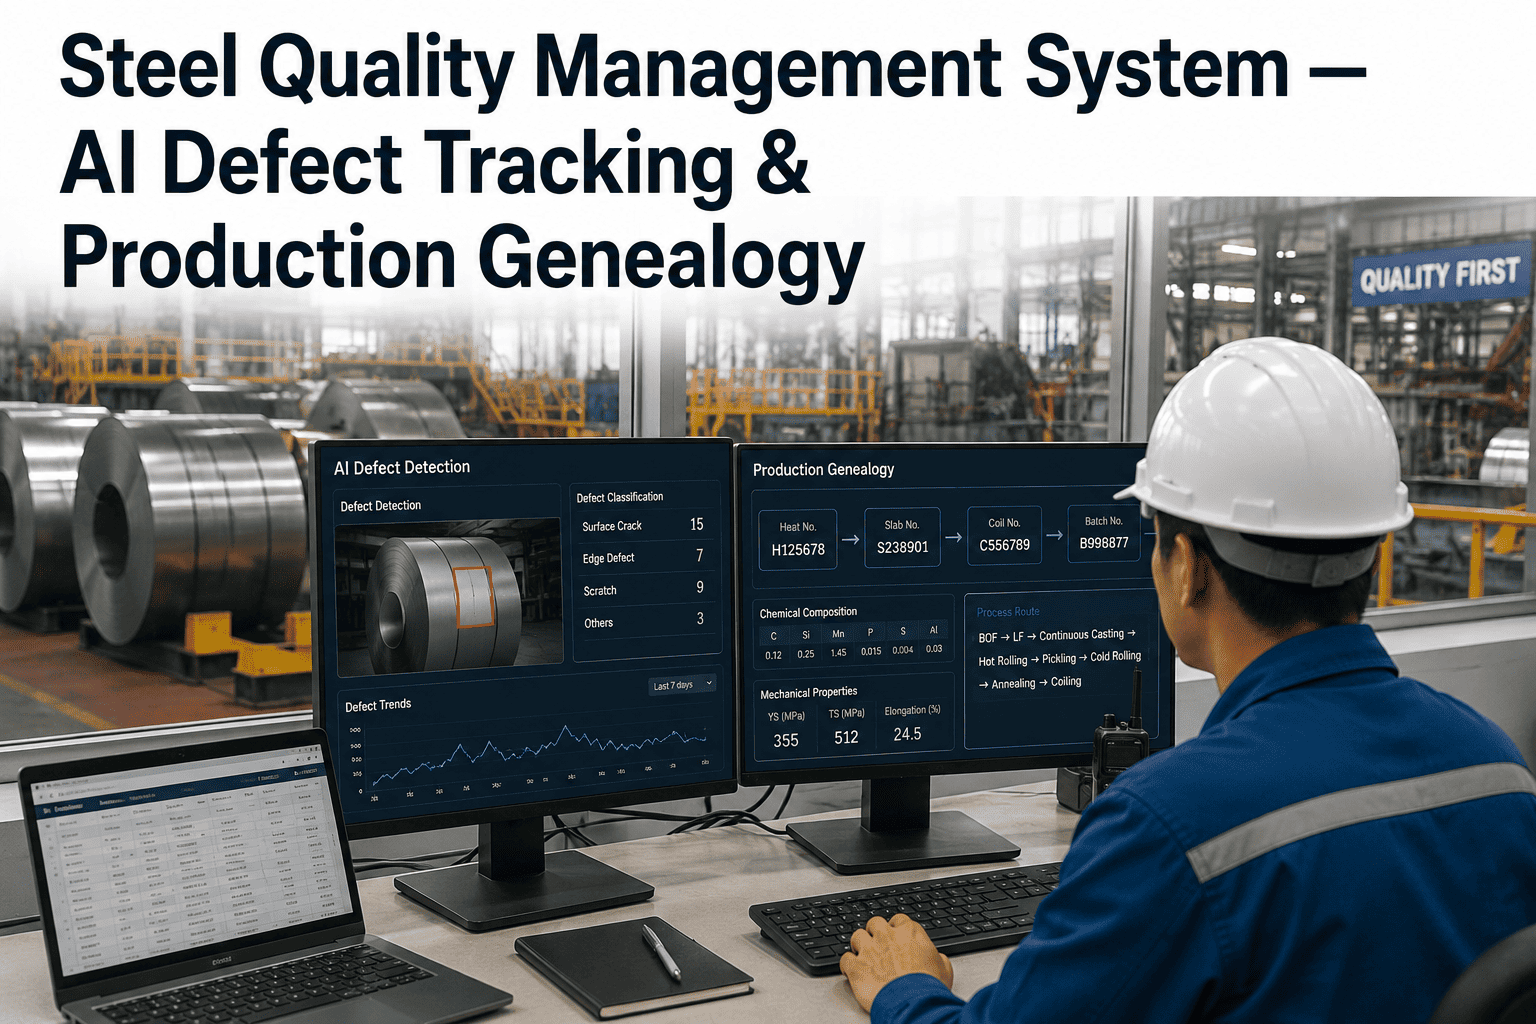
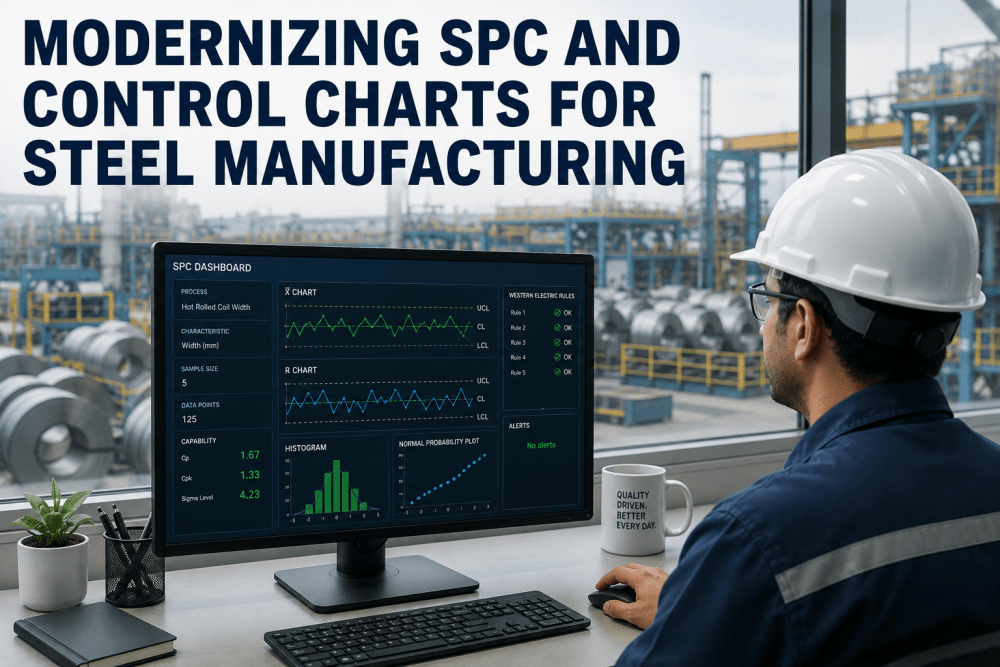
In the ultra-competitive landscape of high-grade steel production, Statistical Process Control (SPC) is the thin line between a high-margin automotive coil and a low-value scrap event. From managing the delicate chemistry of a ladle to ensuring the precise crown and flatness of a hot-rolled strip SPC charts deliver the mathematical rigor required to maintain Six Sigma reliability and meet the stringent requirements of IATF 16949 and AS9100 standards. By implementing real-time X-bar R charts and tracking Process Capability Indices (Cpk), modern steel manufacturers can move beyond simple "Pass/Fail" inspections into a world of predictive quality autonomy. This guide explores how iFactory's Quality Hub utilizes AI-enhanced SPC to detect out-of-control trends before they manifest as dimensional variances or metallurgical defects. Schedule a Quality Audit to benchmark your Cpk performance.
Is Your Process Variation Robbing Your Margins?
Unify chemical analysis, dimensional tolerances, and surface quality data into one intelligent SPC platform designed for high-throughput steel operations.
Why AI-Driven SPC is the Foundation of High-Value Steel Manufacturing
Modern steelmaking is a battle against Process Variation. Whether it's the thermal fluctuations in a reheat furnace or the roll wear in a finishing stand, every variable has a statistical signature. Traditional quality management relies on post-production testing, which often identifies defects only after thousands of dollars in material have been processed. AI-driven SPC platforms bridge this gap by performing Stream-Based Trend Analysis. By aggregating data from spectrometer logs, thickness gauges, and load cells, the system identifies "Common Cause" vs. "Special Cause" variation in real-time. When metallurgical teams book a demo, they discover that their existing sensor data contains early-warning patterns for Sticker Breakouts, Surface Slivering, and Tension Oscillations that traditional thresholds miss.
The shift to Closed-Loop Quality Control begins with the control chart. By dynamically calculating Control Limits (UCL/LCL) based on current grade specifications and rolling conditions, iFactory ensures that alerts are meaningful and actionable. This reduces "Alarm Fatigue" while providing a rigorous Out-Of-Control Action Plan (OCAP) that guides operators through corrective measures before the process breaches customer tolerance limits.
Metallurgical Chemistry SPC
Track alloying element consistency (C, Mn, Si, P, S) across heats. Detect subtle drift in ladle furnace performance to ensure every slab meets exact metallurgical grades without over-alloying.
Dimensional Tolerance Monitoring
Real-time X-bar charts for thickness, width, and flatness (I-units). Correlate mill stretch and roll thermal expansion with dimensional drift to maintain sub-micron precision.
Surface Quality Analytics
Quantify surface defect density (scratches, pits, scale) using AI vision data. Set p-charts and c-charts for attribute-based quality tracking across different coil segments.
Cpk & Ppk Capability Indexing
Automatically calculate process capability (Cpk) for every production run. Validate that your mill can consistently meet tight customer specs with a 1.67 or 2.0 Cpk target.
Building a Unified Statistical Quality Hub for Steel Operations
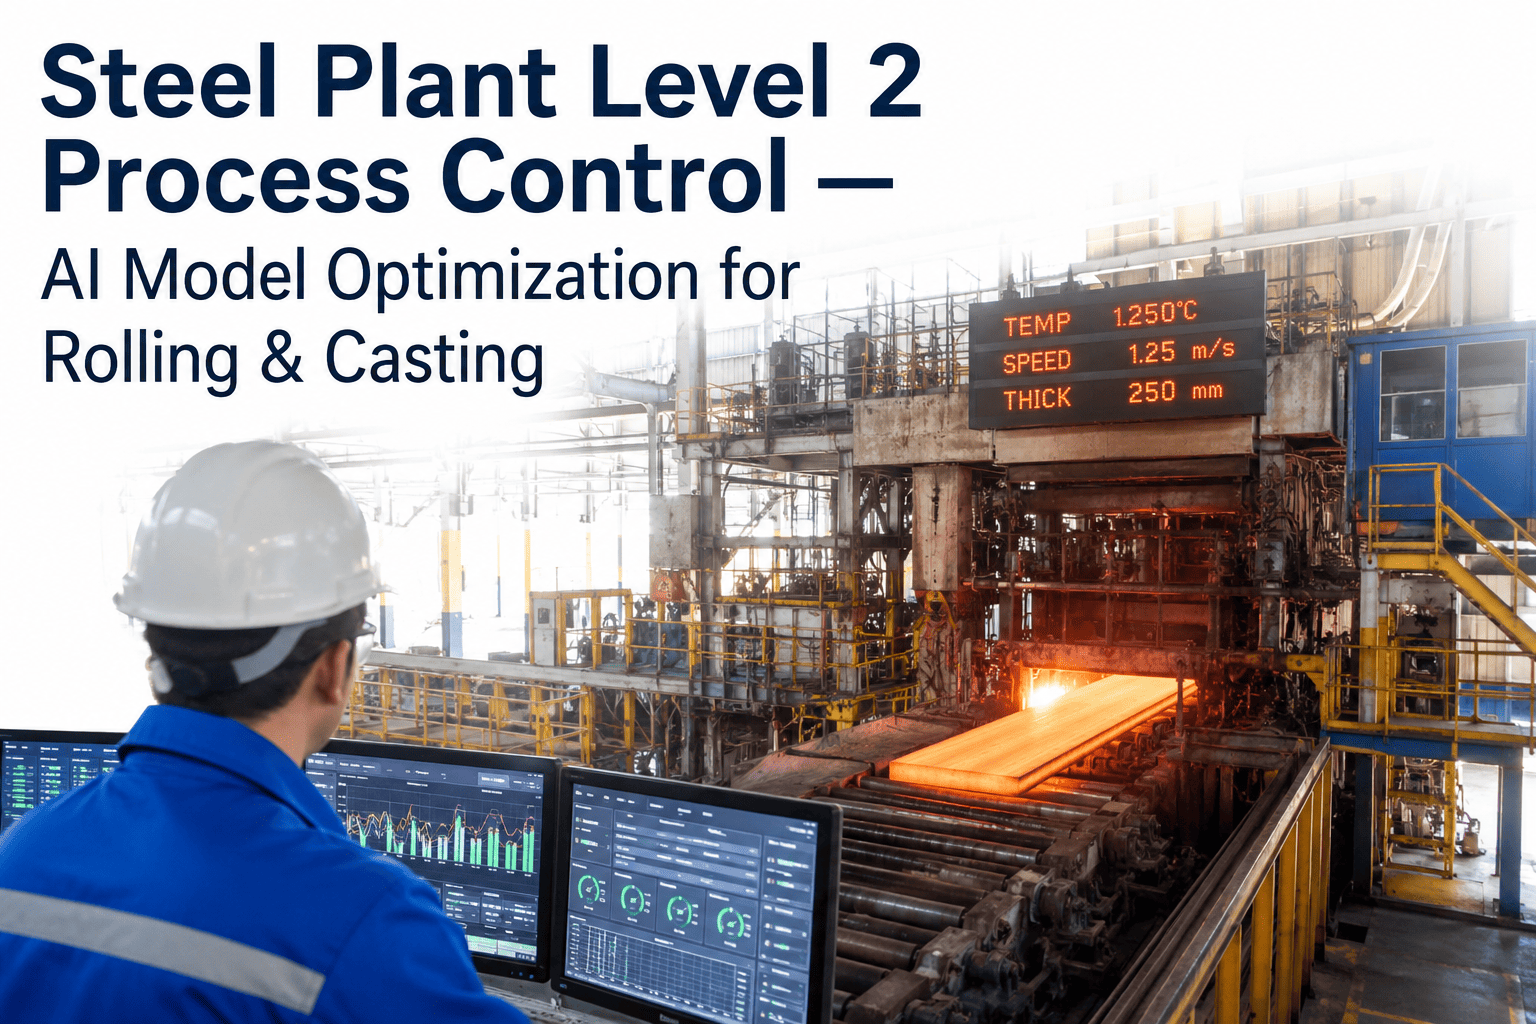
A high-performance steel SPC platform must integrate with the diverse instrumentation found across the "Melt-to-Mill" lifecycle. From the harsh environment of the caster to the high-speed processing of the tandem cold mill, the data layer must remain robust. iFactory connects LIMS (Laboratory Information Management Systems), Level-2 Automation, and MES (Manufacturing Execution Systems) into a unified dashboard. Quality managers who have booked a demo report that this "Single Source of Truth" has reduced quality-related claims by up to 35% within the first six months of deployment.
| SPC Module | Statistical Tool | Steel Application | Quality Benefit | Priority |
|---|---|---|---|---|
| Chemical Consistency | X-bar & R Charts | Ladle Furnace Alloying | Reduces over-alloying costs | Critical |
| Dimensional Accuracy | Moving Range (MR) | Tandem Mill Thickness | Prevents gauge downgrades | Critical |
| Surface Inspection | c-Charts & p-Charts | Galvanizing Surface Quality | Validates automotive specs | High |
| Process Capability | Cpk / Ppk Analysis | Batch-to-Batch Stability | Guarantees customer SLA | High |
| Thermal Stability | EWMA Charts | Reheat Furnace Temp | Minimizes scale formation | Standard |
The Roadmap to Zero-Defect Steel: 5 Steps to Advanced SPC Implementation
Transitioning from manual quality checks to an AI-driven SPC environment requires a phased approach that prioritizes data integrity and operator adoption. By focusing on high-impact areas like the finishing train or the coating line first, mills can achieve rapid ROI while building the foundation for plant-wide quality autonomy. Book a strategy session to see how we handle mill-wide integration.
Data Fusion & Instrumentation Calibration
Aggregate data from thickness gauges, spectrometers, and thermal cameras. Ensure all sensors are calibrated and providing the high-frequency telemetry required for accurate control limit calculations.
Establishment of Dynamic Control Limits
Calculate baseline mean and standard deviation for each grade and process step. Use AI to adjust limits based on "Process Context" (e.g., compensating for known roll-wear cycles or raw material variations).
Real-Time Pattern Detection Activation
Enable Western Electric or Nelson rules for trend detection. The system identifies 8 consecutive points on one side of the mean, sudden shifts, or cycles that indicate equipment wear or sensor drift.
Automated OCAP (Out-of-Control Action Plan)
When a violation occurs, the system triggers a digital OCAP. Operators are prompted with specific inspection tasks (e.g., 'Check hydraulic fluid pressure' or 'Inspect Stand 5 roll surface') to resolve the issue immediately.
Executive Quality Review & Cpk Reporting
Generate automated Cpk and Ppk reports for customer compliance audits. Use long-term variability data to guide CapEx investments toward the equipment most responsible for process instability.
Critical Quality Gaps in Traditional Steel Manufacturing
Even the most established steel plants often suffer from "Fragmented Quality Management." Understanding these gaps is essential for moving toward a Smart Factory model where quality is built-in, not inspected-out. Quality directors regularly book a demo to benchmark their current quality maturity against our AI-first framework.
Chemistry results from the lab arrive hours after the heat is cast, making real-time process adjustment impossible and leading to batch-wide quality failures.
Basic 'Upper/Lower' alarms trigger too late. By the time a limit is breached, the process has been unstable for miles of strip, resulting in massive scrap volumes.
Quality specs sit in paper binders or disconnected spreadsheets, leading to operator errors and the application of incorrect control limits for specialized grades.
Operators spending hours manually plotting charts on paper. This 'Post-Mortem' SPC is prone to error and provides zero predictive value during the production run.
Failing to link quality defects back to specific mechanical anomalies (e.g., bearing vibration) makes it impossible to prevent the defect from recurring in the next cycle.
Lack of long-term process performance data (Ppk) makes it difficult to win contracts from high-spec customers in the aerospace and automotive sectors.
AI-Enhanced Quality Hub: The Future of Steel Process Control & Six Sigma Excellence
At its core, iFactory's Quality Hub is about transforming raw data into Manufacturing Intelligence. In a hot strip mill, the interaction between strip tension, temperature, and roll pressure is non-linear and complex. Our platform uses Multivariate SPC (MSPC) to monitor these interactions simultaneously, identifying the specific combination of variables that lead to 'Cobbles' or 'Edge Cracking.' Unlike traditional SPC which monitors single variables, MSPC identifies 'Hotelling T2' violations—anomalies where multiple variables are within their individual limits but their collective interaction is unstable.
This level of insight allows quality engineers to push the boundaries of their process, rolling thinner and stronger steels with total confidence. By integrating Machine Learning Classifiers with traditional statistical rules, the Quality Hub can predict a quality defect up to 15 minutes before the material reaches the finishing stand. This 'Predictive Quality' layer is the key to achieving Zero-Defect Manufacturing and securing a position as a Tier-1 supplier for the EV and Aerospace markets. Book A Demo to see our metallurgical model library.
Key SPC Capabilities for Steel Plant Digitalization
Continuous tracking of process mean and range for critical parameters like gauge, width, and chemistry, with sub-second limit updates.
Instant visibility into process capability indices, allowing you to prove your mill's precision to the most demanding automotive OEMs.
AI-driven identification of shifts, cycles, and trends that indicate emerging equipment failures or raw material drift.
Ensure every out-of-control event is met with a standardized, documented corrective action plan that preserves institutional quality knowledge.
Ready to Eliminate Quality Downtime and Scrap?
Deploy a unified SPC platform that integrates real-time control charts, process capability analysis, and automated OCAPs into your mill's operations.
Steel Manufacturing SPC — Strategic Questions Answered
What is the difference between Cpk and Ppk in a steel mill context?
Cpk (Process Capability Index) measures how well your process can produce within specification in the short term, assuming the process is stable. Ppk (Process Performance Index) measures how the process actually performed over a longer period, accounting for all variation including shifts in mean. In steel, Cpk is used for batch-to-batch validation, while Ppk is critical for long-term supply contract audits from OEMs.
How does the platform handle the extreme noise of a hot rolling mill?
We use advanced filtering and context-aware normalization. The system understands that Stand 1 will naturally have higher variation than Stand 7. By applying Grade-Specific Control Limits, the SPC engine filters out the 'noise' of the aggressive mechanical environment to isolate the true quality signature of the strip.
Can we integrate our existing Laboratory LIMS data for chemistry SPC?
Yes. iFactory features pre-built connectors for most major LIMS platforms. This allows us to ingest metallurgical analysis results automatically and plot them on X-bar charts alongside process data from the caster or furnace, enabling Multi-Stage Correlation of quality defects.
Does the system support Western Electric and Nelson Rules for trend detection?
Absolutely. The platform includes the full suite of statistical rules for identifying non-random patterns. This includes detection of trends (6 points increasing/decreasing), oscillations (14 points alternating up/down), and shifts in mean (9 points on one side of the center line), all of which trigger immediate operator notifications.
How does an 'Automated OCAP' work in practice?
When the SPC engine detects an 'Out-of-Control' event, it doesn't just sound an alarm. It launches a digital checklist tailored to that specific violation. For a gauge variance, it might prompt the operator to 'Verify AGC servo pressure' and 'Check roll temperature profile.' This ensures that corrective actions are standardized and results are recorded for continuous improvement analysis.
Can we generate custom quality reports for different customers?
Yes. The Quality Hub allows you to build grade-specific and customer-specific report templates. You can automatically include control charts, histogram analysis, and capability statistics (Cpk/Ppk) in a branded PDF, ready for submission to your customer's quality portal or audit team.
What is Multivariate SPC and why do we need it?
Traditional SPC looks at variables in isolation. Multivariate SPC looks at the relationship between variables—for example, how the interaction between entry temperature and roll speed affects final strip hardness. This is critical for high-spec grades where the individual variables might be 'In-Control' but their combination is creating a defect.
How long does it take to implement the Quality Hub?
A typical implementation for a single production line takes 6-8 weeks. This includes data integration, baseline statistical analysis, and operator training on the OCAP workflow. Most mills see a measurable reduction in scrap and quality claims within the first full month of operation.