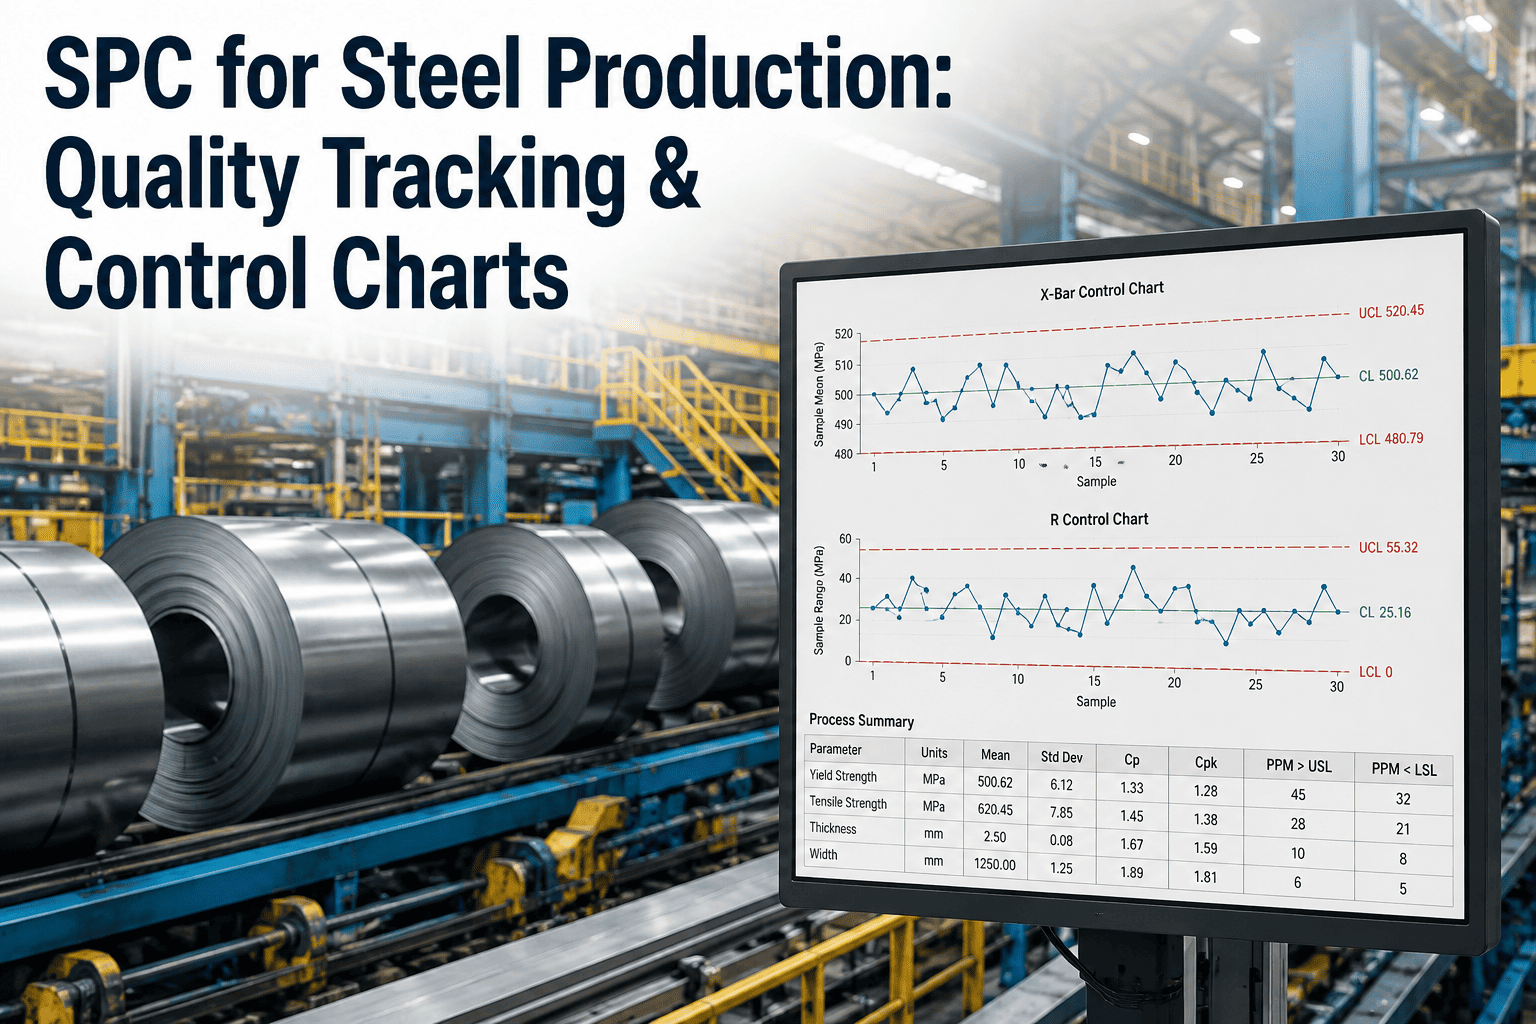
A rolling mill can produce a defective coil for hours before anyone downstream notices the chemistry or dimension has drifted, because most quality checks still happen after the fact, on a sample pulled once a shift and reviewed the next morning. By the time a lab result flags an out-of-spec heat, the mill has already rolled dozens of tons that now sit in a hold area waiting on disposition, and the root cause, a slow drift in a furnace setpoint or a gradual roll wear pattern, has usually been running unnoticed since the previous shift change. Statistical process control closes that gap by watching the process while it runs rather than after it finishes, and iFactory automates the charting, rule detection, and alerting so drift gets caught in minutes instead of a full production cycle. You can book a demo to see live control charts built from your own chemistry and dimensional data.
Catch Drift While It Is Still a Trend, Not a Rejected Heat
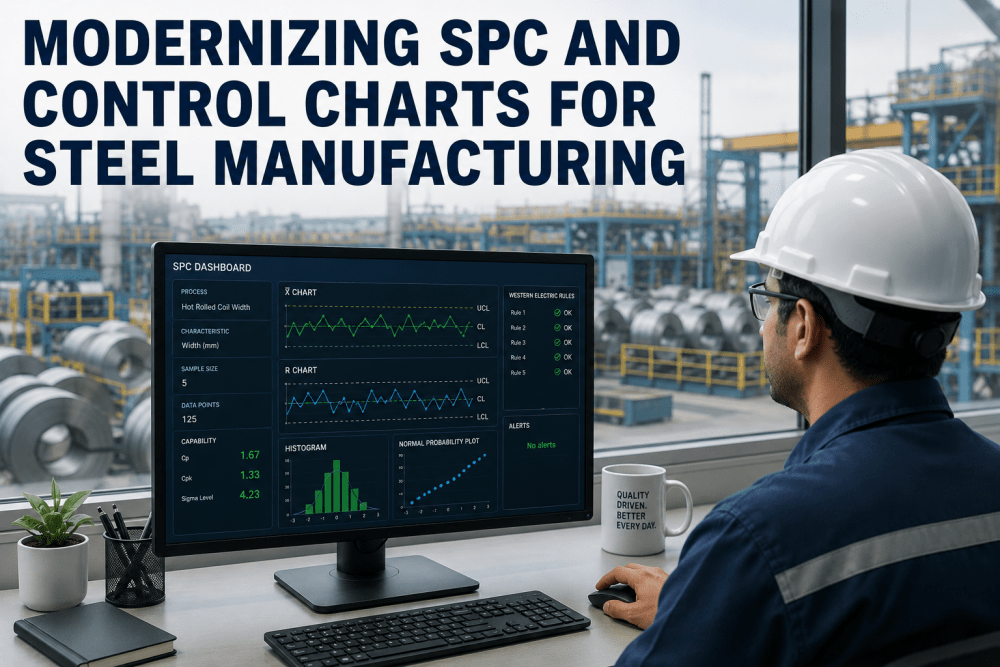
iFactory turns chemistry, dimension, and mechanical property data into live control charts, applies automated out-of-control rules the moment a point breaks a limit, and routes an alert to the right shift before a drifting process becomes a documented nonconformance.
Sample-and-React Quality Control Is Expensive in a Way Budgets Rarely See
Most steel producers already collect the data SPC needs, chemistry from spectrometers, dimensions from gauges, mechanical properties from tensile and hardness tests, but that data typically lives in disconnected spreadsheets or lab systems reviewed on a delay. A process can drift for an entire shift before a scheduled check catches it, and by then the plant is choosing between reworking material, downgrading it, or scrapping it outright. Control charts exist specifically to shorten that detection window, plotting every result the moment it is available and applying statistical limits that separate normal process variation from a real signal that something has changed.
The Right Chart for Chemistry, Dimensions, and Mechanical Properties
Not every measurement behaves the same way statistically, so a single chart type applied across the board tends to either miss real signals or flag noise as a problem. iFactory selects and configures the appropriate chart family for each characteristic your process actually measures, rather than forcing all data through one generic template.
Rules That Catch a Trend Before It Crosses the Limit
A single point outside the control limits is the easiest signal to catch and, in practice, the least common way processes actually drift. Real drift usually shows up first as a run of points trending in one direction, a cluster hugging one side of the centerline, or a pattern that repeats at a regular interval, all of which a human reviewing charts once a shift is likely to miss. iFactory applies a standard set of detection rules automatically to every chart, so these earlier signals get flagged before a limit is ever breached.
See Your Own Chemistry Data Charted Live
iFactory connects to your spectrometer, gauge, and lab systems and builds control charts automatically, with rule-based alerts routed to the right shift. Book a demo and bring a recent heat log.
Being In Control Is Not the Same as Being Capable
A process can sit statistically stable, no rule violations, no trends, and still routinely produce material close to its specification limits, which shows up in process capability indices rather than in the control chart itself. Cp compares the width of the specification to the width of natural process variation, while Cpk adjusts that comparison for how centered the process actually is between its limits, which matters when a process is stable but running consistently closer to one boundary than the other.
iFactory calculates Cp and Cpk continuously as new results come in rather than as a periodic report, so a slow erosion in capability, a mean creeping toward a limit even while every point stays technically in control, becomes visible on a trend line long before it turns into a spec violation.
What Changes When Charting Stops Being a Spreadsheet Task
Manual SPC is not a bad method, it is a slow one, dependent on someone remembering to plot the latest point, calculate limits correctly, and recognize a pattern rule by eye. Automating the mechanics does not change the underlying statistics, it changes how quickly a real signal reaches the person who can act on it.
| Factor | Manual Spreadsheet SPC | iFactory Automated SPC |
|---|---|---|
| Data Entry | Copied by hand from lab systems and gauges into a chart template | Pulled automatically from spectrometers, gauges, and lab systems |
| Rule Detection | Depends on a reviewer noticing a pattern by eye, often once a shift | Applied automatically to every new point as it arrives |
| Alerting | No alert until someone reviews the chart | Immediate alert routed to the responsible shift or operator |
| Capability Tracking | Recalculated periodically, often monthly or quarterly | Recalculated continuously as new data accumulates |
| Audit Trail | Scattered across spreadsheet versions and email threads | Centralized history tied to each heat, coil, or lot |
Built for the Processes That Generate the Most Quality Data
SPC earns its place wherever a process produces enough repeated measurements to make a control chart meaningful, which in a steel operation covers most of the value chain from melting through finishing.
Questions Quality and Process Teams Ask First
Turn Every Measurement Into an Early Warning System
iFactory builds live control charts from the chemistry, dimension, and mechanical property data your process already generates, and flags drift before it becomes a rejected heat. Book a demo and see it running on your own data.