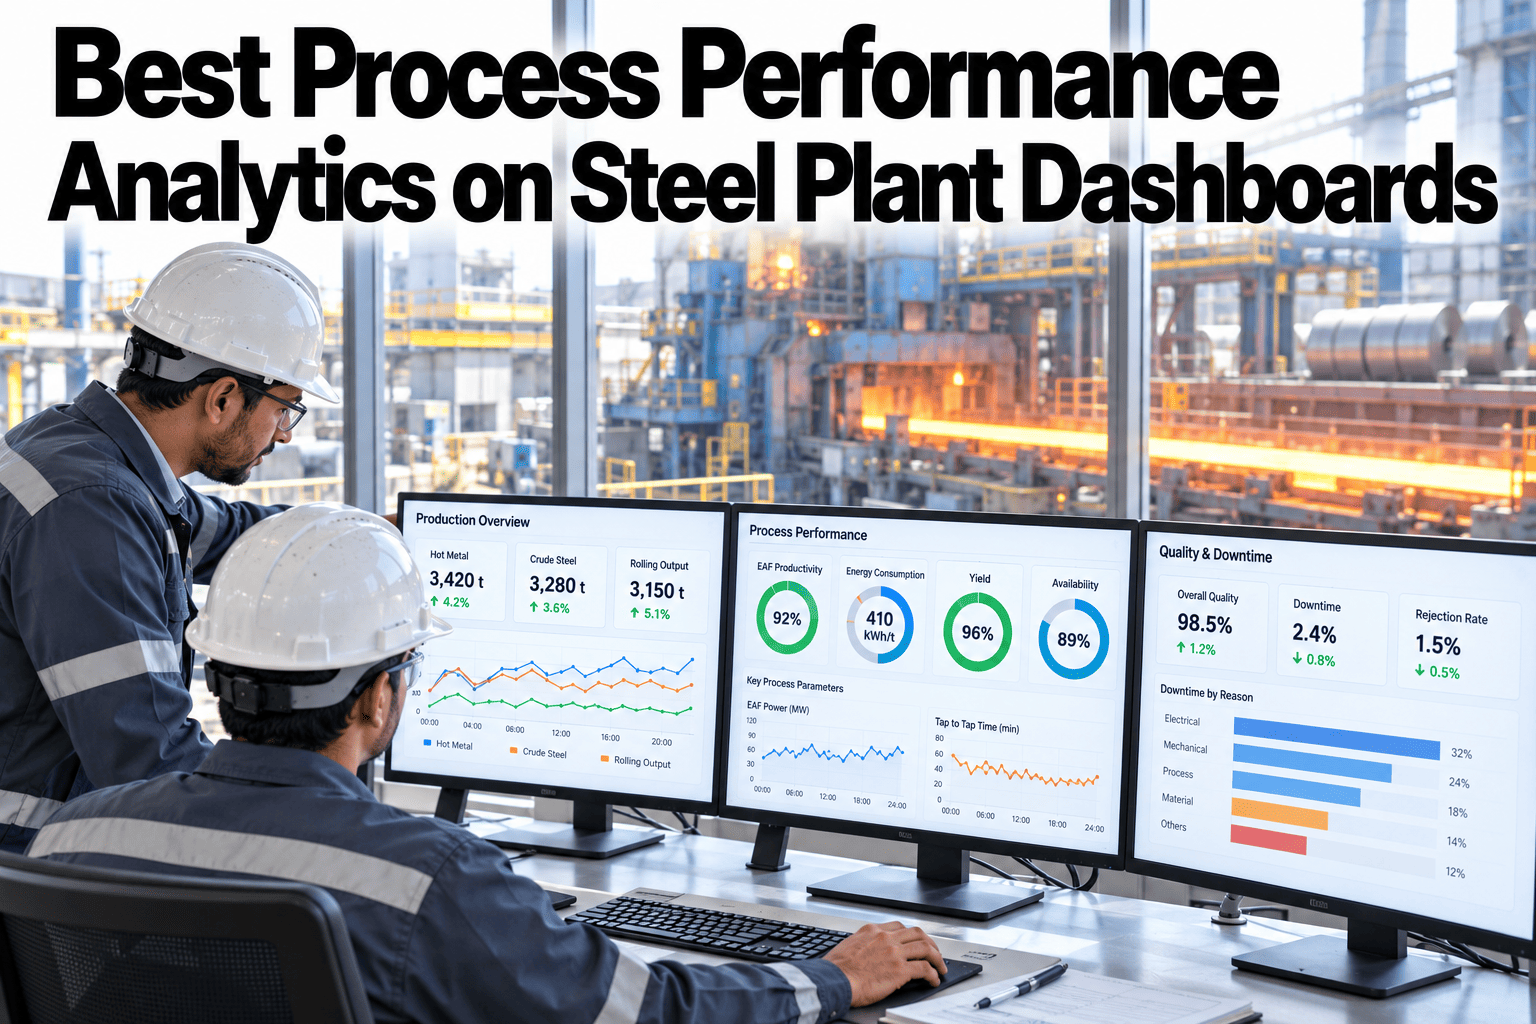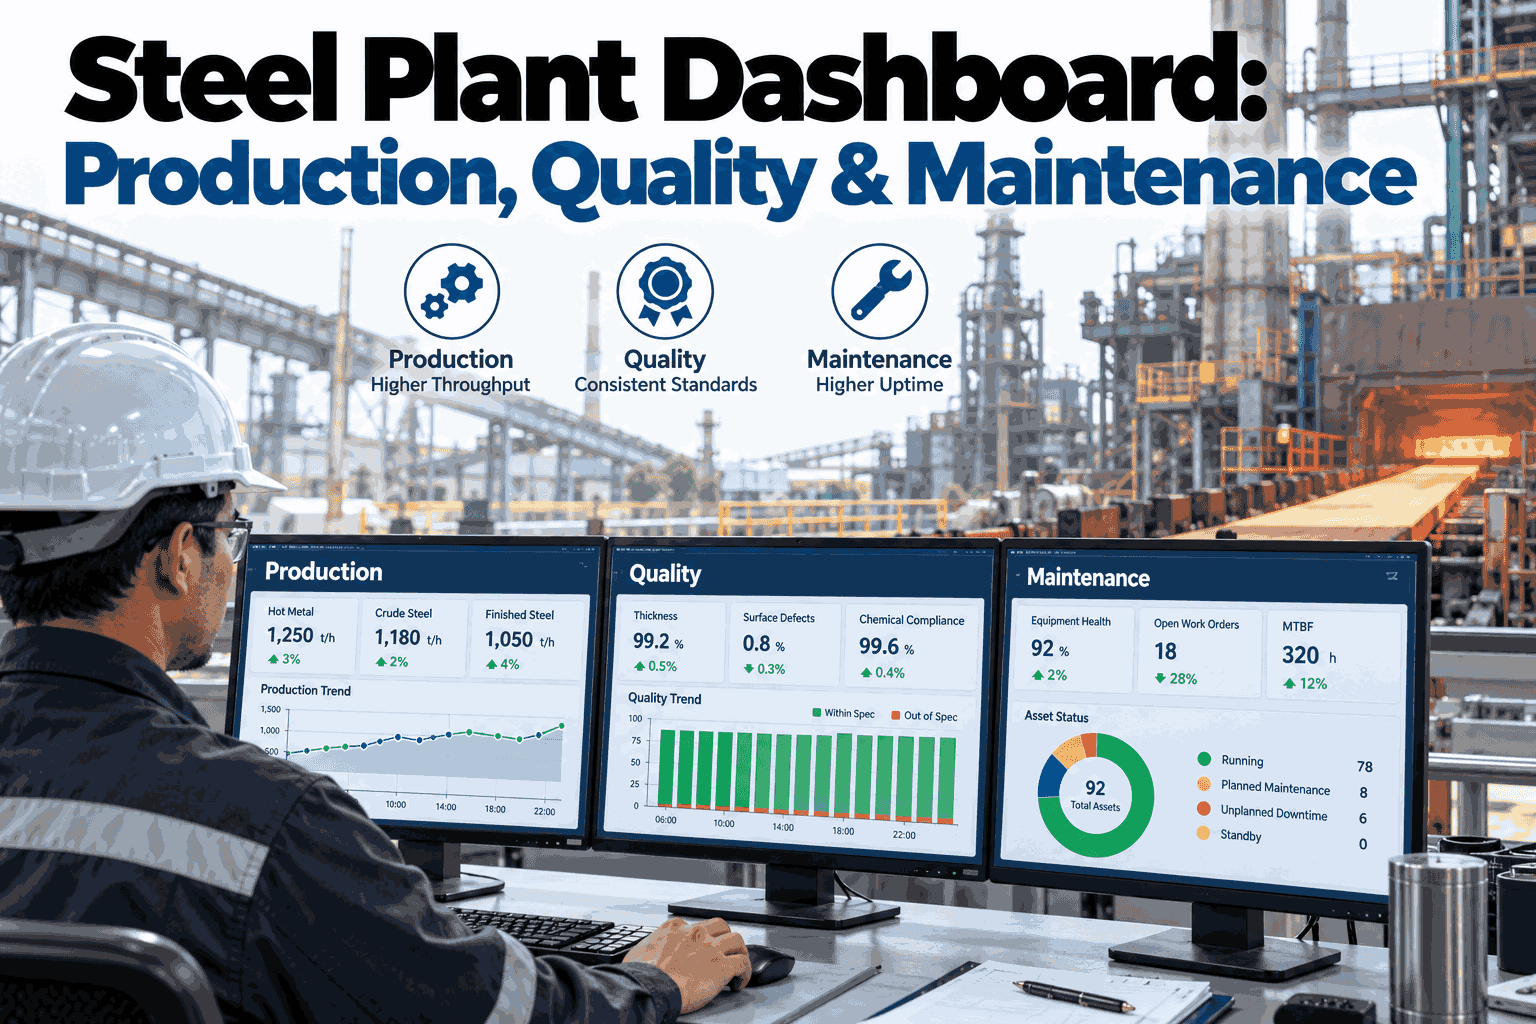
A plant-wide OEE number is good for a monthly report and almost useless on a Tuesday morning. A steel plant can show a healthy 78 percent average while one shop is quietly running at 61 and dragging the whole figure down. A steel plant OEE dashboard for plant managers rolls availability, performance and quality up across every shop, then lets a manager drill down to the line and the event behind any weak number. Plant managers who want their own shop-level breakdown reviewed can see a shop-level OEE dashboard built around their plant.
One Plant Average Can Hide a Shop That Is Actually in Trouble
iFactory, an on-premise AI platform for production analytics, rolls up availability, performance and quality by shop and line, with a direct drill-down to root cause.
What Goes Into the OEE Number
OEE is a single score built from three separate factors multiplied together. Each factor isolates a different kind of loss, which matters once you start diagnosing a weak result.
Why a Plant-Wide Average Hides the Real Problem
A single blended figure is good for a headline but poor for a decision. Two shops running at opposite extremes can still average out to a number that looks acceptable.
| Shop | OEE | Availability | Quality |
|---|---|---|---|
| Melt Shop | 82 | 88 | 97 |
| Rolling Mill | 61 | 68 | 91 |
| Finishing | 79 | 84 | 95 |
Find the Shop Dragging Your Average Down
Share your current plant-wide OEE reporting, and iFactory will show how a shop-level breakdown would look.
What Each Factor Actually Measures
The three factors sound similar but each answers a different question. Confusing them leads to the wrong team being asked to fix the wrong problem.
The Six Big Losses, Mapped to the Three Factors
Every OEE gap traces back to one of six recognized loss categories. Knowing which bucket a loss falls into decides who should act on it.
Drilling Down From a Weak Number to Its Cause
A good dashboard does not stop at the shop level. It follows the chain down to the specific line, shift and event behind the number.
Why One Point of OEE Is Worth Chasing
A single OEE point sounds small until it is converted into tonnage. At a large integrated plant, even a modest percentage gain translates into meaningful recovered production.
| Improvement | Typical Impact |
|---|---|
| 1 point of OEE | Recovered tonnage at the plant's existing capacity |
| Reduced micro-stop time | Performance factor gain without new equipment |
| Faster roll changes | Availability gain through standardized changeover steps |
A Daily Review Cadence That Actually Gets Used
A dashboard nobody reviews is just a screen. The cadence below matches review depth to how often a manager actually needs it.
A Composite Scenario: Finding the Rolling Mill's Real Loss
A plant's monthly OEE sat steady around 74 percent for two quarters, with nobody alarmed. A shop-level breakdown showed the rolling mill sitting well below the other shops, specifically on availability.
A targeted changeover review recovered several points of availability on that one line. This kind of scenario is illustrative; the specific cause and gain will vary by plant.
The Source-of-Truth Problem
A common complaint from plant managers is that maintenance, quality and operations each report a different availability figure for the same shift. The gap is usually not dishonesty, it is three separate manual tallies.
Who Actually Uses a Shop-Level Dashboard
Different roles read the same dashboard for different reasons. Designing for all of them avoids building something only one team actually opens.
Plant Manager
Daily shop comparison and weekly trend review.
Shift Supervisor
Live line status and immediate loss events.
Reliability Engineer
Root-cause drill-down on recurring availability loss.
Common Mistakes in OEE Dashboard Design
| Mistake | Fix |
|---|---|
| Only a plant-wide number shown | Break out availability, performance, quality by shop |
| No drill-down to root cause | Link every weak number to its underlying event log |
| Different loss definitions per shop | Standardize categories to one shared taxonomy |
What a Rollout Typically Looks Like
Connecting an OEE dashboard to existing data usually takes days to a few weeks per plant, depending on what is already instrumented. Standardizing the loss taxonomy across shops is usually the longer step.
Where iFactory AI Fits
iFactory pulls availability, performance and quality directly from PLC, SCADA and MES data, rolled up by shop with a drill-down path to the event behind any weak number.
Shop-Level Roll-Up
Every shop and line is broken out, not hidden inside a plant average.
Root-Cause Drill-Down
A weak number links directly to the event behind it.
Standard Loss Taxonomy
Six big loss categories applied consistently across shops.
OEE Alone Is Not the Whole Picture
OEE combines availability, performance and quality into one score, which is useful but can also hide which factor is actually driving a change. Seeing the three factors alongside the combined score matters.
Frequently Asked Questions
What counts as a good OEE for a steel plant?
Reported ranges typically sit around 60 to 75 percent across integrated mills, with 85 percent commonly cited as the world-class benchmark to aim toward. Benchmark your own figure with our team.
How often should the dashboard actually be reviewed?
A shift-level snapshot and a daily shop review catch issues fastest, while weekly and monthly views are better suited to spotting slower-moving trends. Ask support about review cadence.
Why do different shops report OEE differently today?
Without a shared loss taxonomy, each shop tends to define downtime and quality categories its own way, which makes cross-shop comparison unreliable. Standardize your taxonomy with the iFactory team.
Can this connect to our existing MES and SCADA?
Yes, iFactory pulls directly from existing PLC, SCADA and MES data rather than requiring a separate manual entry step for every shift. Ask what connects to your systems.
How fast can root cause actually be found from the dashboard?
With a direct drill-down path, a weak shop number can usually be traced to its line, shift and specific event within a few minutes. See a live drill-down on a short call.
Stop Letting One Weak Shop Hide Inside a Healthy Average
Book a session with iFactory and see your own availability, performance and quality broken out by shop, with a direct drill-down to root cause.