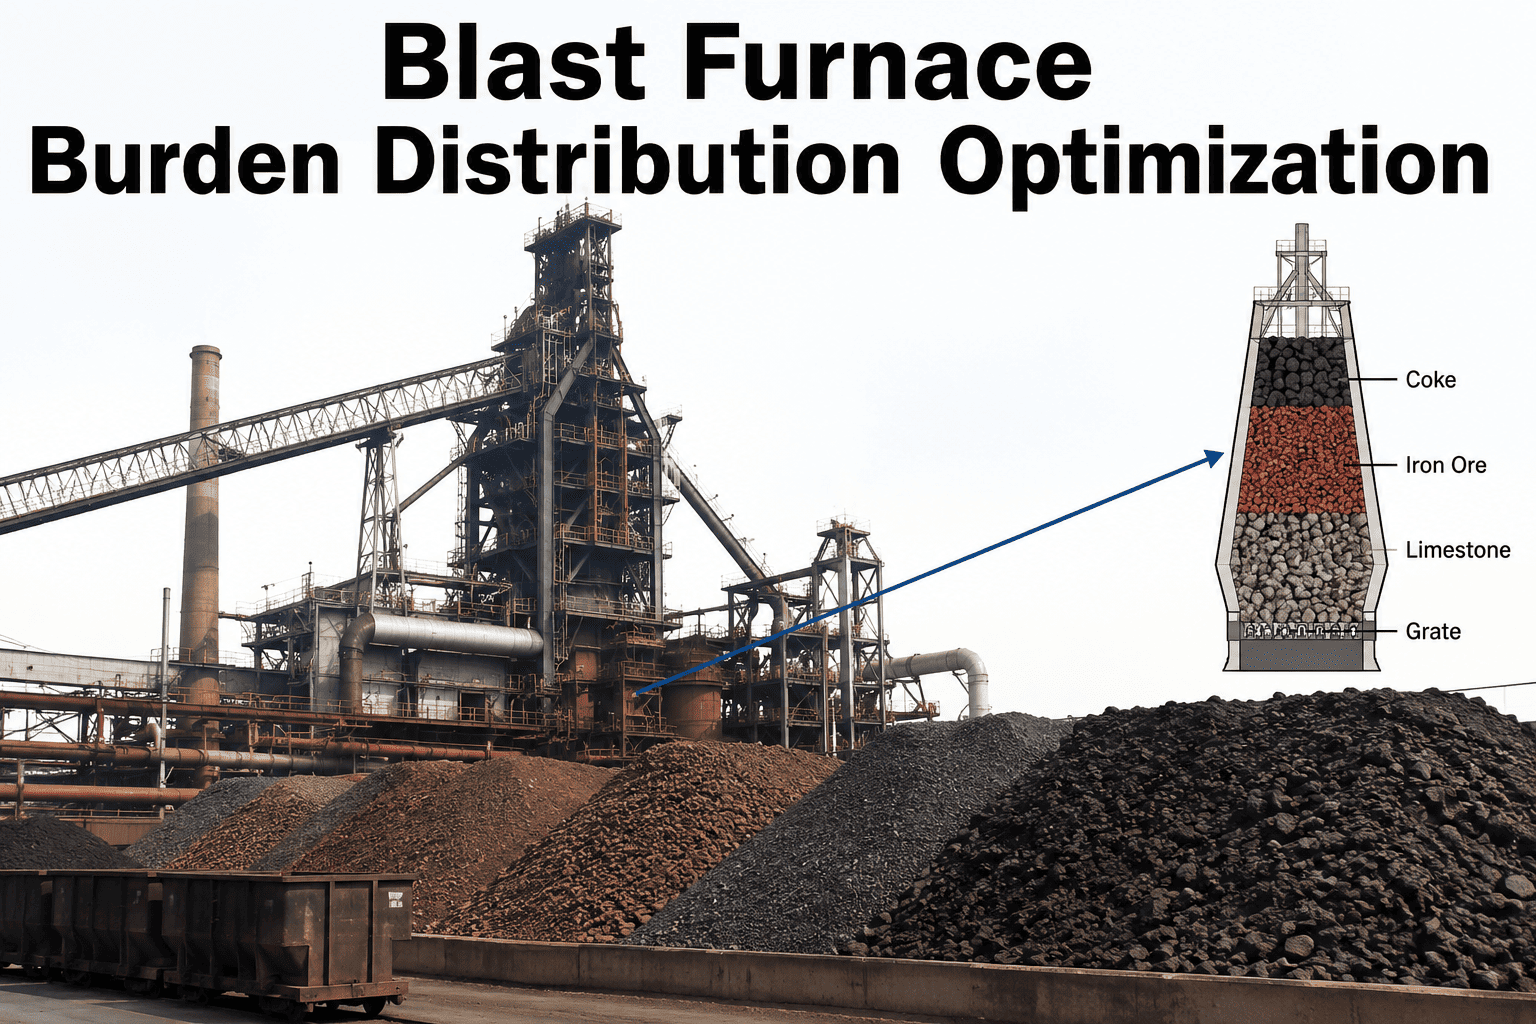
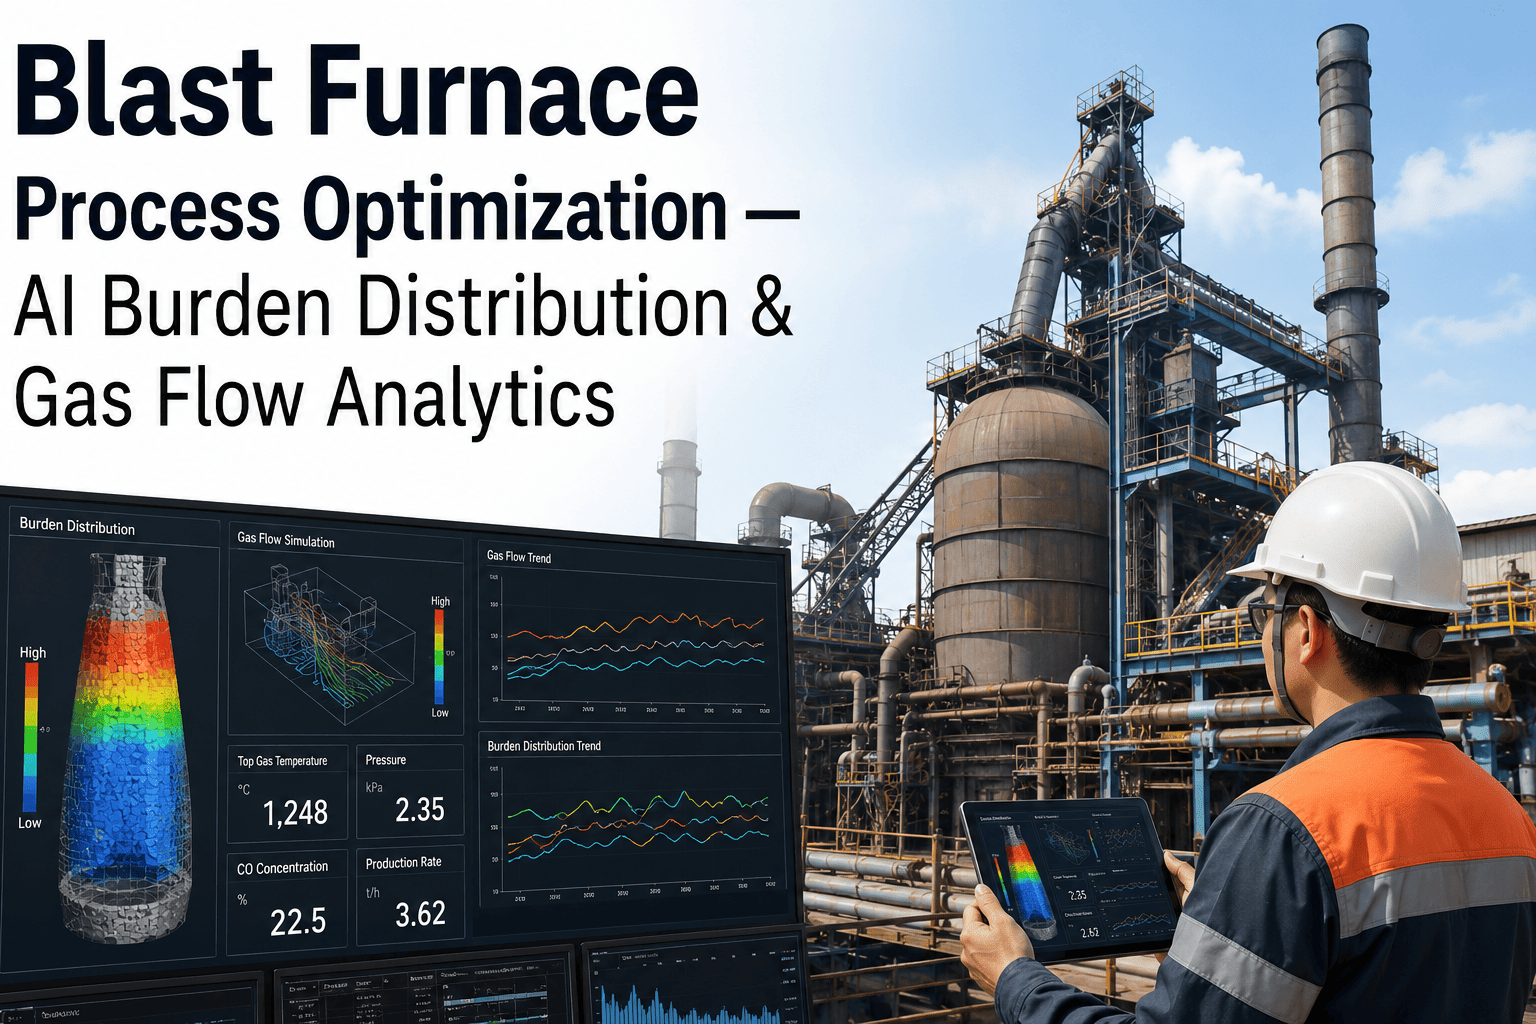
Where each layer of ore and coke lands inside the blast furnace decides how gas moves through it. Too much ore at the wall or too little coke in the centre changes permeability, efficiency and stability, and the effects show up in coke rate hours later. Burden distribution optimisation uses layer thickness, radial permeability and gas flow prediction to plan charging patterns that keep the furnace stable and fuel use low. It supports charging engineers and operators, who still decide. To explore how this could work on your furnace, you can review a burden distribution model with our team.
Blast furnace monitoring and failure prediction
Shape the Burden So Gas Flows Where It Should and Coke Rate Stays Low
iFactory AI links charging patterns, layer thickness and gas flow so teams can plan distributions that keep the furnace stable.
Three things burden distribution controls
Layer thicknessRadial permeabilityGas flow
Why distribution mattersWhere Material Lands Decides How Gas Flows
The blast furnace is a counter-current reactor. Hot gas rises through descending layers of ore and coke. The arrangement of those layers sets how gas finds its way up.
Charging
Material is placed in layers at the top
Layer structure
Ore and coke form rings of different thickness
Gas path
Gas chooses the easiest route through the burden
Result
Efficiency, heat loss and stability follow
Small changes in charging can shift gas flow substantially, which makes distribution one of the most powerful controls an operator has.
Key termsFour Ideas Behind Burden Distribution
1
Ore-to-coke ratio by radius
How much ore versus coke sits at the centre, intermediate ring and wall.
2
Layer thickness
How thick each layer is at each radial position.
3
Radial permeability
How easily gas passes through the burden at each radius.
4
Gas flow distribution
How much gas flows through the centre, middle and wall regions.
Practices and terminology vary between furnace designs and top equipment. Align with your own charging system and operating approach.
Charging systemsHow Material Is Placed
Many modern furnaces use a rotating chute that can place material at several radial positions. Operators set the chute angles and the amount charged at each.
Charging matrix
The pattern of chute angles and rotations for ore and coke.
Layer build
How each charge adds to the layers on the stockline.
Descent
How layers move down and change shape as material melts.
Gas response
How the resulting structure affects pressure and temperature.
A model that links the matrix to the gas response lets engineers test ideas on paper before trying them in the furnace.
See How Your Charging Patterns Shape Gas Flow
Share your charging matrices and gas data and see how iFactory AI would link them to radial permeability and fuel rate.
Measuring the burdenFour Sources of Information About What Is Inside
The inside of a furnace cannot be seen directly. Several indirect measures build a picture.
| Source | What it shows | Limit |
|---|
| Stockline or profile measurement | The shape of the burden surface at the top | Surface only |
| Top gas temperature profile | How gas is distributed across the throat | Indirect view of the inside |
| Pressure and permeability measures | How easily gas passes overall | Not by radius |
| Wall and stave temperatures | Gas flow near the wall | Local and lagging |
A model combines these sources to estimate what is happening at each radius.
Radial permeabilityDifferent Radii, Different Resistance
Each ring of the furnace resists gas differently. Coke-rich areas let gas pass easily. Ore-rich areas with fines resist it.
Radial balance
Strong central flow
Weak central flow
Controlled wall flow
Balanced
Efficient, stable running
Overworking the wall
Heat loss and wear risk
Excess wall flow
Closed core
Poor permeability and instability risk
Poor overall
Gas struggles to pass anywhere
Targets differ by furnace and campaign stage. Set limits with process engineers.
Gas flow predictionFour Steps From Charging Pattern to Gas Forecast
1
Describe the charge
Input ore and coke amounts and chute positions.
2
Estimate layers
Model layer thickness and structure at each radius.
3
Predict gas flow
Estimate permeability and gas distribution.
4
Compare with reality
Check against pressure, temperature and wall data and learn.
Predictions improve when the model learns from the furnace's own history. Each new charging change becomes another data point.
Stable and low coke rateHow Distribution Links to Fuel and Stability
Good distribution supports both goals. Poor distribution undermines them.
Poor distribution
Excess wall flow
Low gas utilisation
Higher coke rate
Greater risk of instability
Well-managed distribution
Controlled wall and central flow
Higher gas utilisation
Lower coke rate
Steadier operation
The gains are rarely dramatic overnight. They come from steady attention and small adjustments.
TransitionsThe Hardest Moments Are When Things Change
Changes in raw materials, coke quality, production rate or campaign stage disturb the distribution. Transitions are where models help most.
1
New raw material mix
Different size and strength change layer behaviour.
2
Changes in coke quality
Strength and size affect permeability.
3
Production rate changes
Blast and descent speed alter gas flow.
4
Equipment changes
Chute wear or settings change where material lands.
5
Campaign stage
Furnace shape evolves over time.
Plan a transition checklist. Many problems arise when a change is made without adjusting charging to match.
Where the benefit comes fromAn Illustrative Split of Gains From Better Distribution
The benefits differ by furnace. This split is illustrative.
35 percent: Gas efficiency
Better use of reducing gas.
30 percent: Stability
Fewer swings and slips.
20 percent: Lower heat loss
Less heat to the cooling system.
15 percent: Other
Productivity and operating margin.
Autonomy levelsKeep Engineers and Operators in Control
Display
The model shows estimated layers and gas flow.
Advice
The model suggests charging changes with reasons.
Approved changes
Selected changes are proposed inside strict limits.
Most plants stay at display and advice for a long time. To plan your path, ask our team about charging control options.
Data sourcesBring Charging, Gas and Cooling Data Together
Charging and profile dataTop gas and pressure dataWall and cooling data
Burden distribution model
Charging recommendationsGas flow estimatesShift and engineering reports
Who is involvedDistribution Is a Team Decision
Charging engineers
We design and test charging matrices.
Operators
We watch signals and give feedback on changes.
Raw materials team
We supply quality data and flag changes.
Plant leaders
We track fuel rate and stability results.
A short weekly review of charging changes and results helps build shared understanding.
What improvement looks likeBefore and After a Distribution Programme
Track gas utilisation, stability and fuel rate. This view is illustrative.
Experience and trial
Gas utilisation variation
Events caused by distribution changes
Time to settle after a change
Model-supported
Gas utilisation variation
Events caused by distribution changes
Time to settle after a change
RolloutFive Steps From Data Check to Daily Use
1
Check the data
Verify profile, gas and wall measurements.
2
Build the link
Relate charging patterns to gas and permeability outcomes.
3
Back-test
Compare model estimates with past changes.
4
Advise beside engineers
Show suggestions without acting on them.
5
Adopt step by step
Use the model in charging decisions and review monthly.
Profile and gas measurements verified
Charging matrices recorded and version controlled
Raw material changes logged with dates
Model back-tested on past charging changes
Limits agreed with process engineers
Advisory mode run with feedback
Transition checklist in place
Owner from charging, operations and process
After a charging changeSix Things to Watch in the Hours That Follow
A change in charging is an experiment. Good records of what happens next make the next experiment better.
Top gas temperature profile
Shows early shifts in gas distribution.
Pressure drop and permeability
Show whether the burden is easier or harder to pass.
Gas utilisation
Shows efficiency changes.
Wall and stave temperatures
Show peripheral flow changes.
Hot metal temperature and silicon
Show thermal state, later in the cycle.
Operator observations
Flag anything the signals do not capture.
Record these items against each change. Over months they become the learning data that makes a model useful.
Measuring permeabilityA Simple Index and an Example
Plants measure overall permeability in different ways. A simple version relates blast volume to the pressure difference across the furnace.
Permeability index = blast volume / pressure difference across the furnace
Higher
Gas passes more freely
Lower
Resistance is rising
Trend
More useful than a single value
Context
Compare at similar blast and burden
Definitions differ between plants. Use your own established index and track its trend, not only its level.
How fast effects appearDifferent Signals Respond on Different Timescales
Charging changes work through the furnace in stages. This chart is illustrative.
Minutes
Surface and top gas signals
Hours
Pressure and wall signals
Many hours
Thermal state and silicon
Days
Fuel rate and stability trends
Patience matters. Making another change before the first has worked through can confuse cause and effect.
Change controlFour Habits for Safe Charging Changes
Plan
State what you expect to happen and what limits apply.
Change one thing
Alter one main variable at a time where possible.
Observe
Watch the agreed signals over the expected time.
Record and review
Write down what happened and update the model and practice.
A disciplined log of changes and results is the foundation for any model-supported distribution programme.
MaturityMove From Experience to Model-Supported Charging
Level 1: ExperienceCharging set by habit and shift knowledge
Level 2: RecordsChanges and results logged consistently
Level 3: EstimatesModels estimate layers and gas flow
Level 4: GuidedAdvice linked to measured results and strict limits
Each level adds evidence and consistency. To place your furnace, discuss a charging maturity check with our team.
Common pitfallsFive Mistakes That Undermine Burden Distribution Work
Most disappointing results trace back to the same handful of habits.
1
Changing several things at once
Cause and effect become impossible to separate.
2
Poor record keeping
Changes and results are not logged, so nothing can be learned.
3
Ignoring raw material changes
A pattern that worked last month may not work with new material.
4
Trusting one signal
A single reading can mislead without the wider picture.
5
Skipping operator feedback
People at the furnace notice things the data does not show.
Avoiding these habits costs nothing and often delivers more than any new tool.
Expert reviewWhat a Blast Furnace Charging Specialist Would Check First
Distribution models are only as good as their measurements. Good profile data, reliable gas readings and disciplined records of every charging change come before any optimisation.
Verdict
Strong when charging history is recorded and the model is back-tested.
Watch for
Charging changes made without logging, which breaks the learning loop.
Do next
Record every charging change with its result for three months before building a model.
Frequently asked questionsWhat Steel Plants Ask About Burden Distribution Optimisation
Can a model really predict gas flow inside the furnace?
It can estimate it, using charging data, profile measurements and gas and pressure signals, and improve by learning from the furnace's own history. Estimates are not perfect, so they should be checked against reality continuously.
See how estimates are validated.
How quickly do charging changes show their effect?
Some effects, such as pressure or top temperature, appear within hours, while changes in thermal state and coke rate can take longer. Models help by predicting which effects will appear and when.
Ask about response times.
What data matters most?
Reliable charging records, burden profile or stockline data, top gas temperature and pressure signals, and wall and cooling data. Time alignment and clear logging of changes are essential.
Check your data readiness.
Will optimisation change our charging practice completely?
Not necessarily. Many plants use the model to refine what experienced engineers already do, testing ideas on paper before trying them in the furnace.
Ask about adoption.
How do we manage transitions?
Plan them with a checklist covering raw material changes, coke quality and production rate, and adjust charging in step. Use the model to estimate effects before the change and check afterwards.
Plan a transition process.
Better layers, steadier furnace
Plan Every Charge With a Clearer View of Gas Flow
Book a session with iFactory AI to review your charging data and see how a burden distribution model could help your team keep the furnace stable and fuel use low.