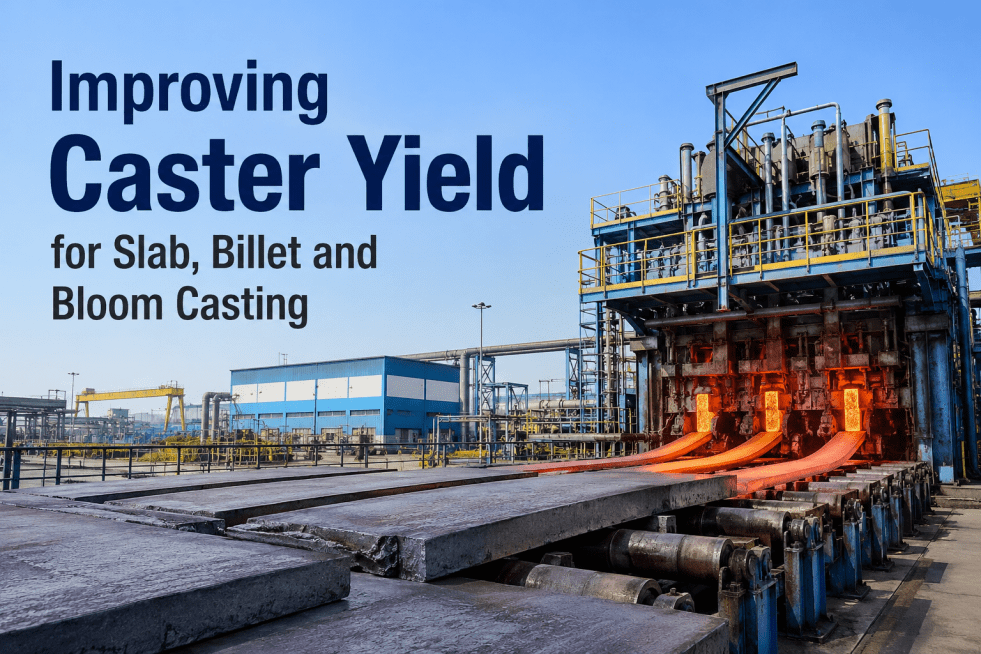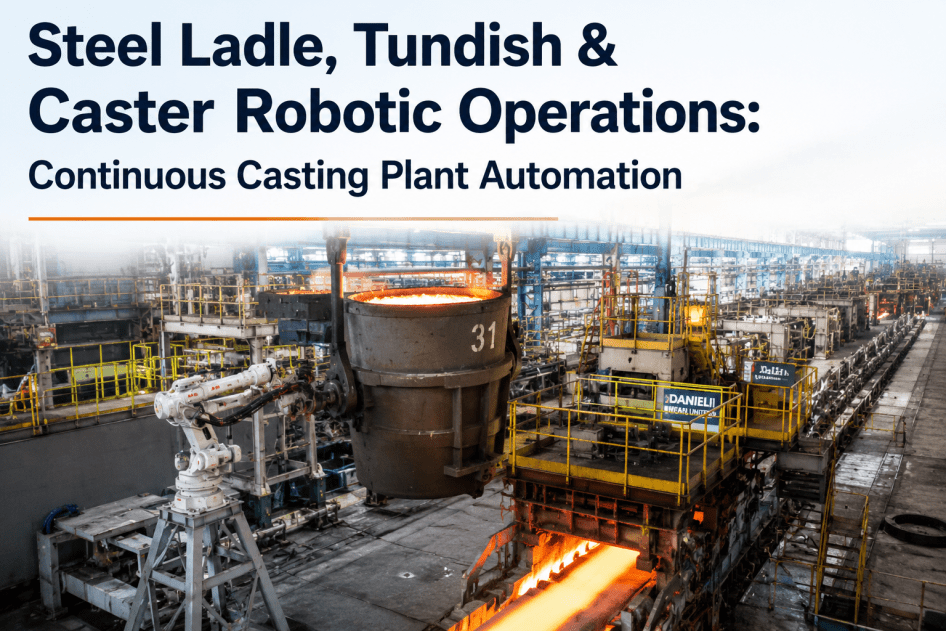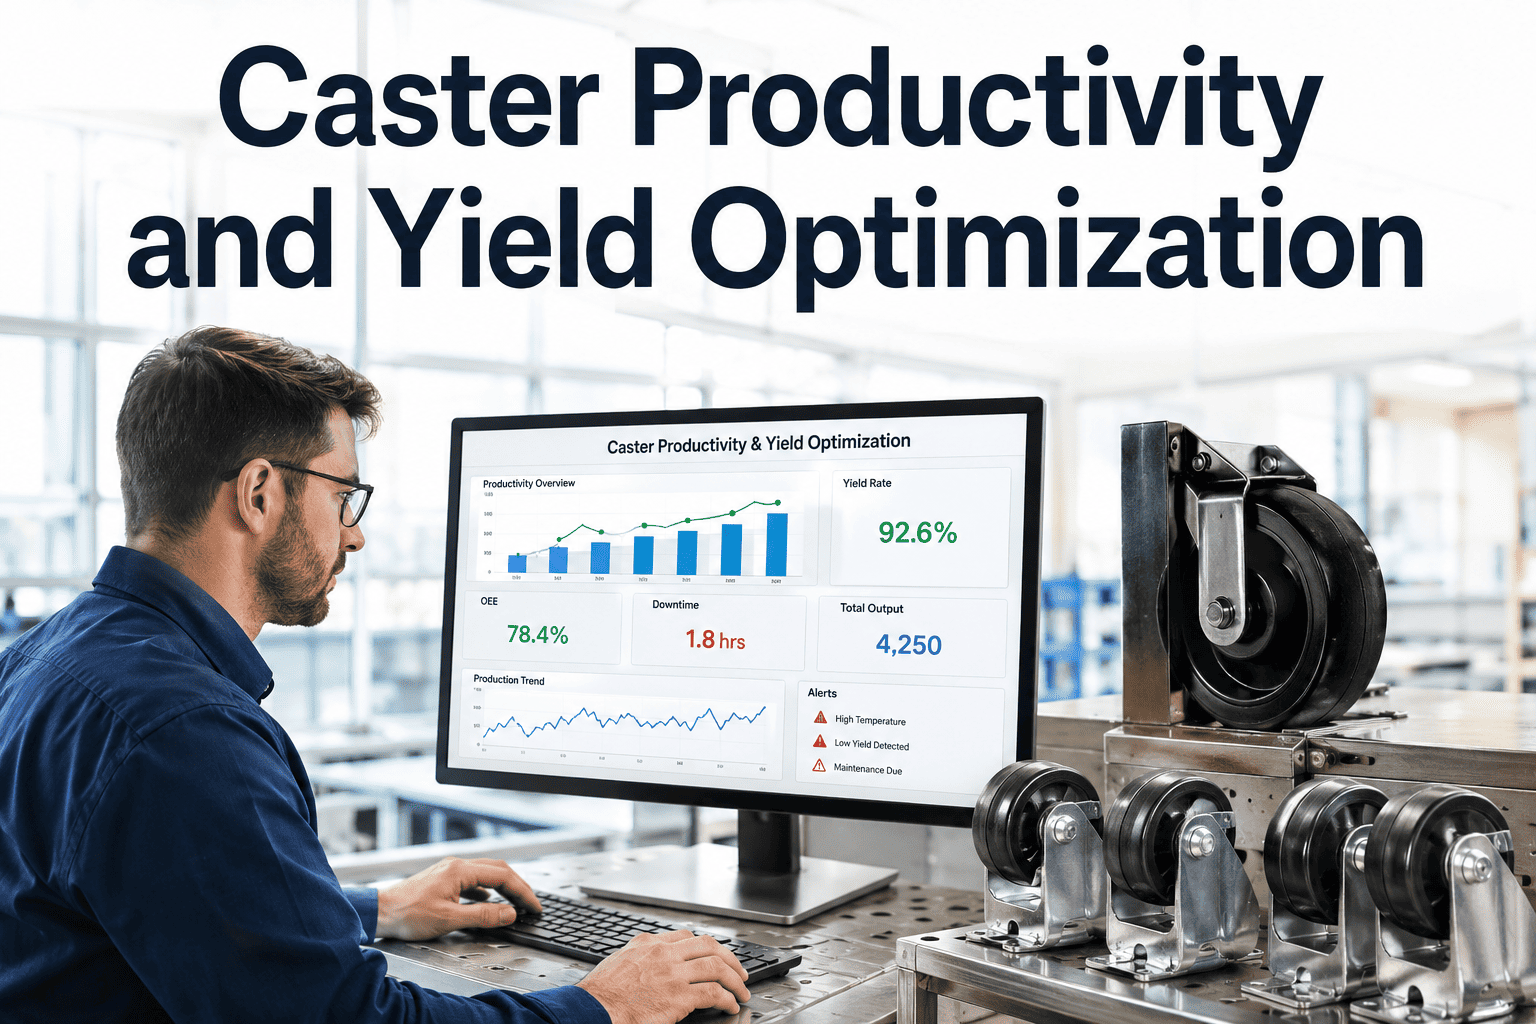
Yield is the single line item on a caster's report that plant managers watch most closely, because a fraction of a percent moves more profit than almost any other operational metric on the floor. Good tonnage divided by liquid steel tonnage sounds like a simple ratio, but the losses that erode it come from at least four different places, crop loss at the strand ends, scarfing depth decisions, cut length optimization, and internal quality downgrades discovered after the fact, and most casters manage each of those decisions separately, with separate rules of thumb, none of them talking to each other. iFactory's caster yield module was built to unify those four decisions into one system instead of four disconnected habits.
Caster yield is decided in four separate places. Most plants never connect them.
iFactory unifies crop prediction, scarfing depth, cut optimization, and quality routing into one yield engine, lifting good-tonnage output without changing your casting equipment.
Four decisions, four separate rules of thumb
Ask four different roles at a caster how yield decisions get made, and you'll typically get four different answers, because crop loss, scarfing, cut optimization, and quality grading are usually owned by different people using different fixed practices that were never designed to work together.
Crop loss at strand ends
Head and tail crop is typically cut to a fixed length by grade, regardless of how much of that section actually carries defective steel versus usable material being discarded unnecessarily.
Scarfing depth
Surface conditioning depth is often set conservatively to guarantee defect removal, grinding away more good steel than the actual surface defect depth requires.
Cut length optimization
Strand sections are cut to standard lengths without accounting for order book mix, sometimes producing offcuts that don't match any current order and become lower-value inventory.
Internal quality routing
Quality grade is assigned per heat from statistical sampling rather than section by section, meaning good sections of an otherwise-downgraded heat get pulled down with it.
None of these four practices is unreasonable on its own. Fixed crop lengths and conservative scarfing depths exist because internal defects genuinely can't be seen from the surface, and statistical grade sampling exists because inspecting every meter of every strand isn't practical with manual methods. The opportunity isn't in abandoning caution, it's in replacing blanket conservatism with section-specific prediction, so the caution only gets applied where the data actually shows it's needed.
Relative size of each yield loss category
Internal quality downgrades typically represent the largest single category because they're detected latest, after the strand is cut, cooled, and inspected, when the only remaining options are downgrade or scrap. Catching quality issues earlier, and routing individual sections rather than whole heats, is where the biggest single opportunity usually sits.
Fixed-Rule Yield Management
- Crop length set by grade, not by actual defect extent per heat
- Scarfing depth set conservatively to guarantee coverage
- Cut lengths standardized regardless of current order mix
- Quality grade assigned per heat from statistical sampling
- Yield loss categories tracked separately, rarely analyzed together
iFactory Unified Yield Engine
- Crop prediction estimates actual defect extent from solidification data
- Scarfing depth recommended per section based on predicted defect depth
- Cut optimization matches strand output against live order requirements
- Quality routing scores sections individually, not the whole heat
- All four decisions visible together against total yield performance
One bad section shouldn't downgrade an entire heat
Internal quality defects, centerline segregation, internal cracks, and porosity, develop during solidification and are only confirmed after the strand is cut, cooled, and inspected, which forces most casters into a defensive posture: if statistical sampling on a heat shows a quality problem anywhere, the whole heat gets treated as suspect. That's a reasonable response to limited information, but it also means perfectly good sections routinely get downgraded alongside genuinely defective ones simply because they happened to come from the same heat.
Predicting internal quality distribution along the strand, from solidification model outputs, casting parameters, and steel chemistry, changes that calculus. Instead of a single grade decision per heat, sections can be routed individually to the highest-value grade each one actually qualifies for, which recovers tonnage that a heat-level sampling approach would otherwise sacrifice by default. This is frequently the largest single yield gain available in a caster yield project, precisely because it's the category most plants have never had the tooling to address section by section.
The same underlying prediction also improves crop and scarf decisions, since knowing where along the strand a defect is concentrated, rather than assuming it could be anywhere, lets both those cuts become more targeted and less blanket-conservative.
There's a practical constraint worth naming directly: section-level routing only works if the plant's downstream systems, order management, inventory tracking, and shipping documentation, can actually handle output at that granularity. Some plants find this requires a modest workflow adjustment beyond the yield model itself, tagging and tracking sections individually rather than treating a full cast heat as a single inventory unit. This is usually a smaller lift than it sounds, since most modern caster tracking systems already assign unique identifiers at the section level for traceability purposes, and the yield project simply makes fuller use of data that's frequently already being captured but not yet acted on.
Most plant managers can quote their overall caster yield percentage but can't break it down by crop, scarf, cut, or quality loss. Book a walkthrough and we'll build that breakdown from your own production data.
Four models, one yield decision per strand
Predict internal quality distribution
Solidification model outputs, casting parameters, and chemistry are combined to estimate defect likelihood along the full strand length.
Recommend crop length
Head and tail crop is sized to the actual predicted defect extent for that heat, rather than a fixed grade-level default.
Recommend scarfing depth
Surface conditioning depth is matched to predicted surface defect depth per section instead of a blanket conservative setting.
Optimize cut lengths
Strand sections are cut to match current order requirements, reducing offcuts that don't correspond to any live order.
Route each section to grade
Individual sections are assigned to the highest-value quality grade they actually qualify for, rather than the whole heat's default grade.
Confirm against inspection results
Final inspection outcomes are matched back to predictions, continuously sharpening accuracy for your caster and grade mix.
Inputs feeding the yield engine
| Data source | Feeds which decision | Already available at most casters |
|---|---|---|
| Caster PLC and casting parameters | Crop prediction, quality routing | Yes, standard control system data |
| Mold monitoring and thermocouple data | Quality routing, crop prediction | Yes, if mold instrumentation is installed |
| Steel chemistry and grade specification | Quality routing, cut optimization | Yes, from ladle metallurgy records |
| Order book and current demand mix | Cut length optimization | Usually, from production planning systems |
| Quality inspection station results | Model calibration and continuous improvement | Yes, from existing inspection workflow |
See what a 0.5% yield gain is worth on your tonnage
We'll walk through your production volume and current yield breakdown to size the opportunity specifically for your caster.
Yield is one of the few levers with no offsetting cost
Most cost-reduction initiatives at a steel plant involve some kind of trade-off, spending capital to save on energy, adding process steps to reduce alloy consumption, slowing production to improve quality consistency. Yield improvement from better crop, scarf, cut, and grading decisions is unusual in that it doesn't require slowing the caster, adding equipment, or accepting a quality trade-off. It simply recovers tonnage that was already being produced and then discarded or downgraded unnecessarily, which is part of why caster yield tends to be one of the more attractive first AI projects for plant managers evaluating where to start.
There's also a compounding effect worth noting. Because yield losses are measured as a percentage of liquid steel tonnage, the absolute dollar value scales directly with production volume, and a caster running near capacity captures the return on a yield improvement faster than one running below capacity. For plants operating at or near their production ceiling, a caster yield project is frequently one of the highest-return initiatives available, since there's no practical way to increase output further except by capturing more good tonnage from the steel already being cast.
Finally, better section-level quality routing produces a useful side benefit for sales and order fulfillment. When more sections can be confidently routed to higher-value grades instead of defaulting to conservative downgrades, plants often find they can fulfill premium-grade orders from production runs that would previously have required a separate, dedicated heat, adding scheduling flexibility that doesn't show up directly in the yield percentage but matters just as much operationally.
Benchmarking yield performance across shifts and crews is another underused benefit once the four decisions are unified into one system. When crop, scarf, cut, and grade decisions are tracked together against a common prediction baseline, differences in operator practice that were previously invisible, one crew running noticeably more conservative crop lengths than another, for instance, become visible in the data. This isn't primarily a performance-management tool, but it does give operations leadership an evidence-based way to identify which practices are actually driving the best yield outcomes and standardize toward those, rather than relying on which crew happens to be more cautious by habit.
What a yield optimization pilot involves
No new casting equipment
The yield engine works with your existing caster, cutting, and scarfing equipment, focused on the decisions made around them.
Connects to existing systems
Reads from caster PLC, mold monitoring, chemistry records, and order planning systems already in use.
Historical calibration first
Model is built on past heat and inspection records before any live recommendations are made.
Grade-by-grade rollout
Starts with your highest-volume or highest-loss grade family and expands from there.
Shadow mode validation
Recommendations are logged and compared against actual outcomes before operators act on them directly.
24x7 managed service
iFactory's team monitors model performance and yield trends so your operations team isn't managing software on top of the caster.
Caster yield optimization, explained plainly
Find the yield your caster is already leaving on the floor
iFactory unifies crop, scarf, cut, and quality routing decisions into one engine. Book a demo and we'll size the opportunity using your own production data.