EAF Transformer, Electrode Arm & Power System — AI Electrical Diagnostics & Protection

By James Smith on July 29, 2026

eaf-transformer-electrode-arm-power-system-ai

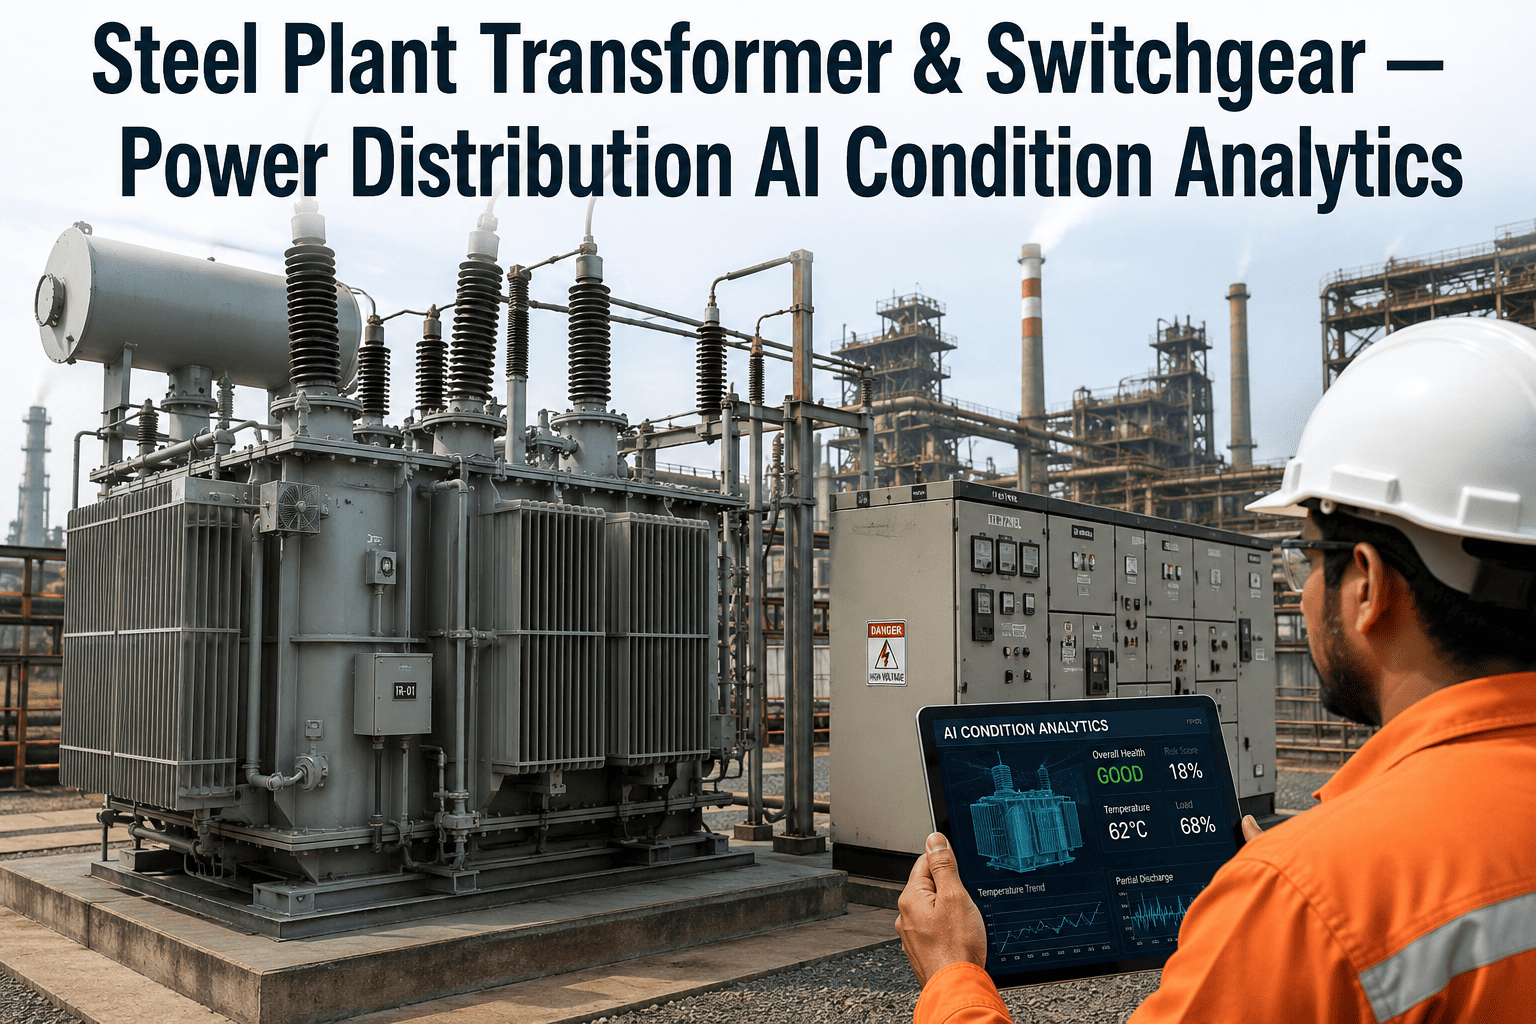
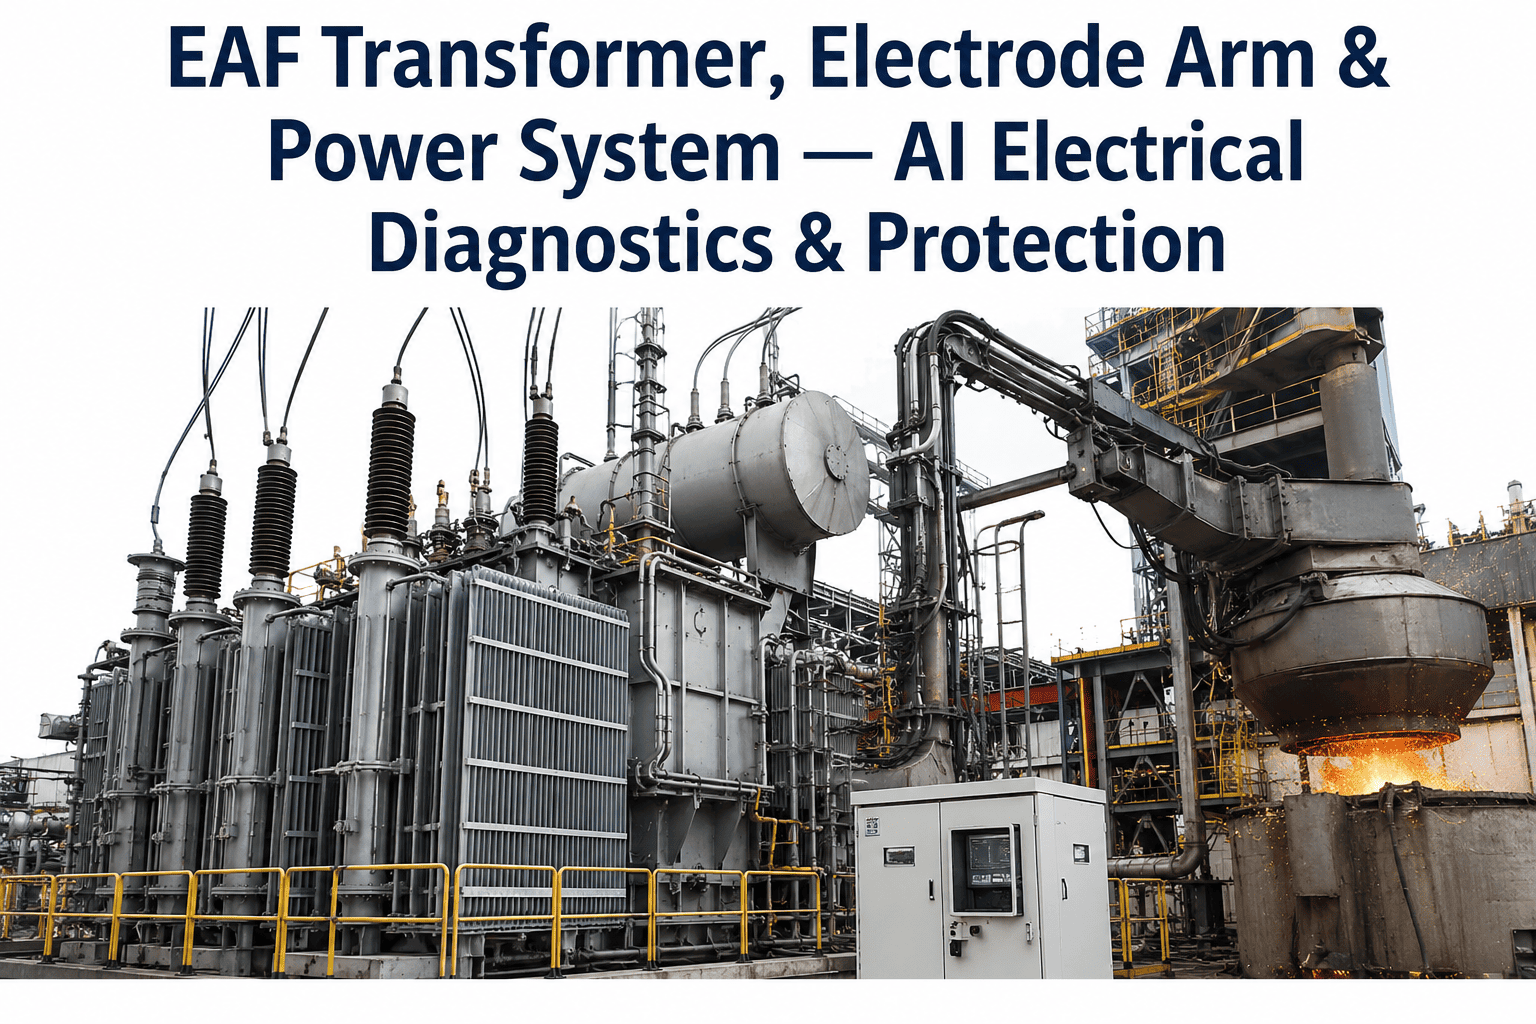
The electrical system feeding an electric arc furnace delivers some of the highest power densities found anywhere in industrial manufacturing, routing tens of megawatts through a transformer, busbar network, and electrode arm assembly that must withstand constant arcing, thermal cycling, and mechanical vibration heat after heat. Reliability engineers responsible for this system know that a transformer fault or electrode arm hydraulic failure does not just cause a maintenance headache, it can halt melting entirely for hours or days, and the early warning signs are often buried inside vibration data, oil analysis trends, and hydraulic pressure logs that few teams have time to review continuously. AI-powered electrical diagnostics from iFactory continuously tracks the condition of every major electrical and mechanical component in the power delivery chain.

Transformer Health Electrode Arm Hydraulics Busbar Condition

EAF Electrical System Diagnostics: AI Monitoring for Transformer, Electrode Arm, and Power Delivery

iFactory continuously analyzes transformer oil condition, vibration signatures, electrode arm hydraulic pressure, and busbar thermal data to flag developing electrical faults before they cause an unplanned melt shop outage.

$50K-$500K Typical cost of an hour of unplanned EAF downtime including lost production
30-50MW Typical power delivery through a mid-size EAF transformer during melting
2-6 Weeks Advance warning window AI diagnostics typically provide ahead of major electrical faults

Component-Level Risk Across the Power Delivery Chain

Each component in the EAF electrical system fails in a different way and on a different timescale, which means reliability engineers need dedicated detection models rather than a single generic vibration alarm covering the entire system. A transformer developing an insulation issue looks nothing like an electrode arm hydraulic seal beginning to leak, and treating them the same way in a monitoring program leaves gaps in exactly the components that cause the most costly failures.

Furnace Transformer
Oil condition, dissolved gas trends, winding temperature, and load cycling patterns tracked continuously to flag developing insulation or cooling system issues.
Electrode Arm Hydraulics
Hydraulic pressure, cylinder response time, and seal condition monitored across each electrode arm to catch developing leaks or regulation drift before arc control degrades.
Busbar and Flexible Cables
Thermal imaging data and connection point temperature trends tracked to identify loosening connections or conductor degradation before a hot spot becomes a failure.
Electrode Regulation System
Arc stability and electrode positioning response tracked against control system commands to detect regulation drift affecting melting efficiency and power factor.

How Electrical Faults Cascade Toward an Unplanned Outage

1
Component Stress Begins — Normal wear or a developing manufacturing defect starts producing subtle deviations in oil chemistry, vibration signature, or thermal pattern.
2
Deviation Trend Emerges — The affected parameter begins trending away from its established baseline, still within normal operating range but no longer stable.
3
Performance Impact Appears — Arc stability, power factor, or cooling efficiency begins to show measurable impact, though often not yet significant enough for operators to flag as a concern.
4
Failure Threshold Reached — The component crosses a critical threshold, triggering a protective trip or outright failure that halts melting until repair or replacement is completed.
See Your Furnace Electrical System's Real-Time Health Score

iFactory connects to existing transformer monitoring, hydraulic sensors, and thermal imaging systems to build a continuous condition score for every major electrical component, giving reliability engineers weeks of advance warning instead of a reactive failure response.

Reactive Maintenance vs AI Continuous Electrical Diagnostics

Scroll to compare approaches
Reliability Task Reactive / Periodic Maintenance iFactory AI Continuous Diagnostics
Transformer Oil Analysis Sampled periodically, often monthly or quarterly, missing faster-developing issues Dissolved gas and oil condition trends tracked continuously between and alongside lab samples
Electrode Arm Hydraulic Monitoring Pressure checked during scheduled maintenance rounds, leaving gaps between inspections Hydraulic pressure and response time monitored continuously across every arm in real time
Busbar Hot Spot Detection Thermal imaging performed during periodic inspection walks, typically monthly at most facilities Connection temperature trends tracked continuously, flagging developing hot spots between inspections
Failure Root Cause Clarity Root cause investigation begins after failure, relying on post-incident data review Pre-failure trend data available immediately, accelerating root cause analysis and repair planning

Before and After Continuous Electrical Diagnostics

Before AI Diagnostics
Transformer condition assessed through periodic oil sampling with gaps between lab results
Electrode arm hydraulic issues often discovered as unplanned pressure loss during active melting
Busbar hot spots found during scheduled thermal imaging walks, sometimes after significant degradation
After iFactory AI Diagnostics
Transformer condition tracked continuously between and alongside scheduled oil sampling
Hydraulic pressure drift flagged weeks before it would cause an operational interruption
Busbar connection temperature monitored continuously, catching hot spots early in their development

Expert Perspective

Electrical failures on an EAF have always felt sudden even when, in hindsight, the warning signs were there in the data the whole time — we just were not looking at the right parameters continuously enough to catch them. What changed with continuous diagnostics was catching a busbar connection trending toward a hot spot nearly three weeks before it would have tripped during an active heat, which let us schedule the repair during a planned outage window instead of losing melting time unexpectedly. For a reliability engineer, that shift from reactive investigation to proactive planning is really the whole value proposition.
— Reliability Engineer, EAF Steel Mill · Electrical Systems and Power Delivery

Frequently Asked Questions

Q: Does iFactory require new sensors on the transformer and electrode arm system?
Most EAF electrical systems already carry transformer monitoring, hydraulic pressure sensors, and some form of thermal imaging as part of standard operational and safety practice, and iFactory connects to this existing instrumentation rather than requiring a full new sensor installation. Where coverage gaps exist, the deployment assessment identifies them and recommends targeted additions. Book a Demo to review your current instrumentation.
Q: How does the AI model distinguish normal operational variation from an actual developing fault?
The model is calibrated against your specific furnace's historical operating data across a range of melting conditions, load cycles, and maintenance history, allowing it to learn what normal variation looks like for your equipment specifically before flagging genuine deviations. This calibration period is an important part of why accuracy improves over the first several weeks of deployment.
Q: Can this replace scheduled transformer oil sampling and thermal imaging inspections?
The platform is designed to complement rather than replace these established maintenance practices, using continuous data to fill the gaps between scheduled inspections and to validate trends against lab results as they come in. Most reliability teams continue their existing inspection schedule alongside the continuous monitoring for added confidence.
Q: How are alerts prioritized so reliability teams are not overwhelmed with notifications?
Alerts are ranked by severity and estimated time to potential failure, giving reliability engineers a clear sense of what needs immediate attention versus what can be scheduled into upcoming planned maintenance windows. Contact our team to discuss alert configuration for your specific maintenance workflow.
Q: What is the typical timeline to see reliable predictive alerts after deployment?
Most facilities see the model producing reliable alerts within four to six weeks of deployment, with confidence continuing to build over the following months as the system observes a fuller range of operating conditions and validates its predictions against actual maintenance findings.
Protect Your Furnace Power Delivery System with Continuous AI Diagnostics

iFactory gives reliability engineers weeks of advance warning on transformer, electrode arm, and busbar condition, replacing reactive electrical failure response with planned, data-driven maintenance.


Share This Story, Choose Your Platform!