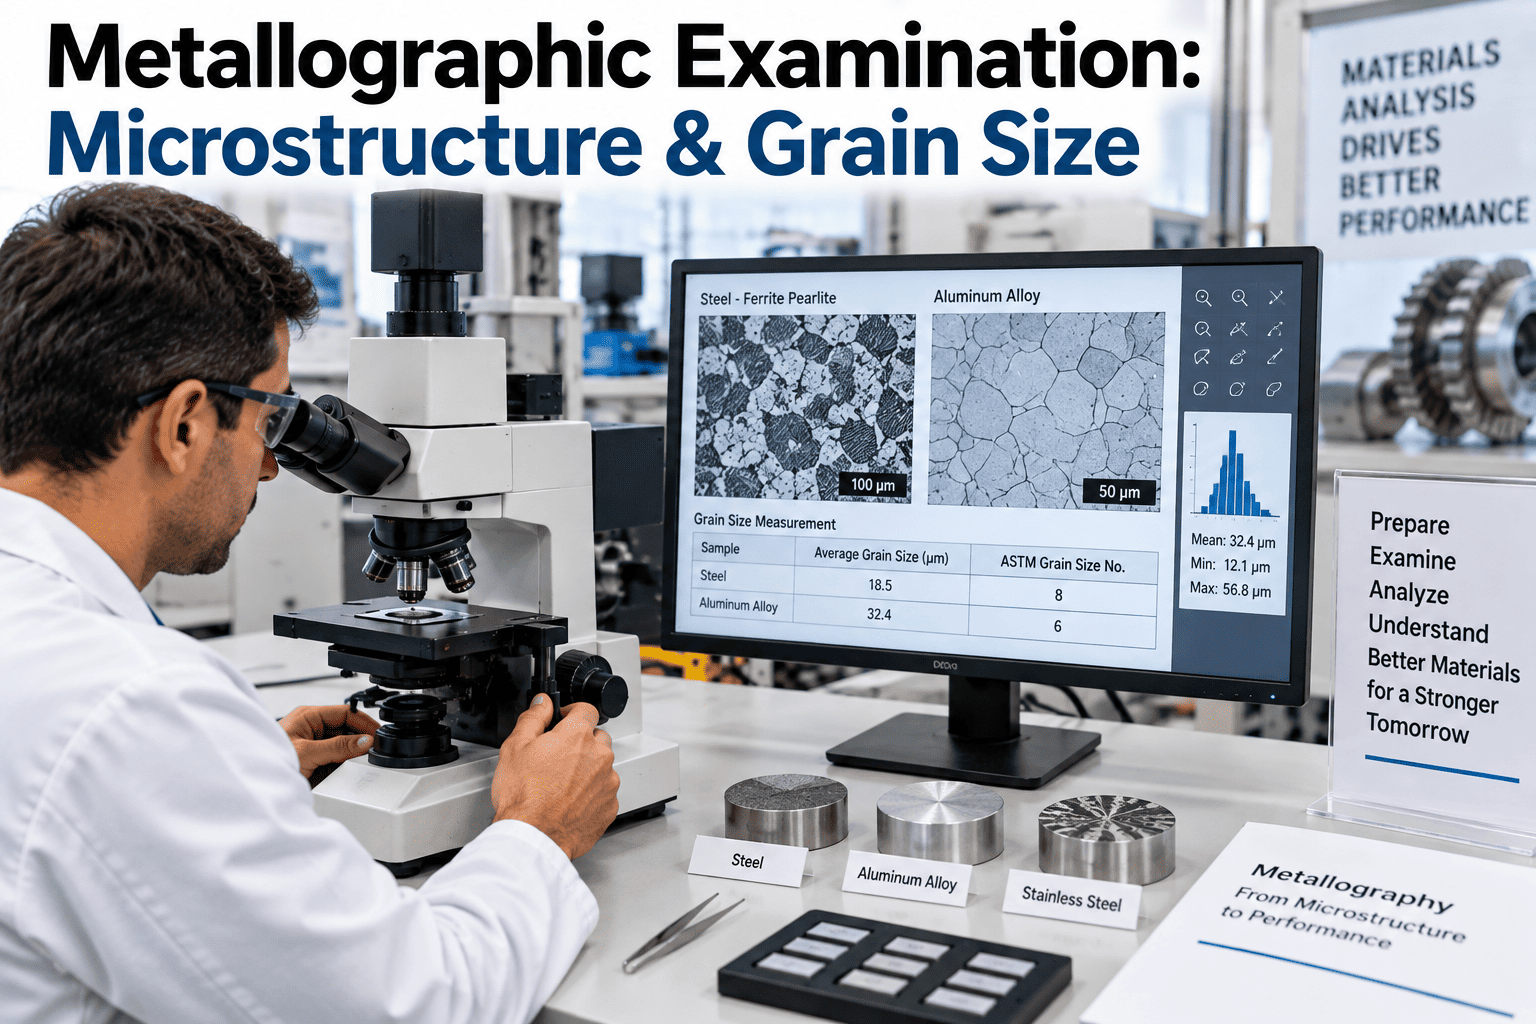
A steel sample can pass every chemical composition and mechanical property test and still hide a microstructural problem — an unexpected phase, an oversized grain, or an inclusion pattern — that only becomes visible once a polished, etched section is put under a microscope. Metallographic examination is where quality teams go to answer the question no other test can: what does the actual internal structure of this material look like, and does it match what the process was supposed to produce. Getting from a raw sample to a reliable microstructural answer depends on sample preparation quality just as much as microscope skill, and labs tightening this workflow can start with a conversation with iFactory's support team about connecting metallographic findings into the same quality record as chemical and mechanical test data.
What Composition and Strength Tests Can't See, the Microscope Reveals
Grain size, phase distribution, and inclusion content are invisible to every other test in the lab. Getting a reliable answer depends on preparation quality as much as the microscope itself.
Why Sample Preparation Determines the Answer
A microstructure examination is only as good as the surface prepared to reveal it, and errors introduced during cutting, mounting, or polishing can create artifacts that look like genuine microstructural features to an inexperienced eye. Excessive heat during cutting can alter the very microstructure being examined, improper polishing can smear soft phases across the surface, and inconsistent etching can either under-reveal or over-reveal grain boundaries, each of which can lead to a misread result if the preparation quality is not verified before analysis begins.
The Preparation Sequence, Stage by Stage
Each stage of sample preparation has to be executed correctly before the next one can produce a meaningful result, and a shortcut taken early in the sequence usually cannot be corrected later.
Sectioning
The sample is cut using a method that minimizes heat generation and mechanical deformation, since either can alter the microstructure right at the surface being examined before analysis even begins.
Mounting
The sample is embedded in a resin mount for stability and ease of handling during subsequent polishing steps, particularly important for small or irregularly shaped samples.
Grinding and Polishing
Progressive grinding and polishing removes surface damage from sectioning and brings the sample to a mirror finish, with inconsistent technique at this stage being the single most common source of preparation artifacts.
Etching
A chemical etchant selectively attacks the polished surface to reveal grain boundaries and phase structure, and etch time and reagent choice both need to match the specific steel grade being examined.
Keep Microstructure Findings in the Same Record as Every Other Test
Book a 30-minute walkthrough of how iFactory connects metallographic findings to chemical and mechanical test data on the same heat.
What a Metallographic Examination Can Reveal
Different examinations target different questions, and the table below outlines what each common type of metallographic check is actually looking for.
| Examination Type | What It Reveals | Typical Trigger |
|---|---|---|
| Grain Size Measurement | Average grain diameter against a standard rating scale | Routine grade qualification and heat treatment verification |
| Phase Identification | Presence and distribution of ferrite, pearlite, martensite, and other phases | Heat treatment process validation and property prediction |
| Inclusion Rating | Type, size, and distribution of non-metallic inclusions | Cleanliness verification for fatigue-critical applications |
| Fracture Path Analysis | Whether a crack propagated inter-granularly or trans-granularly | Failure investigation following an in-service component failure |
A Composite Scenario: The Grain Size That Explained an Intermittent Property Failure
A forging producer experienced intermittent failures of finished parts to meet impact toughness requirements despite chemical composition and standard tensile properties consistently passing specification. The intermittent nature of the failures made root cause difficult to pin down, since reheating and quenching parameters logged for the affected heats appeared identical to those for heats that passed without issue.
Metallographic examination of both passing and failing samples revealed the actual difference: failing samples showed a noticeably coarser grain structure than passing ones, despite nominally identical heat treatment parameters, tracing back to inconsistent soak time in the reheat furnace caused by uneven furnace loading during busier production periods. Tightening furnace loading procedures to ensure consistent soak time across all positions in the furnace eliminated the coarse-grain condition and resolved the intermittent toughness failures without any change to the nominal heat treatment recipe itself.
Mistakes That Undermine Metallographic Analysis
Rushing Sample Preparation to Meet a Turnaround Deadline
Shortcuts in grinding and polishing time introduce surface artifacts that can be misread as genuine microstructural features, undermining the reliability of the examination under time pressure.
Using a Generic Etchant Regardless of Steel Grade
Different steel grades and phase structures respond differently to etching reagents, and a mismatched etchant can under-reveal or over-etch the features an examination is meant to characterize.
Relying on a Single Field of View for a Rating
Grain size and inclusion ratings drawn from a single, potentially unrepresentative field of view can miss the true variability present across the sample, skewing the reported result.
Treating Metallography as Disconnected From Process Data
A microstructural finding examined in isolation from the actual process parameters that produced it, as in the furnace loading scenario above, makes root cause investigation far slower than it needs to be.
Is Your Metallographic Lab Producing Reliable Results
Preparation time is protected even under turnaround pressure
A documented minimum preparation standard, held even when a rush request comes in, prevents the kind of preparation shortcut that produces misleading surface artifacts.
Etchant selection is documented per grade, not left to individual judgement
A documented etchant and etch time standard per steel grade removes variability between technicians and keeps results comparable across different operators and shifts.
Ratings are drawn from multiple representative fields of view
Multiple fields of view, rather than a single convenient one, give a rating that actually reflects the sample's true variability rather than one potentially unrepresentative area.
Metallographic findings are linked back to process parameters
Connecting a microstructural finding to the specific furnace, quench, or rolling parameters that produced it is what turned the grain size scenario above from a mystery into a solved root cause.
Frequently Asked Questions
Why can grain size affect mechanical properties even when chemistry and hardness are normal?
Grain boundaries act as barriers to dislocation movement, and a finer grain structure generally provides higher strength and improved toughness compared to a coarser structure of the same chemical composition, which is why two samples with identical chemistry and even similar hardness readings can behave very differently under impact loading if their grain size differs significantly. This relationship is exactly what explained the intermittent toughness failures in the scenario above, where composition and tensile data alone gave no indication of the underlying problem.
How is grain size actually measured and reported?
Grain size is typically measured against a standardized rating scale, such as the ASTM grain size number system, using either a comparison chart method against reference images or a direct intercept counting method on the etched and photographed microstructure. The choice of method should be documented consistently, since switching methods between comparisons can introduce apparent differences that reflect a change in measurement approach rather than an actual change in the material.
What causes preparation artifacts to be mistaken for real microstructural features?
Excessive heat during cutting can locally alter the microstructure right at the examined surface, aggressive polishing can smear softer phases across harder ones creating a false appearance of a different phase distribution, and inconsistent etching can create false boundaries or obscure real ones, all of which can mislead an inexperienced or rushed examiner into reporting a feature that does not actually reflect the bulk material condition. This is why preparation quality verification, often through examining the sample before and after each preparation stage, is considered as important as the final microscopy step itself.
When is metallographic examination used in failure analysis?
Metallographic examination is typically used in failure analysis when the fracture surface alone does not reveal a clear root cause, or when the investigation needs to determine whether a crack propagated along grain boundaries or through the grains themselves, a distinction that often points toward very different underlying causes such as hydrogen embrittlement, temper embrittlement, or fatigue. Comparing the microstructure of a failed component against a known-good reference sample from the same grade and heat treatment is usually the most direct path to identifying what went wrong. Book a demo to see how iFactory helps organize this kind of comparative failure analysis data.
How can a lab reduce variability in metallographic results between different technicians?
Standardizing preparation procedures, etchant selection, and measurement methodology across all technicians, combined with periodic cross-checks where multiple technicians examine the same sample independently, is the most reliable way to identify and reduce inter-technician variability before it affects a real quality decision. Documenting these standards in enough detail that a new technician can follow them without relying on informal, person-to-person knowledge transfer is what makes the standardization durable as staff change over time. Labs building out this kind of standardized workflow can reach iFactory support for guidance.
Connect Microstructure Findings to the Rest of Your Quality Record
iFactory links metallographic findings to chemical composition, mechanical test data, and process parameters on the same heat, so root cause investigations move faster. Book a walkthrough to see it running on a live quality lab.