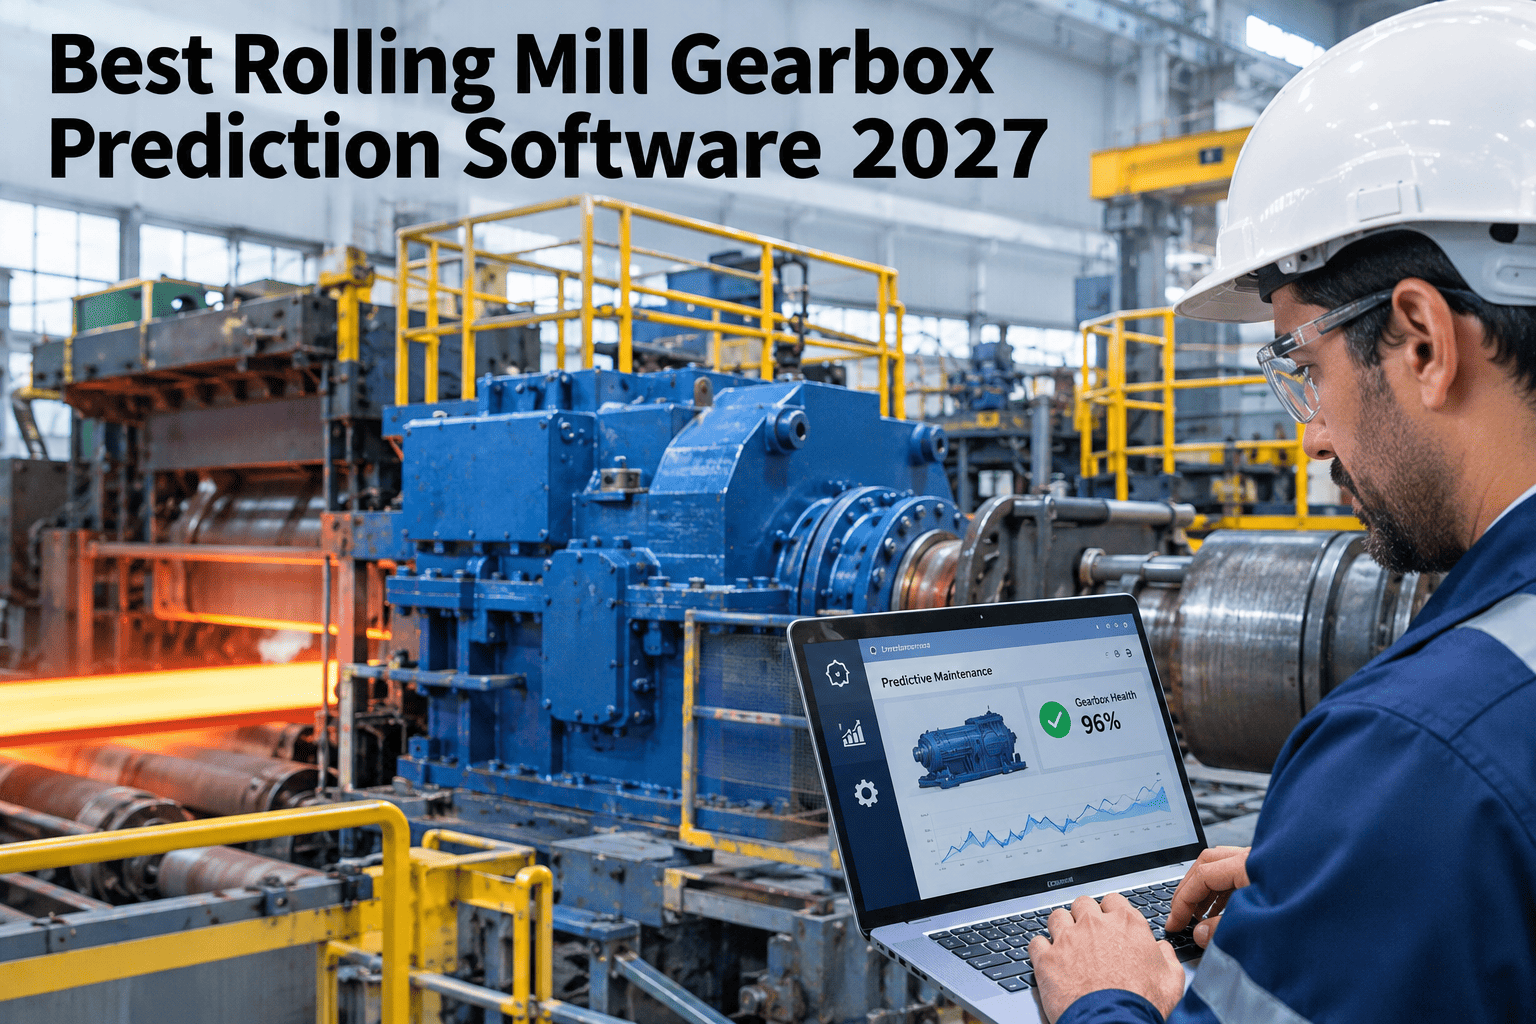
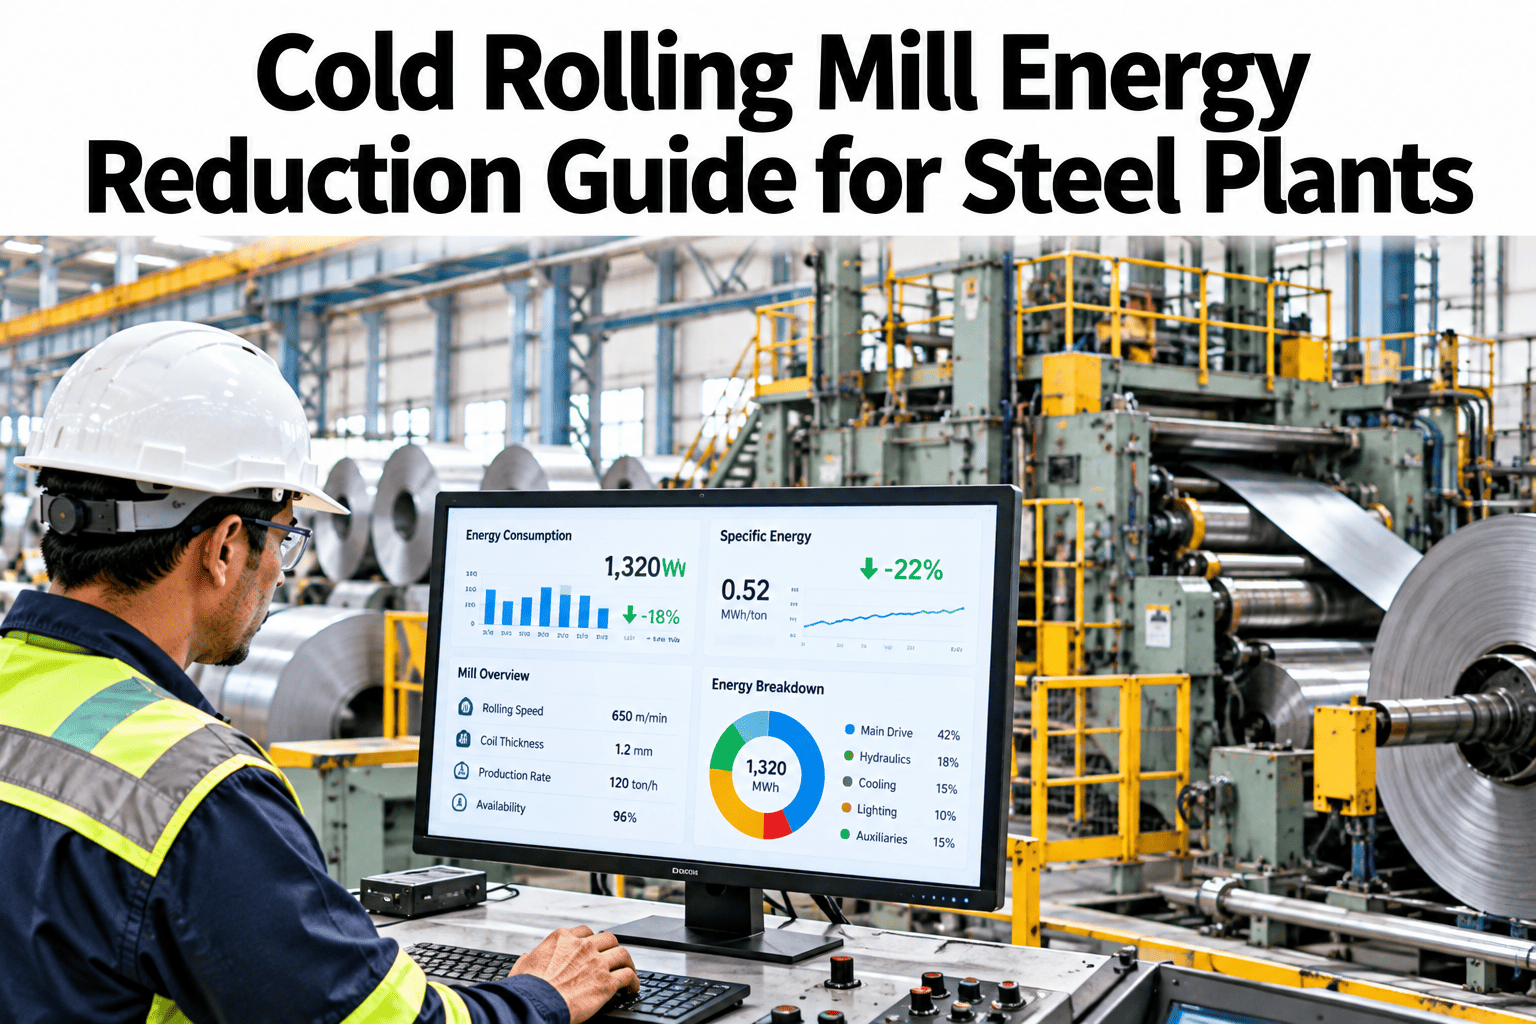
Work-roll bearings, back-up roll bearings and chock bearings all carry enormous radial loads under constant rolling force, and when one starts to fail, the early signs show up in the vibration spectrum weeks before they show up as noise, heat or a forced shutdown. The challenge most mills face is not a lack of vibration data, it is that nobody is watching the spectral detail closely enough to catch a developing fault while it is still a scheduled bearing change instead of an emergency mill stop, and our team can walk you through how spectral analysis catches this early on your mill.
Rolling mills, bearing predictive maintenance
Catch Mill Bearing Faults Weeks Before They Cause Downtime
iFactory AI runs spectral analysis on work-roll, back-up and chock-bearing vibration data, surfacing developing faults while there is still time to schedule the fix.
Why faults get caught late
Vibration Data Without Spectral Analysis Just Shows Noise
Many mills already collect vibration readings, but a single overall vibration number does not reveal which specific fault is developing or how far along it is, so the data sits in a log without changing anything.
Data collected
Vibration readings are logged on a routine basis
No spectral breakdown
An overall number hides which fault frequency is rising
Threshold crossed late
By the time overall vibration trips an alarm, damage is advanced
Emergency mill stop
What could have been scheduled becomes unplanned downtime
Three bearing types
Each Bearing Position Fails in Its Own Pattern
Work-roll bearings
Highest speed, most frequent load cycling, often the earliest to show spectral change.
Back-up roll bearings
Carry the heaviest load, with fault signatures tied to rolling force variation.
Chock bearings
Support structure bearings where misalignment faults are more common than pure wear.
Check What Your Current Vibration Data Shows
Share your existing vibration monitoring setup and see what spectral analysis would reveal that current thresholds miss.
Fault signature table
Matching Spectral Patterns to Bearing Faults
| Spectral pattern | Likely fault | Typical lead time |
|---|
| Rising peak at outer race frequency | Outer race defect developing | Weeks |
| Rising peak at inner race frequency | Inner race defect developing | Weeks |
| Rising peak at ball pass frequency | Rolling element wear | Weeks to a couple months |
| Broadband increase at running speed | Misalignment or looseness | Days to weeks |
Analysis pipeline
Four Steps From Vibration Signal to Scheduled Repair
1
Continuous capture
Vibration data is captured continuously from each monitored bearing position.
2
Spectral breakdown
The signal is broken into frequency components tied to specific fault types.
3
Trend against baseline
Each frequency component is tracked against that bearing's own normal pattern.
4
Flag and schedule
A developing fault is flagged early enough to plan the repair around production.
Common pitfalls
Three Problems With Overall-Vibration-Only Monitoring
1
Single threshold for all fault types
An overall vibration limit cannot distinguish an early-stage fault from normal variation.
2
No baseline per bearing position
Different bearing positions have different normal vibration patterns that a shared threshold misses.
3
Readings reviewed only periodically
A fault that accelerates between review periods is caught too late to plan around.
Expert review
Most mills already have the sensors needed for this, what they lack is the spectral analysis layer that turns raw vibration data into a specific, actionable fault warning. Before investing in more sensors, check whether your existing data is actually being analyzed at the spectral level.
Watch for
Vibration monitoring that only reports a single overall number per bearing rather than a frequency breakdown.
Do next
Run spectral analysis on your existing vibration data before deciding whether new sensors are needed.
— iFactory steel specialists
Frequently asked questions
What Mills Ask About Bearing Vibration Analytics
Can this work with our existing vibration sensors?
In many cases yes, since the spectral analysis can be applied to data from sensors already installed, though a review of your current sensor placement and sampling rate confirms whether they capture enough detail for reliable spectral analysis.
Ask about your current sensors.
How early can a bearing fault actually be caught?
Early-stage race or rolling element defects often show up in the spectrum weeks before they would trigger an overall vibration alarm, giving real lead time to plan a replacement around production scheduling.
Discuss typical lead times.
Does each bearing position need its own fault thresholds?
Yes, work-roll, back-up and chock bearings run at different speeds and loads, so each needs its own baseline rather than sharing a single plant-wide vibration limit.
Talk through your bearing positions.
Can this tell the difference between wear and misalignment?
Spectral patterns differ between bearing wear faults and misalignment or looseness issues, so the analysis can usually point toward which type of problem is developing rather than just flagging that something is off.
Ask about fault type differentiation.
How does this change our maintenance scheduling?
A flagged early-stage fault gives maintenance planning enough lead time to schedule the repair during an existing planned stop rather than reacting to an unplanned failure, which is the main shift most mills see.
Discuss your maintenance planning.
From raw vibration data to a planned fix
Catch Bearing Faults While They Are Still a Maintenance Item
Book a session with iFactory AI to review your current vibration data and see how spectral analysis fits your mill.