The Perform Achieve and Trade (PAT) scheme under India's Energy Conservation Act mandates that every Designated Consumer (DC) in the steel sector — any plant consuming more than 30,000 MTOE of energy annually — must meet prescribed Specific Energy Consumption targets or purchase Energy Saving Certificates (ESCerts) to cover the shortfall. For steel plants, PAT compliance is not just a regulatory obligation — it is a direct financial exposure. Missing a PAT cycle target by even 0.5 Gcal/tcs can cost a 3 MTPA plant ₹8–15 crore in ESCert purchases. Yet most plants still manage their PAT compliance through monthly spreadsheet reports, manual meter readings, and last-minute audit scrambles. iFactory's PAT Compliance and SEC Tracking platform eliminates this — providing real-time SEC visibility, automated BEE reporting, and AI-driven target forecasting from Day 1.
PAT Scheme Compliance for Steel Plants: SEC Targets, Monitoring & Reporting
Real-time SEC tracking, automated BEE reporting, ESCert management, and AI target forecasting — so your plant never misses a PAT cycle again.
Understanding PAT — What Steel Plants Are Required to Do
The PAT scheme divides steel plants into Designated Consumers by sub-sector — integrated steel (BF-BOF), electric arc furnace, sponge iron, and re-rolling. Each DC receives a Gate-to-Gate SEC baseline and a mandatory reduction target for the cycle — typically 4–8% over 3 years. Schedule a PAT readiness assessment to see where your plant stands against its current cycle targets before the assessment period closes.
Baseline SEC Set
BEE assigns a Gate-to-Gate SEC baseline in Gcal/tcs based on historical energy consumption and production data — audited and verified.
3-Year Cycle Runs
Plant must reduce its SEC to the assigned target level by cycle end. Energy consumption and production reported annually to BEE.
Assessment & Audit
Accredited Energy Auditor (AEA) verifies actual SEC achieved. Plants that over-achieve earn ESCerts — plants that fall short must buy them.
ESCert Trade / Penalty
Over-achievers sell ESCerts on the exchange. Under-achievers buy ESCerts at market price or face penalties under the Energy Conservation Act.
PAT SEC Benchmarks by Steel Sub-Sector — Where Does Your Plant Stand?
Gate-to-Gate SEC norms vary significantly by production route. BEE assigns individual plant targets based on the sub-sector norm. iFactory measures your actual SEC continuously against your specific BEE-assigned target — not just industry averages — so you always know your exact PAT position.
How iFactory Manages Your Entire PAT Compliance Cycle
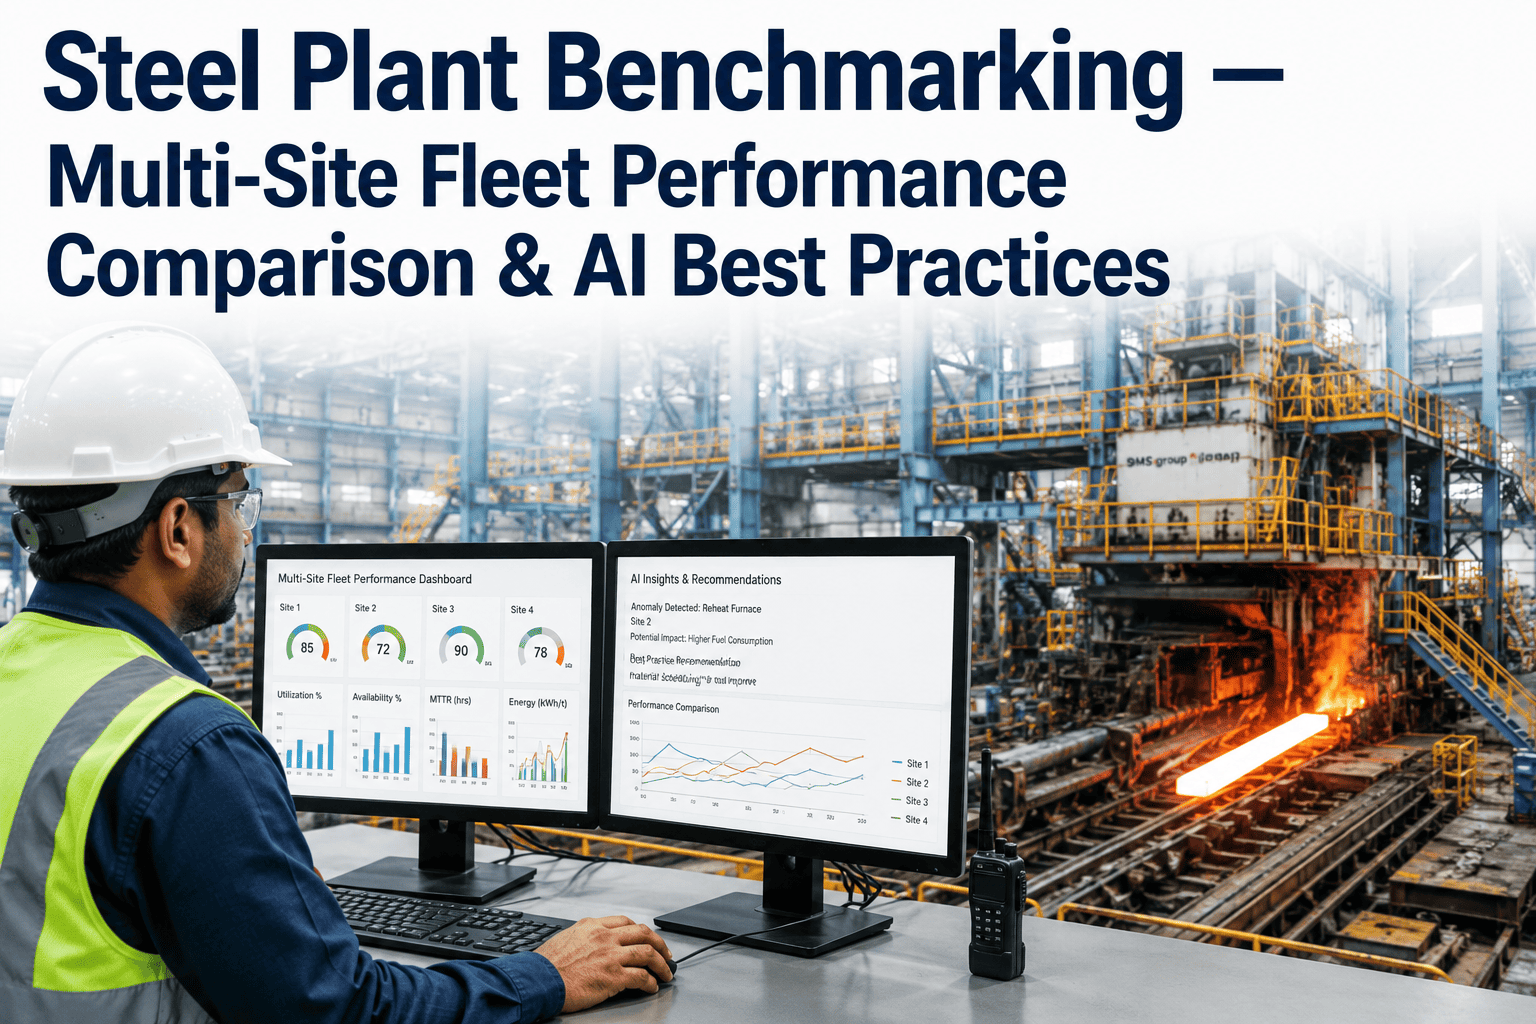
iFactory connects to every energy meter, PLC, and SAP system in your plant — calculating SEC in real time, forecasting your end-of-cycle position, and generating BEE-format reports automatically. See how iFactory calculates your live PAT position — configured around your specific baseline and cycle targets.
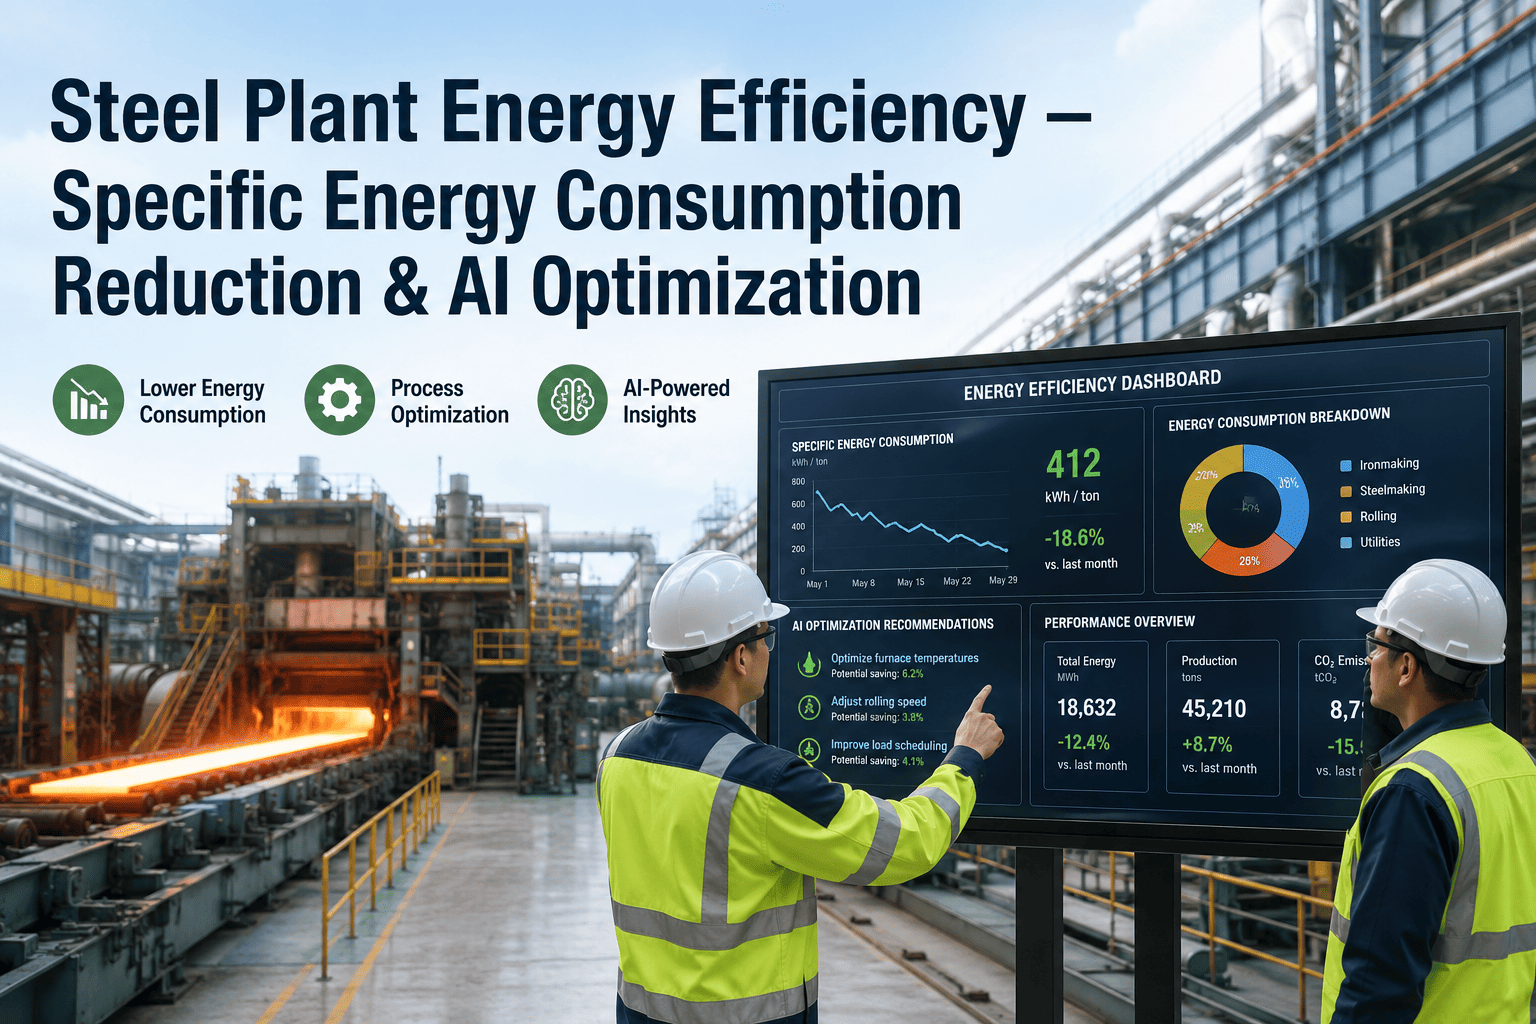
Real-Time SEC Dashboard
Gate-to-Gate SEC calculated every hour — per unit, per shift, cumulative year-to-date — displayed against your BEE-assigned target with traffic-light status.
Cycle-End Forecast
AI projects your final SEC at cycle end based on current trajectory — updated daily. If the forecast shows a shortfall, corrective recommendations are triggered automatically.
BEE Report Generation
Annual energy consumption statements, Form-1 and Form-2 BEE returns, and AEA audit pack generated automatically — in BEE-prescribed formats. No manual compilation.
ESCert Position Tracking
Tracks projected ESCerts earned or required based on current SEC trajectory — with market price feed integration so finance can plan ESCert strategy before cycle close.
SAP & PLC Integration
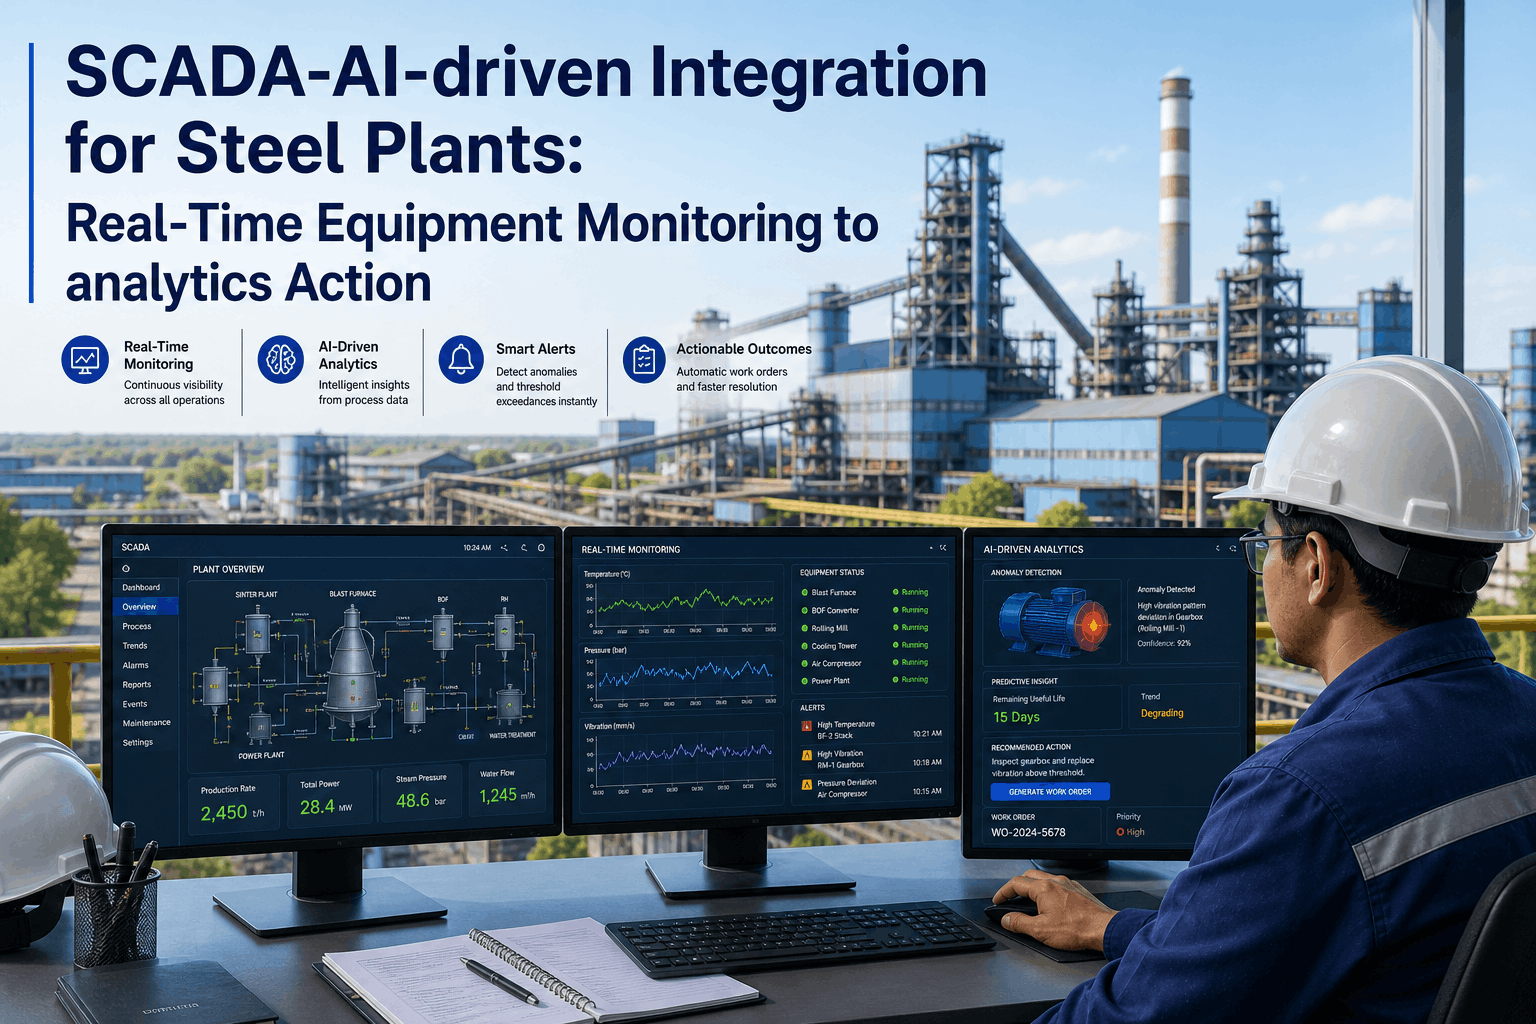
Energy data flows automatically from plant meters and SCADA via PLC integration — and cost allocation flows into SAP Energy Management. Zero manual data entry at any stage.
AI Digital Twin — SEC Scenarios
Model the SEC impact of operational changes — coke rate, WHR uptime, reheating furnace practices — before implementing them. Know the PAT impact of every energy decision.
PAT Audit Preparation Checklist — All Tracked by iFactory
A BEE energy audit by an Accredited Energy Auditor requires complete, verifiable energy and production data. iFactory maintains all of it continuously — so audit preparation takes hours, not weeks.
- Monthly unit-wise energy consumption — all fuels
- Calorific value records — coal, coke, gas, oil
- Grid and captive electricity metered separately
- WHR generation — sinter cooler, TRT, ORC
- Energy import/export to township and third parties
- Monthly crude steel production in tonnes
- Hot metal production — BF-specific
- Product mix adjustments for SEC normalisation
- Capacity utilisation vs installed capacity
- Downtime hours — planned and unplanned
- Form-1 annual energy return — BEE prescribed
- Meter calibration certificates — all energy meters
- Energy efficiency investment records
- AEA engagement letter and scope
- Previous cycle ESCert issuance/purchase records
What an Energy Manager Said After PAT Cycle 4
In PAT Cycle 3 we were scrambling to compile energy data six months before the audit — and still came up short by 0.3 Gcal/tcs, which cost us ₹6.8 crore in ESCerts. With iFactory, I know our SEC position every morning. We entered PAT Cycle 4 knowing exactly what we needed to achieve and exactly which units were dragging us above target. We over-achieved by 0.4 Gcal/tcs and earned ESCerts worth ₹2.6 crore instead.
Before vs. After iFactory — PAT Compliance at a 3.8 MTPA Integrated Plant
Results verified by the plant's energy and finance leadership at the close of PAT Cycle 4 — covering the full 3-year compliance period.
Frequently Asked Questions
How does iFactory calculate Gate-to-Gate SEC in BEE methodology?
iFactory applies the BEE Gate-to-Gate SEC formula — total energy consumed (in Gcal, including all fuels and electricity) divided by crude steel production — calculated hourly and aggregated monthly per BEE norms.
Can iFactory generate the BEE Form-1 annual energy return automatically?
Yes. Form-1 and Form-2 returns are auto-populated from iFactory's continuous energy and production data — in BEE's prescribed format, ready for AEA verification and submission.
How does the AI forecast know if we will miss our PAT target?
iFactory projects your full-cycle SEC based on current trajectory, seasonal patterns, and planned production schedule — updated daily. If the forecast shows a shortfall, corrective recommendations are generated for each contributing energy stream.
Does iFactory work for all four PAT steel sub-sectors?
Yes — integrated (BF-BOF), EAF, sponge iron (DRI), and re-rolling. Each sub-sector has its own SEC methodology configured within iFactory based on BEE's sub-sector norms.
How quickly does iFactory go live for a steel Designated Consumer?
Energy meter integration and SEC dashboard are typically live within 4–6 weeks. BEE report generation and ESCert position tracking are operational by Week 8–10.
See Your Live PAT Position — Today
Demo configured around your BEE baseline, sub-sector, and current cycle targets.