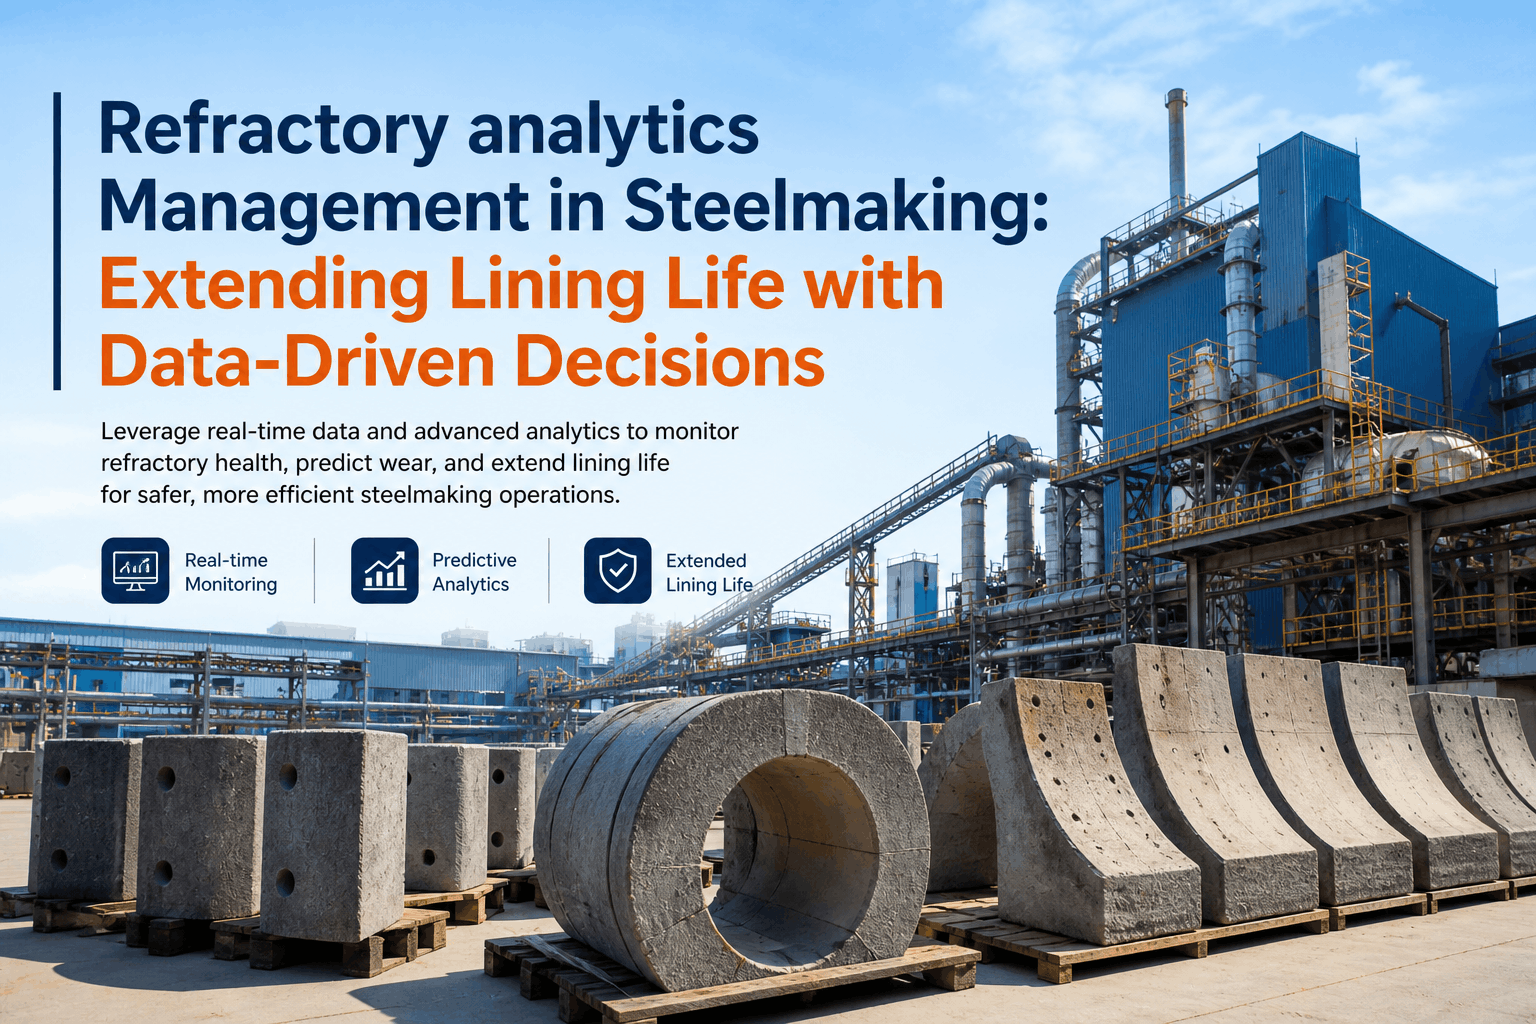
Refractory is the one cost line that quietly turns into an outage. A lining that wears faster than planned raises cost per tonne, but the bigger risk is an early reline, a breakout or a stopped caster that nobody scheduled. Blast furnaces, ladles, tundishes and electric arc furnaces each wear in their own way, yet the records usually sit in separate spreadsheets kept by different teams. Operations leaders who want lining life tied to cost per tonne can ask iFactory AI's team to review their refractory data and see where life is being lost.
Extend Lining Life Without Betting the Campaign on a Guess
iFactory AI tracks wear, heats and practice across every vessel, so refractory cost per tonne is managed by evidence, not by the next unplanned reline.
Anatomy of a Lining
Every vessel is built in layers. The simplified cross-section below shows what wears, what protects and what must never be reached.
Life Is Measured Differently in Each Vessel
A single refractory KPI does not work across the plant. Each asset has its own unit of life and its own usual cause of early loss.
Blast Furnace
Hearth and wall life set the campaign. Watch thermal load, cooling and tap-hole practice.
Ladle
Slag chemistry, holding time and temperature swings decide how long the lining lasts.
Tundish
Preheat, flow control and sequence length set cost per tonne cast.
Electric Arc Furnace
Slag foaming, hot spots and oxygen practice wear the walls and slag line.
See Lining Life and Cost Per Tonne in One View
Book a 30-minute session and iFactory AI will show refractory life by vessel, heat and practice using your own data.
Cheaper Brick, Dearer Steel
Purchase price is the wrong comparison. The right one is lining cost divided by the heats it delivers. The bars use illustrative figures for two products in the same ladle.
The Wear Curve and the Reline Line
Lining thickness falls with every heat, and the last stretch is the expensive one. The columns show illustrative remaining thickness, with the reline limit marked.
Life Extension Tactics by Vessel
Most gains come from practice around the lining, not from the lining itself. The table lists common levers.
| Vessel | Main Wear Cause | Practice Lever | Signal to Track |
|---|---|---|---|
| Blast furnace | Thermal load and hearth erosion | Cooling control, tap-hole and burden practice | Wall and hearth temperatures |
| Ladle | Slag attack and thermal cycling | Slag chemistry, holding time, preheat discipline | Heats per lining, slag basicity |
| Tundish | Erosion at flow and slag zones | Preheat, flow control, sequence planning | Sequence length, repair count |
| EAF | Arc radiation, slag and hot spots | Slag foaming, targeted repair, oxygen practice | Panel temperatures, hot spot map |
Continue, Repair or Reline
The decision should follow the measured thickness and its trend, not the calendar. A simple three-way rule makes the call consistent across shifts.
A Composite Scenario: Eighteen More Heats From the Same Ladle
A melt shop tracked slag basicity and holding time against heats per ladle lining. After tightening two practices, average life rose. The figures below are illustrative.
Where iFactory AI Fits
Wear measurements, heat records and purchase costs live in different files. iFactory AI joins them at the level of the vessel.
Lining Life Ledger
Every lining carries its start date, heats, repairs and reason for retirement.
Practice Correlation
Compare life against slag, temperature and holding time to find the lever that matters.
Reline Planning
Wear trends flag approaching limits early enough to plan the outage.
Cost Per Tonne Roll-Up
Refractory cost lands in the same driver view as every other bucket.
Frequently Asked Questions
How do we compare two refractory products fairly?
Compare cost per heat or per tonne over enough heats to smooth the variation, using the same vessel, grade mix and practice. Purchase price alone is misleading, since a dearer product that lasts longer is usually cheaper per tonne. Trial results should be logged with slag and temperature data. iFactory AI's team can help design a fair trial before you switch supplier.
Can we extend life safely without risking a breakout?
Yes, if extension is driven by measured thickness and clear limits, not by hope. Repairs such as gunning add heats where wear is local, while practice changes reduce the wear rate itself. Safety limits set by your refractory supplier and operating standards remain fixed. The purpose of tracking is to use the margin you have, never to reduce it.
What data do we need to start tracking lining life?
Three records cover most of it: when each lining was installed, the heats it has completed and the reason it was retired. Wear measurements, repair logs and slag data add depth. Most plants already hold these in maintenance and MES systems. See a lining ledger in a short walkthrough built from records like yours.
Does this replace our refractory supplier's service?
No. Suppliers bring product and application expertise, and that stays valuable. iFactory AI provides the plant's own record of life, practice and cost, which supports a better conversation with the supplier and a fair judgment of results. Many plants share the ledger with suppliers during reviews so recommendations are tied to actual heats.
Which vessel should we start with?
Start with the vessel that has the highest refractory spend and the most frequent relines, which in many plants is the ladle. It produces many data points quickly, so gains show within weeks. Tundish and EAF follow naturally, and blast furnace tracking builds on the same approach. Ask support to help rank your vessels by spend and reline frequency.
Turn Lining Life Into a Cost You Can Plan
iFactory AI links wear, heats and practice to refractory cost per tonne across every vessel. Book a walkthrough to see it on your own data.