Roll bearings do not fail without warning — they fail without anyone reading the warning. Vibration signatures shift weeks before a bearing seizes, temperature trends climb gradually before they spike, and lubrication quality degrades on a curve that is fully visible to anyone monitoring it consistently. The problem in most rolling mills is not a lack of data; it is that the data lives in three different systems nobody checks together until after the bearing has already failed and taken a work roll position offline with it. Closing that gap with predictive monitoring is one of the highest-return reliability investments a roll shop can make, and teams building that capability can Book a Demo to see it working end to end.
ROLL BEARING FAILURE · PREDICTIVE MONITORING · CONDITION HEALTH
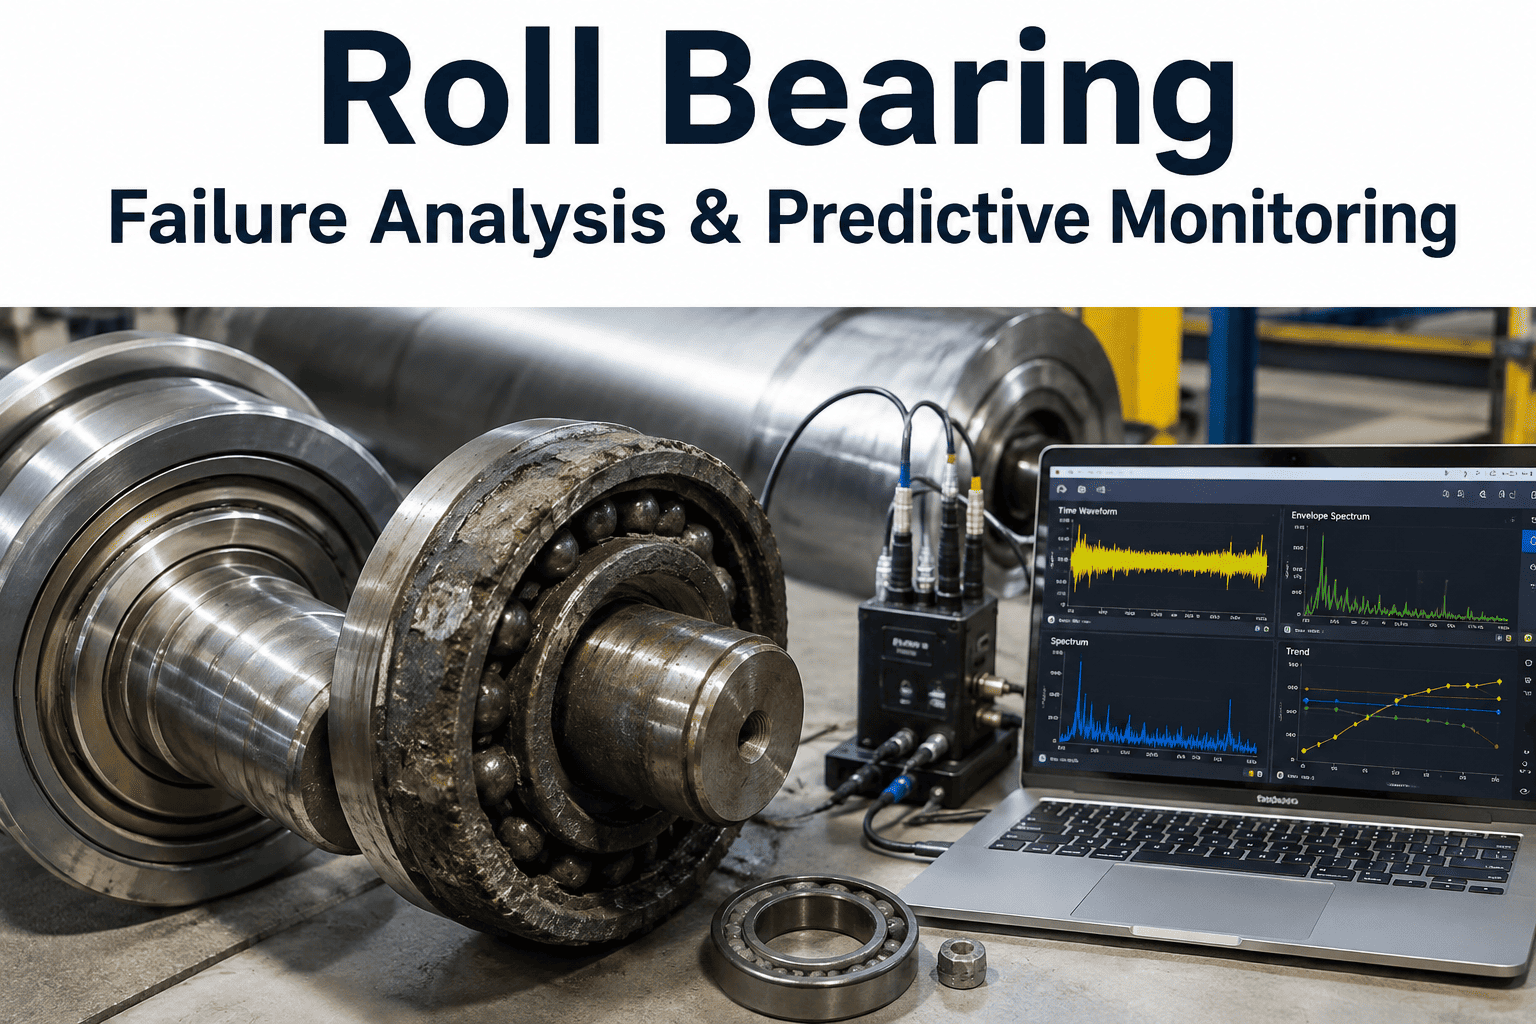
Roll Bearing Failure Analysis & Predictive Monitoring
How vibration signatures, temperature trends, and bearing life calculations combine to catch roll bearing degradation weeks before failure — and how to build a monitoring program that actually acts on what it detects.
The Four Stages of Bearing Degradation
Bearing failure is a process, not an event, and each stage of that process leaves a different signature in the data. A monitoring program built around a single threshold — "alarm if vibration exceeds X" — catches only the last stage, by which point the bearing is often days from catastrophic failure. A program built to recognize all four stages buys the shop weeks of planning lead time instead of hours of emergency response.
Ultrasonic Onset
The earliest detectable stage. Microscopic surface fatigue begins generating high-frequency ultrasonic emissions well before vibration in the audible or standard accelerometer range changes at all.
Vibration Signature Shift
Distinct frequency peaks emerge at bearing defect frequencies — ball pass, cage, and race frequencies specific to the bearing geometry — detectable weeks to months before failure.
Thermal Rise
Friction from surface damage generates measurable heat. Temperature trending upward against a stable baseline typically appears days to weeks before failure, later than vibration but easier to trend simply.
Audible & Catastrophic
Roughness becomes audible, vibration amplitude spikes sharply, and failure becomes imminent — typically within hours to days. Reactive maintenance operates almost entirely in this stage.
Reading Vibration Signatures: What Each Frequency Peak Actually Means
Vibration monitoring is the backbone of roll bearing predictive maintenance because bearing defects generate vibration at mathematically predictable frequencies tied to bearing geometry and shaft speed. A technician who understands what each frequency band represents can diagnose not just that a bearing is degrading, but which specific component — outer race, inner race, rolling elements, or cage — is the source, which directly informs both urgency and repair planning.
Outer race defects typically produce the cleanest, most repeatable frequency signature because the defect location relative to the load zone stays fixed, making them the easiest fault to catch early and diagnose with confidence. Inner race defects are harder to isolate because the defect rotates through the load zone, creating amplitude modulation around the core defect frequency rather than a single clean peak. Rolling element defects generate frequencies at twice the fundamental train frequency and often show up alongside harmonics of shaft speed, which is why a monitoring program that only tracks overall vibration amplitude — rather than frequency-domain analysis — misses this fault type almost entirely until it has progressed significantly. Cage defects are the rarest but often the most consequential, since a failing cage can allow rolling elements to bunch together and accelerate failure across the entire bearing within a short window.
VIBRATION MONITORING · TEMPERATURE TRENDING · BEARING HEALTH
Catch Bearing Degradation Weeks Before Failure, Not Hours
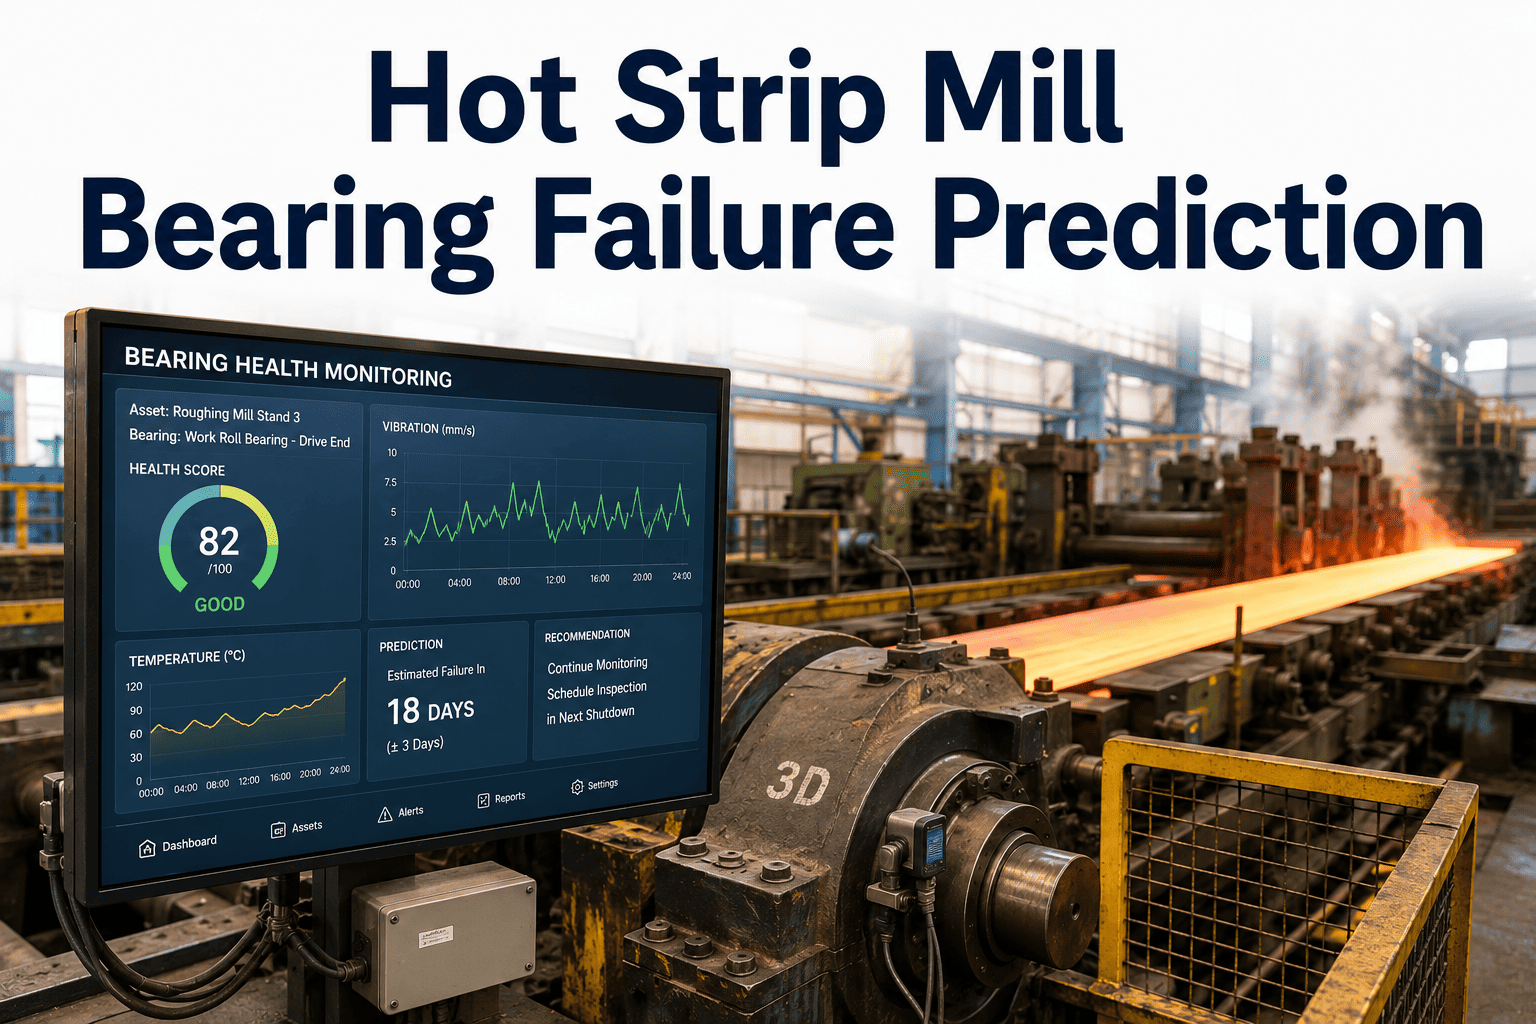
iFactory correlates vibration signature, temperature trend, and lubrication data into a single bearing health score — flagging degradation while there's still time to plan the replacement instead of react to the failure.
Bearing Life Calculation: From L10 Rating to Real-World Replacement Timing
The L10 life rating — the number of revolutions or operating hours at which 10 percent of a bearing population is statistically expected to show fatigue failure — is the standard starting point for replacement planning, but it is a population statistic, not a prediction for any individual bearing. Roll bearings running in a rolling mill environment rarely fail at exactly their L10 rating; contamination, misalignment, lubrication quality, and load variation from actual campaign conditions all shift the real failure curve away from the catalog number in either direction.
The practical approach that mature roll shops use is treating L10 as the planning baseline and then adjusting the replacement interval based on condition monitoring trends specific to each bearing position. A bearing tracking clean and stable well past its L10 hours can often run longer than the catalog number suggests, recovering unnecessary replacement cost. A bearing showing early degradation signatures well before its L10 hours needs to come out regardless of what the calculation says, because condition data always overrides a population statistic for an individual asset. This hybrid approach — statistical baseline adjusted by real condition data — consistently outperforms either a pure time-based replacement schedule or a pure run-to-failure approach on both cost and unplanned downtime.
Common Bearing Failure Patterns on Rolling Mill Roll Positions
Roll bearings fail differently depending on position and operating condition, and recognizing the pattern quickly narrows the root cause investigation considerably. The categories below cover the failure patterns most frequently seen across work roll and backup roll bearing positions.
Contamination-Driven Wear
Scale, coolant ingress, or particulate contamination accelerates surface fatigue and shows up as broadband, non-specific vibration increase alongside gradually rising lubricant particle counts.
Misalignment-Induced Load
Uneven load distribution from chock or housing misalignment produces asymmetric wear and elevated vibration at shaft rotational frequency and its harmonics, often on one bearing more than its pair.
Lubrication Breakdown
Thermal degradation or additive depletion in the lubricant raises friction and temperature well before vibration signatures shift, making temperature trending an early independent indicator here.
Fatigue From Cyclic Load
Standard rolling-load fatigue that produces the classic defect-frequency vibration signature described above, typically the most predictable pattern once monitoring baselines are established.
Building a Predictive Monitoring Program: Five Implementation Steps
01
Establish Healthy Baselines
Record vibration and temperature signatures for each bearing position while running known-healthy, so future readings have something meaningful to compare against rather than an assumed generic threshold.
02
Set Position-Specific Thresholds
Alarm thresholds calibrated to each bearing's own baseline and duty cycle catch meaningful deviation far earlier than a single plant-wide threshold applied uniformly across every position.
03
Correlate Multiple Data Streams
Vibration, temperature, and lubrication data each catch different failure stages. Correlating all three into one health view catches faults that any single stream alone would miss or catch too late.
04
Route Alerts to Action, Not Just Notification
A degradation alert that does not automatically generate a work order or inspection task sits unread. Routing directly into the maintenance queue is what turns detection into prevention.
05
Close the Loop on Every Failure
Every bearing that does fail should be inspected to confirm whether monitoring caught it, missed it, or caught it too late — and thresholds updated accordingly so the program keeps improving.
Sensor Placement: Why Location Determines Detection Quality
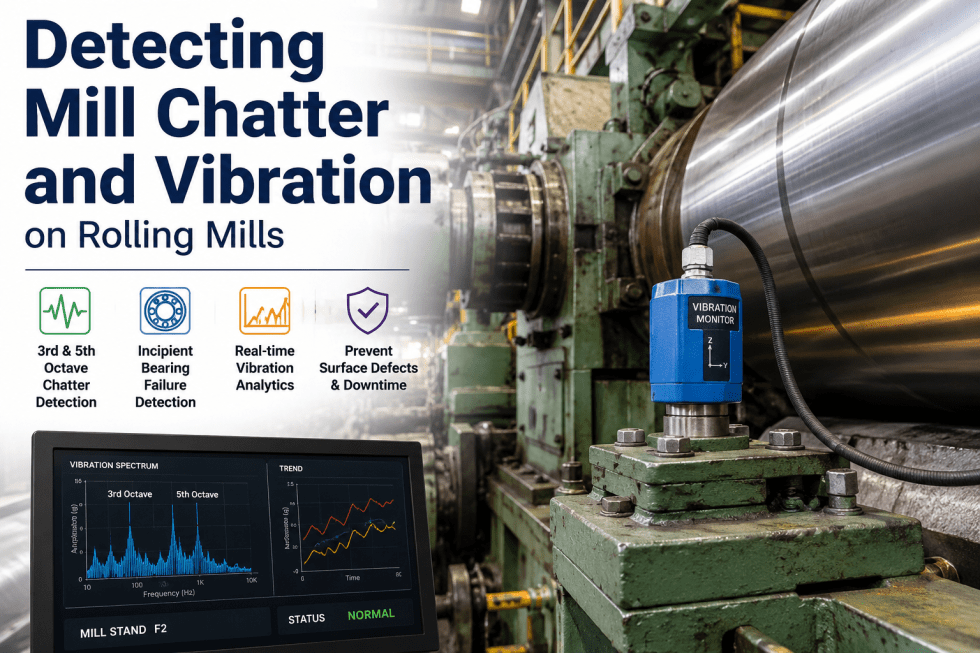
A vibration sensor mounted in the wrong location can miss a developing fault even when the fault is generating a clear signal at the bearing itself, simply because vibration attenuates rapidly as it travels through the housing structure between the source and the sensor. Getting placement right is as important as choosing the right sensor technology, and it is a step that gets skipped surprisingly often when monitoring programs are rolled out quickly across many roll positions at once.
Load Zone Proximity
Sensors mounted as close as possible to the bearing's load zone capture the strongest signal, since that is where defect-frequency vibration is generated most directly.
Rigid Mounting
A loosely mounted sensor introduces its own resonance and damping artifacts into the signal, distorting frequency readings in ways that can mask or mimic real bearing defects.
Consistent Orientation
Radial and axial measurements capture different fault types. Consistent, repeatable sensor orientation across readings is what makes trend comparison over time meaningful rather than noisy.
Path Length to Sensor
Every housing joint and material transition between the bearing and the sensor attenuates high-frequency signal, which is why the shortest practical path matters most for early-stage fault detection.
The Cost Case for Predictive Bearing Monitoring
An unplanned bearing failure on a roll position rarely stays contained to the bearing itself. A bearing that seizes or fails catastrophically during operation frequently damages the roll neck, the chock, or the housing around it, turning a bearing replacement that would have cost a few hours of planned work into a multi-day repair involving several additional components. The secondary damage cost is often several times the direct cost of the bearing itself, which is the core economic argument for predictive monitoring: catching the fault weeks early converts an expensive, multi-component emergency repair into an inexpensive, single-component planned replacement.
There is a second, less obvious cost that predictive monitoring addresses: production disruption from an unplanned stop is rarely limited to the direct downtime hours. Restarting a mill after an unplanned bearing failure often requires re-establishing thermal and mechanical stability across the line, producing a run of off-spec or marginal-quality product immediately after the restart that a planned changeover, scheduled during a natural production break, would not have incurred at all. Building the monitoring program that avoids both cost layers consistently pays back faster than most plants initially estimate once secondary damage and restart disruption are properly accounted for alongside the direct bearing cost.
Frequently Asked Questions: Roll Bearing Predictive Monitoring
How early can vibration monitoring actually detect a bearing problem?
Under good conditions, ultrasonic and high-frequency vibration analysis can detect the earliest stage of surface fatigue weeks to months before the bearing would fail on a run-to-failure basis, well before the defect is visible in standard overall vibration amplitude readings. The exact lead time depends on the specific fault type, monitoring frequency, and how well the baseline was established. Teams looking to build this capability can
Book a Demo to see typical detection windows for roll bearing applications.
Is temperature monitoring alone sufficient for predictive bearing maintenance?
Temperature is a useful and simple indicator, but it typically lags vibration analysis by days to weeks because heat generation requires the fault to progress far enough to create measurable friction. Temperature monitoring alone will catch bearings closer to failure than a vibration program would, which is fine as a low-cost baseline but insufficient on its own for critical roll positions where early warning matters most.
How does contamination affect bearing life compared to normal fatigue?
Contamination-driven wear can shorten effective bearing life dramatically compared to the L10 fatigue rating, because particulate ingress creates surface damage through a mechanism the catalog rating does not account for at all. A bearing running in a contaminated environment can fail at a fraction of its rated life even though the load and speed conditions are well within specification, which is why seal condition and lubrication cleanliness deserve as much monitoring attention as vibration.
Should bearing replacement be scheduled on a fixed interval or condition-based?
A hybrid approach outperforms either extreme in most rolling mill applications. Fixed-interval replacement wastes bearing life that was still available and still costs unplanned downtime when a bearing fails early despite the schedule. Pure condition-based replacement with no baseline planning risks missing a fast-progressing fault between inspection intervals. Using the L10 rating as a planning baseline and adjusting based on live condition trends captures the benefit of both approaches.
What is the most common mistake plants make when starting a bearing monitoring program?
Setting alarm thresholds before establishing a proper healthy baseline for each bearing position. A generic threshold applied uniformly either produces so many false alarms that the team stops trusting the system, or is set so loose that it catches nothing until the failure is already in its final stage. Establishing position-specific baselines first is the step that determines whether the whole program succeeds. Plants setting this up can contact
iFactory Support for baseline configuration guidance.
ROLL BEARING MONITORING · CONDITION HEALTH · FAILURE PREVENTION
Give Every Roll Bearing a Live Health Score
iFactory turns vibration, temperature, and lubrication data into one bearing health view per roll position — with alerts that route straight into your maintenance queue before failure ever reaches the mill.