Your rebar starts as a pile of scrap metal. Between that pile and a finished structural bar lie five complex process stages, each capable of silently destroying yield, wasting energy, and producing off-spec product. The global steel rebar market is projected to reach $414 billion by 2033, growing at a 5.1% CAGR. Yet most EAF-based rebar plants still run blind between stages — no real-time heat tracking, no AI-driven chemistry optimization, no unified view from scrap yard to shipping bay. The plants that digitize this chain are capturing 8–15% more yield and cutting per-tonne conversion costs by $18–30. This guide maps the complete scrap-to-rebar production chain and shows exactly where smart manufacturing transforms every stage. If your plant manages heats on whiteboards and tracks billets in spreadsheets, you are leaving millions on the table. iFactory gives you real-time visibility from scrap charge to finished rebar — book a 30-minute assessment to see your hidden losses.
Scrap-to-Rebar Smart Manufacturing
End-to-End AI-Driven Steel Production Optimization for EAF Mini Mills
$414B
Global Steel Rebar Market by 2033
5.1M
MT Rebar Produced via EAF Scrap-Based Billets (USA, 2024)
8–15%
Yield Improvement with End-to-End Digital Tracking
The 5-Stage Scrap-to-Rebar Production Chain
Rebar manufacturing through the EAF route follows a precise sequence. Each stage has distinct process parameters, failure modes, and optimization opportunities that AI can address in real time.
01
Scrap Selection and Charging
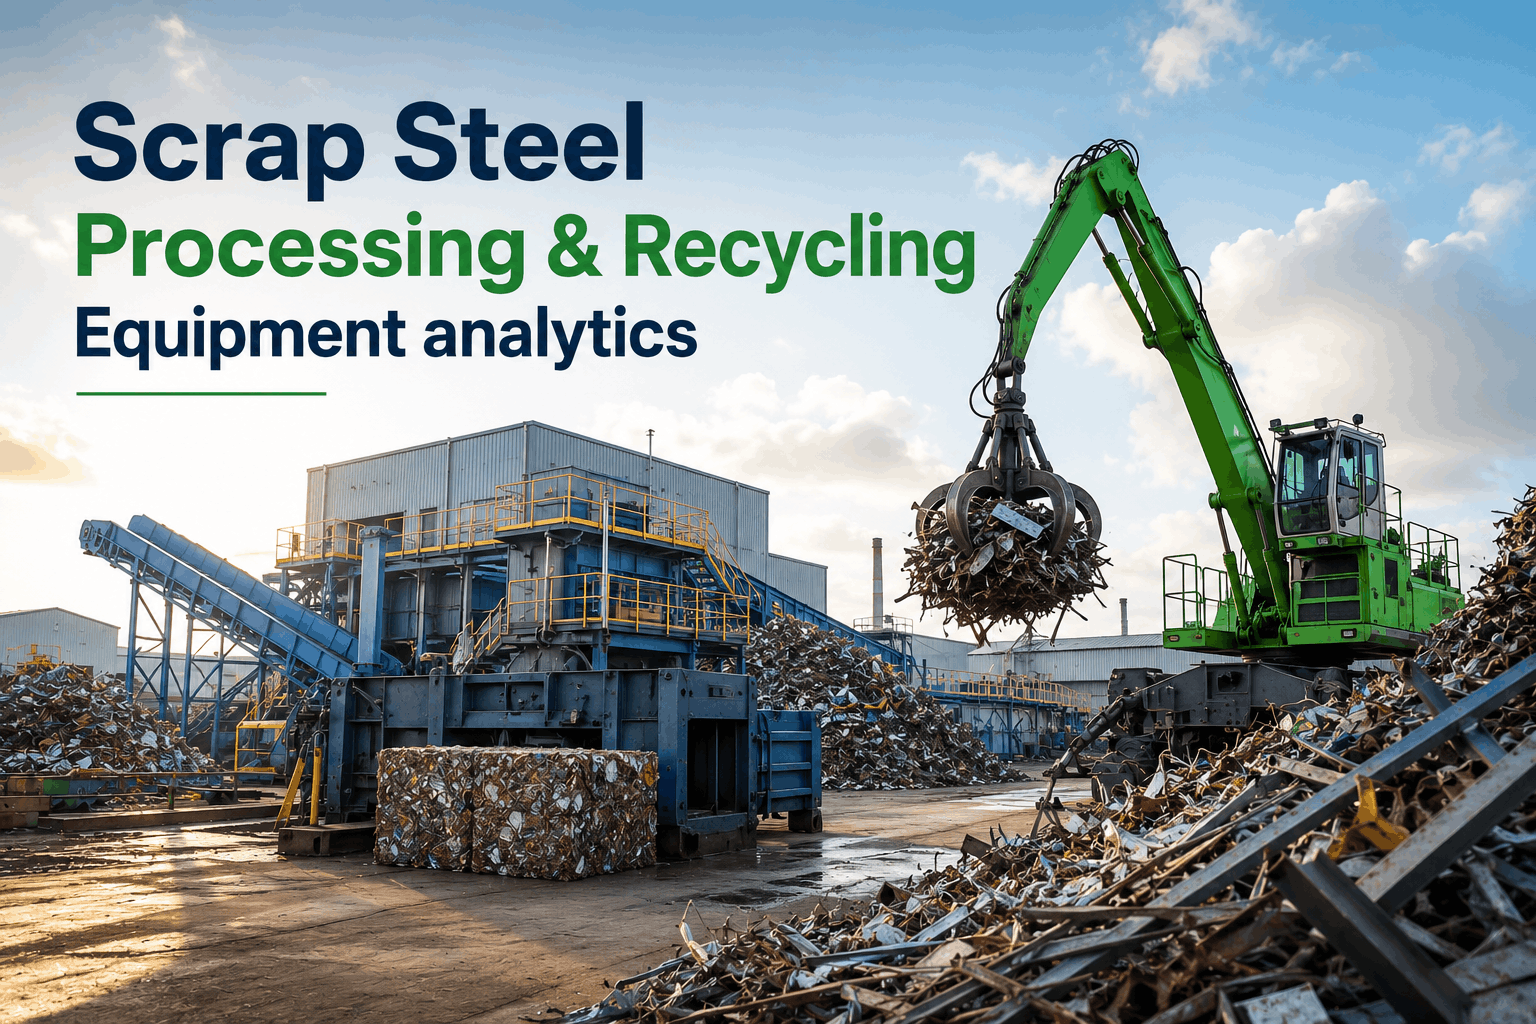
Ferrous scrap is sorted, graded, and loaded into charging buckets. Chemistry prediction begins here — the mix of HMS, shredded, and prompt scrap determines downstream alloy needs, energy consumption, and tramp element risk (copper, tin).
Key Variable
Scrap Mix Chemistry
02
EAF Melting
Scrap is melted at up to 1,800 °F using high-current electric arcs. Slag chemistry, oxygen injection, and power profiles determine energy efficiency, electrode consumption, and tap-to-tap time. A single heat cycle runs 40–60 minutes.
Key Variable
Tap-to-Tap Time and kWh/Tonne
03
Ladle Refining (LF)
Molten steel transfers to the ladle furnace for chemistry trimming, desulfurization, and temperature homogenization. Alloy additions (vanadium, manganese) are precisely dosed here to hit target mechanical properties for the rebar grade.
Key Variable
Final Chemistry and Temperature Window
04
Continuous Casting (CCM)
Refined steel flows through the tundish into water-cooled molds, solidifying into billets (typically 130mm or 150mm square). Casting speed, mold oscillation, and superheat control determine billet surface quality and internal soundness.
Key Variable
Casting Speed and Superheat Control
05
Billet Reheating and Rolling
Billets are reheated to rolling temperature (1,100–1,200 °C) and passed through roughing, intermediate, and finishing stands to produce deformed rebar in the target diameter. Finishing rolling temperature directly affects yield strength and ductility.
Key Variable
Finishing Rolling Temperature (FRT)
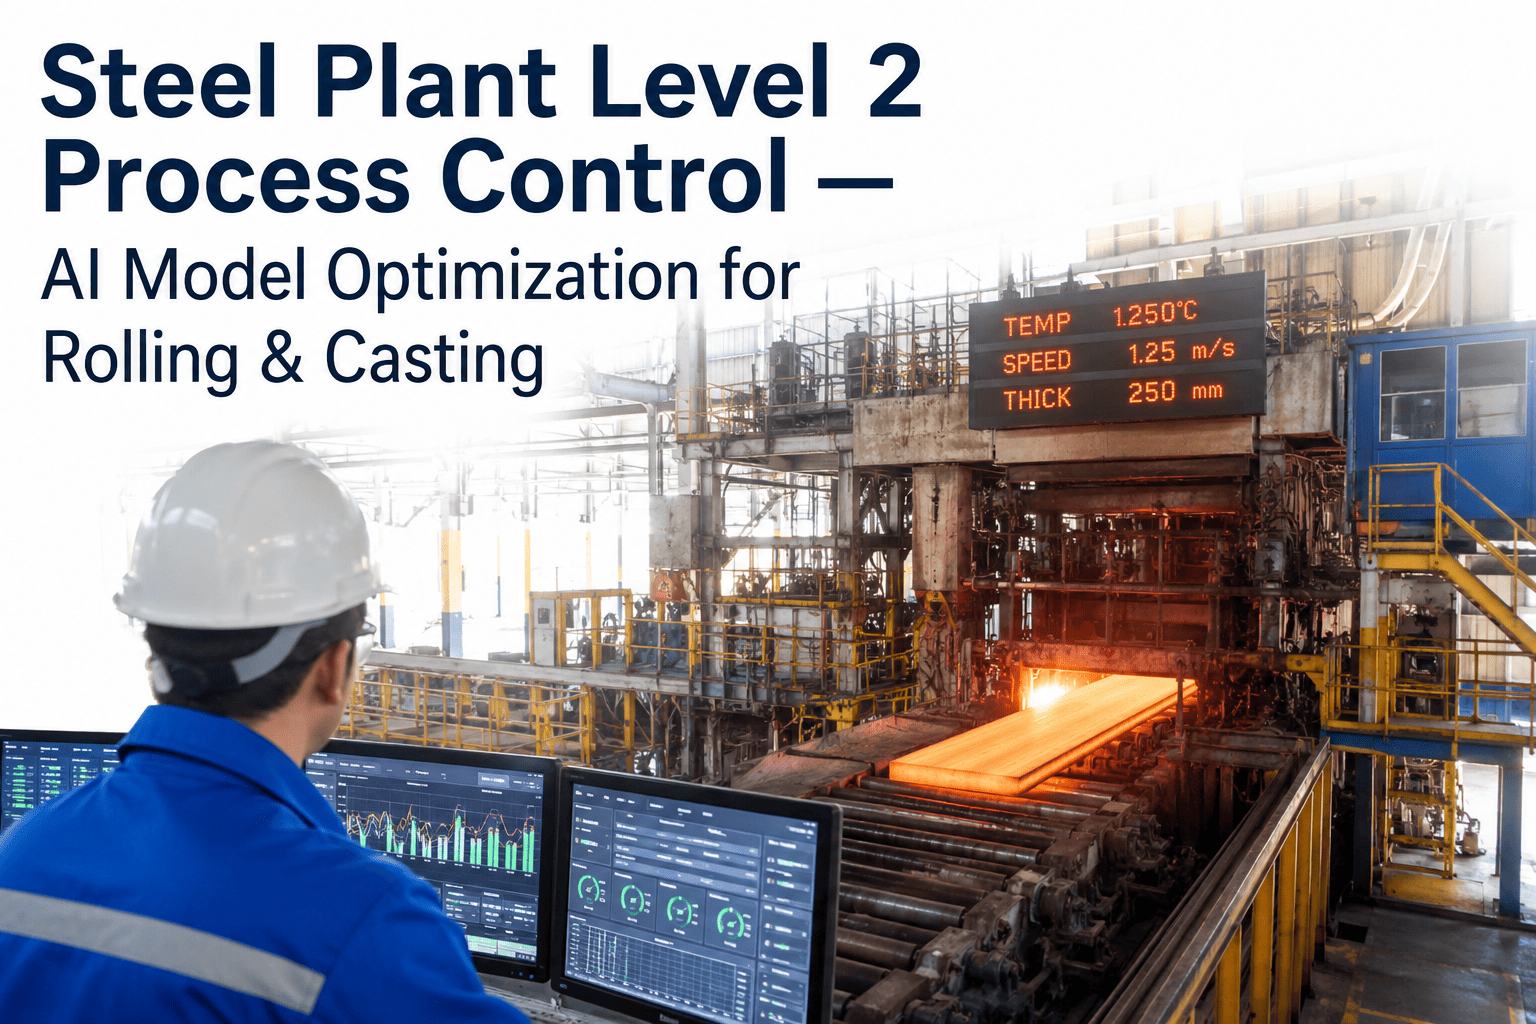
In the EAF route, scrap is melted at extreme temperatures, refined for chemistry, cast into billets, and hot-rolled into rebar. Each handoff between stages is a potential yield loss point. Plants that track each heat digitally from charge to cut length recover 3–5% more saleable tonnage than plants running on paper logs.
Where Rebar Plants Lose Money: Stage-by-Stage Loss Map
Every process stage has specific, measurable losses. Most plants only see the total — smart manufacturing exposes the exact breakdown.
01
Scrap Yard: Chemistry Guesswork
Without compositional analysis at charging, plants over-alloy by 10–20% as a safety margin. Tramp elements like copper and tin cause surface cracking during hot rolling, producing off-spec rebar that gets downgraded or scrapped.
Cost Impact
$8–15/t
02
EAF: Energy and Electrode Waste
Non-optimized power profiles consume 380–420 kWh per tonne when best practice is 330–360 kWh. Electrode consumption runs 1.5–2.0 kg/t above benchmarks. Each extra minute of tap-to-tap time costs $40–60 in energy and throughput loss.
Cost Impact
$12–22/t
03
Ladle Furnace: Off-Spec Heats
Chemistry misses at the LF stage result in heats that either require costly re-treatment or produce rebar that fails tensile or bend testing. Every reprocessed heat adds 15–25 minutes and wastes alloy additions worth $5–10 per tonne.
Cost Impact
$5–10/t
04
Caster: Billet Defects and Breakouts
Poor superheat control and tundish transition issues create internal cracks, rhomboidity, and surface defects in billets. Caster breakouts halt production entirely, costing $20,000–50,000 per event in lost time and material.
Cost Impact
$4–8/t
05
Rolling Mill: Cobbles and Crop Losses
Cobble events halt rolling lines for 10–30 minutes each. Head and tail crop losses at each stand accumulate to 2–4% of input weight. Incorrect finishing temperature produces rebar outside strength specifications.
Cost Impact
$3–7/t
How Much Is Your Plant Losing Per Tonne?
iFactory maps losses across every stage — scrap to rebar — and connects them to automated work orders so every loss trigger gets fixed, not just logged. Most plants uncover $25–45 per tonne in recoverable losses within the first diagnostic.
Smart Manufacturing: What Changes at Each Stage
Digital transformation in a rebar mini mill is not a single system — it is stage-specific intelligence layered across the entire chain.
How Most Plants Operate Today
✗ Scrap graded visually, chemistry estimated from supplier certificates
✗ EAF power profiles follow fixed recipes regardless of scrap mix
✗ Ladle alloy additions based on operator experience
✗ Billet quality checked via manual sampling after casting
✗ Rolling mill speed set by grade, not real-time billet condition
✗ Losses discovered in monthly production reviews
What iFactory Enables
✓ AI predicts melt chemistry from scrap mix before charging
✓ Dynamic power curves adapt to each heat in real time
✓ Automated alloy dosing calculated from live spectrometer data
✓ Continuous billet quality scoring with thermal imaging and sensors
✓ Rolling parameters auto-adjust based on billet temperature profile
✓ Losses flagged in real time with automated root-cause tagging
The AI Layer: What Intelligent Systems Actually Do in Rebar Production
AI in steel is not about replacing operators — it is about giving them predictive visibility they never had before.
Yield and Chemistry Prediction
ML models predict final steel chemistry from scrap charge composition, reducing alloy waste by 12–18% and eliminating chemistry re-blows
Yield prediction per heat allows production planning to commit tonnage before the heat is tapped
Energy and Throughput Optimization
Dynamic EAF power profiles reduce energy consumption by 30–50 kWh per tonne by adapting to scrap density and melt progression in real time
Tap-to-tap time optimization squeezes 2–4 additional heats per day from existing furnace capacity
Defect Prevention and Quality Scoring
Continuous billet surface scoring identifies defects before they enter the rolling mill, preventing cobbles and off-spec rebar
Automated tensile strength prediction based on chemistry and FRT ensures every coil meets ASTM A615 or equivalent
Predictive Maintenance Across the Chain
Vibration, thermal, and power-draw anomaly detection on EAF electrodes, caster segments, and rolling stands predicts failures 48–72 hours ahead
Automated CMMS work orders generated from AI alerts cut unplanned downtime by 25–40%
Real Numbers: What Smart Manufacturing Delivers
These are the measurable outcomes that EAF rebar plants achieve within 6–12 months of deploying end-to-end digital tracking and AI-driven optimization.
Metallic Yield (Scrap to Billet)
88–90%
93–95%
+3–5 pts
EAF Energy Consumption
380–420 kWh/t
330–360 kWh/t
-50–60 kWh/t
Tap-to-Tap Time
55–65 min
42–50 min
-15–20 min
First-Pass Quality Rate
91–93%
97–99%
+4–6 pts
Unplanned Downtime
12–18%
5–8%
-7–10 pts
Conversion Cost per Tonne
$95–120
$70–95
-$18–30/t
With rebar market prices around $575 per tonne and razor-thin margins of roughly $25 per tonne, a $20 reduction in conversion cost does not just improve profitability — it doubles it. Smart manufacturing is not an IT project; it is a margin survival strategy.
Market Context: Why This Matters Now
The steel rebar market is entering a phase where digital capability separates winners from plants that get priced out.
Global Market Size (2025)
$278 Billion
Growing demand means capacity utilization matters more than ever
Market CAGR (2026–2033)
5.1%
Steady growth rewards plants that can scale output from existing assets
EAF Share of Rebar Production
Growing rapidly
Scrap-based production is the future — optimization of this route is critical
Scrap Price Volatility
10–20% swings
Higher yield from each tonne of scrap directly hedges raw material risk
Green Steel Mandates
Accelerating globally
Digital traceability from scrap to rebar is becoming a compliance requirement
Implementation: 90-Day Roadmap to Connected Rebar Production
You do not need a multi-year digital transformation program. A focused 90-day deployment connects your critical data streams and delivers measurable results.
Days 1–30
Connect and Baseline
Integrate EAF, LF, caster, and rolling mill data streams into a unified platform. Establish true yield, energy, and quality baselines. Most plants discover their actual losses are 10–15% higher than what manual logs show.
Days 31–60
Analyze and Alert
Deploy real-time dashboards with loss categorization by stage, shift, and product. Enable automated alerts for chemistry deviations, energy anomalies, and quality events. First measurable improvements appear as operators act on visible data.
Days 61–90
Predict and Optimize
Activate AI models for yield prediction, energy optimization, and predictive maintenance. Connect alerts to automated CMMS work orders. By day 90, every loss event triggers a corrective action — not just a log entry.
Frequently Asked Questions
What is scrap-to-rebar manufacturing?
Scrap-to-rebar is the EAF-based steel production route where recycled ferrous scrap is melted, refined, cast into billets, and hot-rolled into deformed reinforcing bar. This route accounts for a growing share of global rebar output due to its lower capital cost, smaller environmental footprint, and ability to operate economically at mini-mill scale.
How does AI improve rebar production yield?
AI models predict melt chemistry from scrap inputs before charging, optimize EAF power profiles in real time, and score billet quality continuously during casting. This prevents off-spec heats, reduces alloy over-addition, and catches defects before they propagate to the rolling mill — recovering 3–5% of metallic yield that plants typically lose without real-time tracking.
What ROI can a rebar plant expect from smart manufacturing?
With rebar margins as thin as $25 per tonne, a $18–30 per tonne reduction in conversion cost can double operating profit. For a 250,000 tonne per year mini mill, this translates to $4.5–7.5 million in annual savings. Most plants see measurable improvements within 90 days of deployment and full ROI within 8–12 months.
Does this require replacing existing automation systems?
No. iFactory integrates with existing PLCs, SCADA, Level 2 systems, and MES platforms. The AI layer sits on top of your current infrastructure, ingesting data from EAF controllers, caster systems, and rolling mill drives without requiring hardware replacement or production shutdowns for installation.
Turn Your Scrap-to-Rebar Chain Into a Competitive Advantage
iFactory connects every stage — scrap charge to finished rebar — with real-time tracking, AI-driven optimization, and automated maintenance workflows. See exactly where your tonnes and dollars disappear, and start recovering them in 90 days.