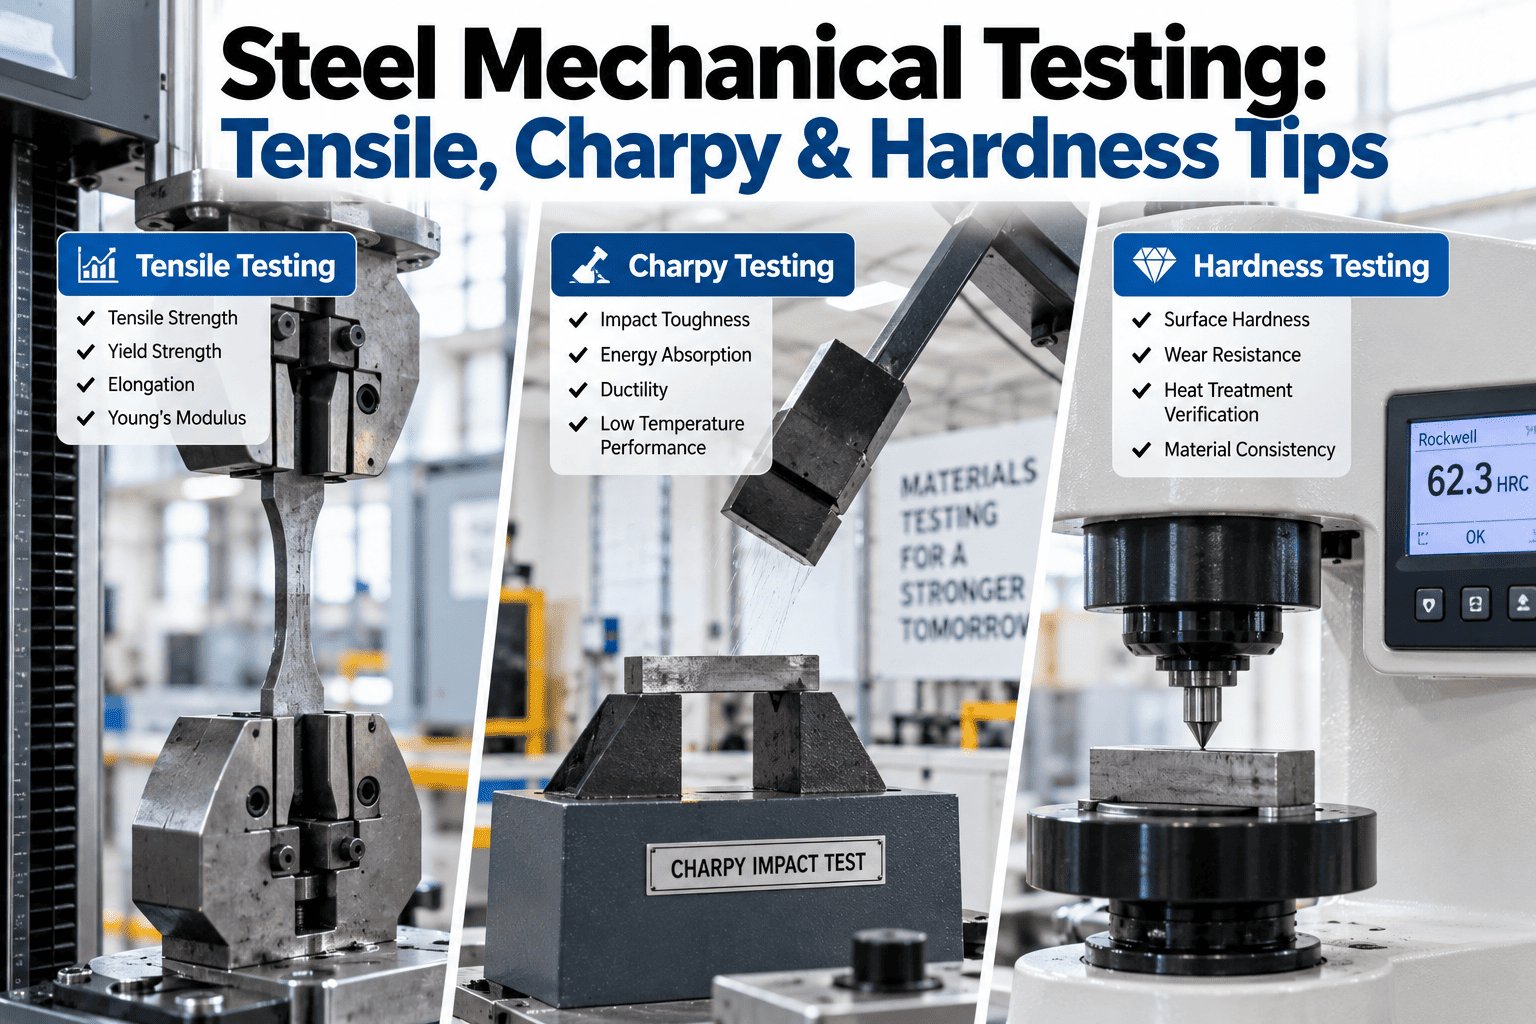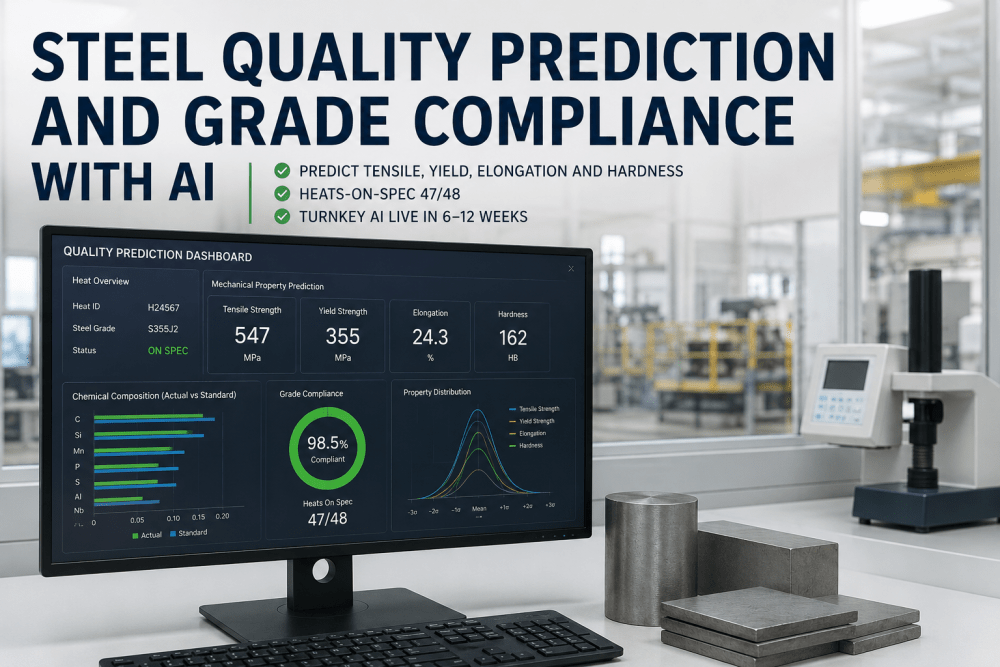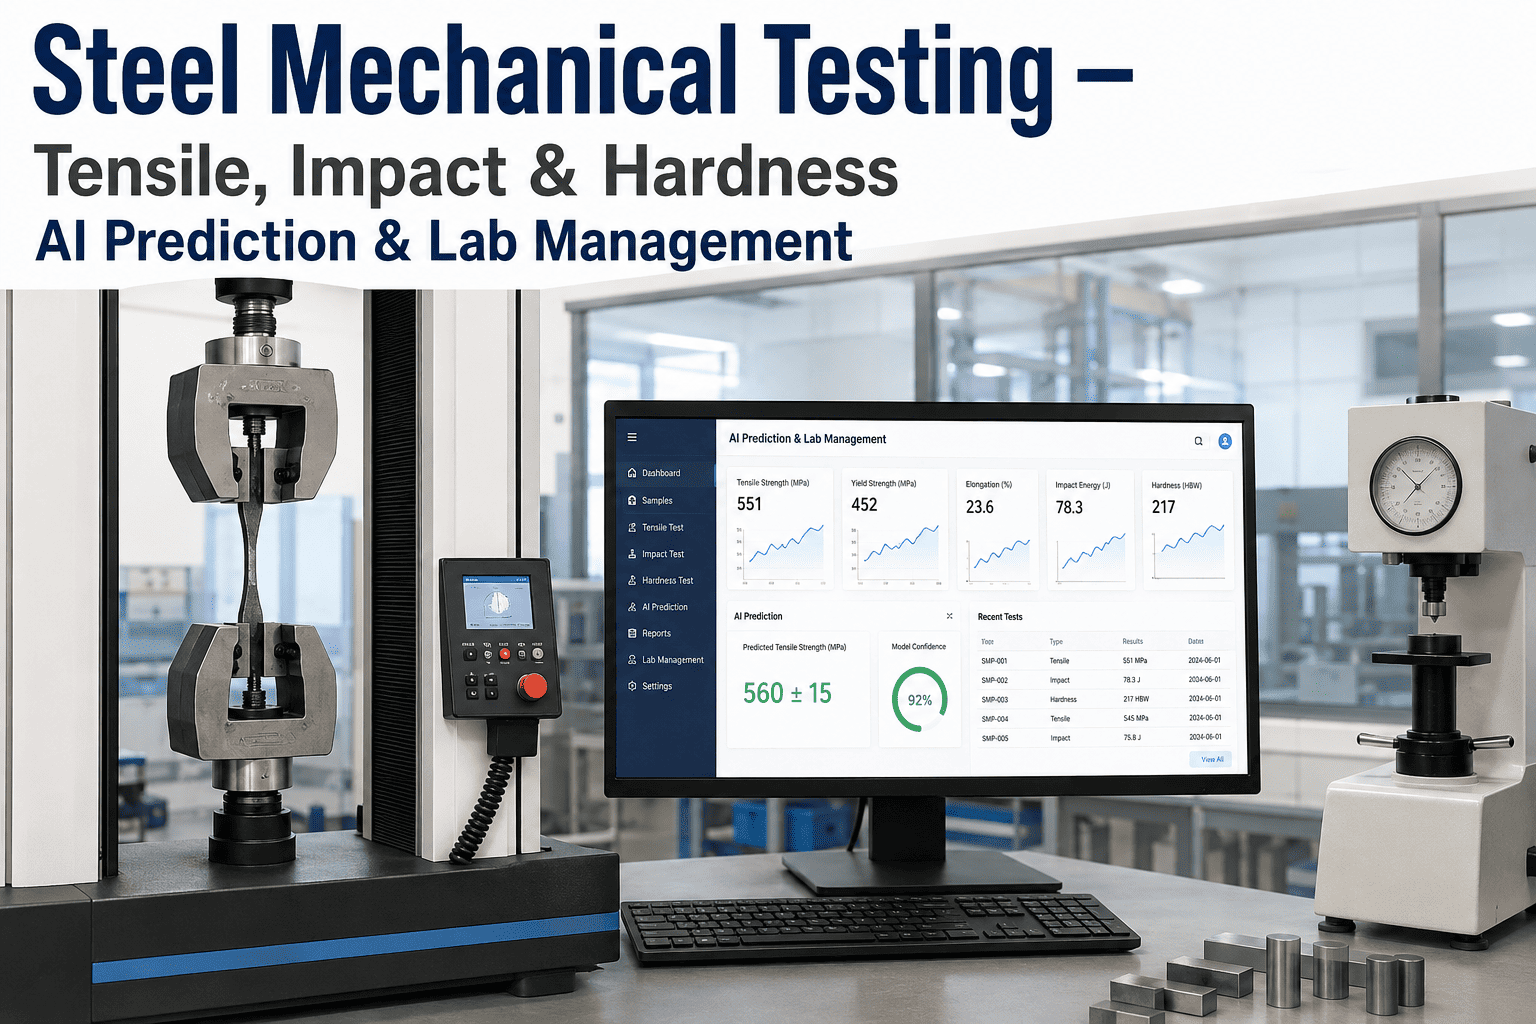
A quality lab running tensile, impact, and hardness tests on every qualifying heat is doing necessary work, but it's also usually running behind — samples queue for hours before a machine is free, results trickle back to production well after the next heat has already been cast, and by the time a marginal result triggers a hold, several more heats of the same grade may already be in process. Mechanical testing isn't the bottleneck because the tests themselves are slow; it's the bottleneck because most labs run reactively, testing everything to the same schedule regardless of how predictable that grade's properties actually are. This piece looks at where testing turnaround typically gets lost, what property prediction actually changes about lab workload, and how a demo can walk through your current testing queue and turnaround data.
Why Testing Turnaround Lags Production Even With Modern Equipment
The physical test itself — pulling a tensile specimen to failure, breaking an impact bar, or indenting a hardness sample — takes minutes. What actually extends turnaround is everything around the test: sample preparation queuing behind other grades, machine availability during peak shift testing volume, and manual data entry and review before a result is released back to production or shipping. A lab testing every qualifying heat to an identical schedule, regardless of how well-characterized that grade's typical property spread already is, spends the same testing capacity on a highly consistent, well-understood grade as it does on a grade with genuinely higher property variability that deserves closer scrutiny.
That undifferentiated approach means testing capacity isn't necessarily going where it adds the most risk reduction, and it's also why a marginal or borderline result on a fast-moving grade often surfaces only after several more heats of that grade have already been processed and are sitting in inventory or already shipped.
What Property Prediction Actually Adds
Property prediction models trained on chemistry, processing parameters, and historical test results for a given grade can estimate expected tensile, impact, and hardness values before physical testing completes, giving production an early read on whether a heat is trending toward the property window or drifting toward a marginal result. This doesn't replace physical testing for release purposes on most specifications — customer and standard requirements generally still call for actual test data — but it does let a lab prioritize testing capacity toward heats the prediction model flags as uncertain, while grades with tight, well-characterized historical property spread can be tested on a statistically justified reduced schedule where specifications allow.
| Test Type | Typical Bottleneck | What Prediction Adds |
|---|---|---|
| Tensile | Machine queue during peak shift volume | Early flag on heats trending toward marginal yield or elongation |
| Impact | Temperature-conditioning time before testing | Priority ranking so at-risk heats get conditioned and tested first |
| Hardness | Generally fast, but backlog during high volume | Used as a live cross-check against predicted tensile trend |
Statistical Compliance Still Comes First
Any reduction in physical testing frequency has to be justified against the actual specification requirement and supported by a defensible statistical basis, not just a model's confidence score. Most customer and standard specifications define minimum testing frequency explicitly, and where a reduced schedule is permitted based on demonstrated process capability, that permission usually requires an ongoing statistical case — ongoing capability studies, not a one-time justification — to remain valid. Property prediction supports building and maintaining that case with continuously updated data, rather than replacing the underlying compliance requirement itself.
What This Means for a Quality Manager's Lab
In practice, this changes how a quality manager allocates a fixed testing capacity across a variable production mix. Instead of every qualifying heat competing equally for machine time in arrival order, heats flagged by the prediction model as trending toward the edge of a property window get prioritized, while heats from grades with a long track record of tight, consistent results move through on a schedule that reflects that lower actual risk — provided the applicable specification allows it. That reprioritization tends to shorten the time between a genuinely marginal result occurring and it being caught, without requiring additional lab headcount or equipment.
It also strengthens the documentation available when a customer questions a specific heat's certification. Because the prediction and the actual test result for that heat are both part of the record, a quality manager can show not just that the heat passed, but that it was flagged appropriately and tested with priority given its predicted risk profile — a stronger position than a simple pass/fail certificate alone.