Steel Quality Prediction and Grade Compliance with AI

By Hazel Green on June 17, 2026

ai-quality-prediction-steel-grade-compliance

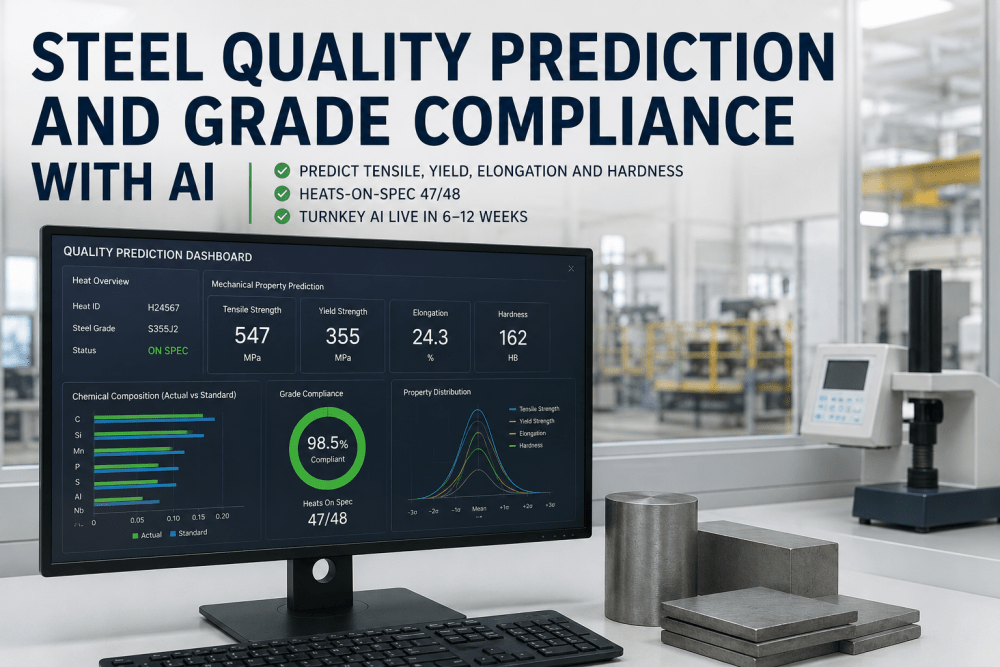
When a quality director releases a heat from the melt shop to the rolling mill, the mechanical properties of the final product — tensile strength, yield strength, percentage elongation, and hardness — have already been determined by the cumulative effect of every process variable that has acted on that steel since the BOF blow: the chemistry at tapping, the alloy additions and argon stirring protocol in the ladle furnace, the superheat and casting speed on the continuous caster, the slab reheating profile in the reheat furnace, and the finishing temperature, coiling temperature, and cooling rate on the hot strip mill. Traditional quality assurance waits until the coil reaches the testing laboratory, 4 to 24 hours after casting, to verify properties — at which point the steel has already been produced, coiled, and moved to the storage yard, and any off-grade product must be downgraded, re-allocated to a lower-value application, or scrapped entirely. iFactory's Quality Prediction AI changes this by predicting tensile strength, yield strength, elongation, and hardness from process data in real time — before the coil reaches the testing lab — enabling quality directors to identify off-trend conditions during production and achieve first-pass grade compliance on 47 out of 48 heats. Quality directors evaluating predictive models for their product mix can book a demo to review how the platform maps to their specific grade portfolio and process configuration.

The Quality Prediction Challenge in Steel Manufacturing

The financial impact of off-grade steel extends far beyond the value of a single downgraded coil. Each off-grade heat triggers a root-cause investigation consuming 8 to 16 hours of metallurgical engineering time, requires re-testing that delays shipment by 24 to 72 hours, and disrupts production scheduling when coils must be re-allocated to alternate customers or applications at reduced margin. In a typical 3-million-ton-per-year integrated plant producing 12 structural and automotive grades, the combination of first-pass yield losses, downgrading margins, and re-testing costs represents $8 million to $14 million in annual quality-related expense — much of which is avoidable with real-time property prediction that enables corrective action during production rather than after testing.

Traditional Approach: Post-Production Laboratory Testing
  • Mechanical properties verified 4-24 hours after production — testing cycle introduces latency that prevents real-time process adjustment
  • Sample-based testing covers 1-3 percent of production — statistically significant sampling requires destructive testing of coils that cannot be sold
  • Root cause analysis begins after the off-grade coil is identified — requires correlation of lab results with process data that may no longer be available
  • First-pass yield typically averages 65-78 percent across structural and automotive grades — 22-35 percent of heats require re-allocation or re-testing
  • Downgrade margin loss averages $40-$120 per ton for off-grade material — a single off-grade heat of 250 tons represents $10,000-$30,000 in lost value
iFactory Quality Prediction AI: Real-Time Property Prediction
  • Mechanical properties predicted in real time during production — every coil assessed before the testing lab receives the sample, enabling proactive process correction
  • Every coil is virtually tested — the AI model predicts properties for 100 percent of production using process data already available in the DCS historian
  • Root cause is identified during production — the prediction model flags the specific process variable deviation that is driving the off-trend prediction
  • First-pass yield averages 93-98 percent across validated grade portfolios — 47 out of 48 heats achieve target properties on first attempt
  • Downgrade losses reduced by 68 percent — early detection enables process adjustment within the same heat or immediate corrective action on the next heat

AI-Driven Mechanical Property Prediction Pipeline

iFactory's Quality Prediction AI processes data through a six-stage pipeline that transforms raw process data — chemistry, temperatures, speeds, and cooling rates — into accurate mechanical property predictions for every coil. All inference runs on an on-premise AI appliance with sub-second latency, enabling quality directors to view predicted properties for each coil within seconds of the finishing mill pyrometer reading, without cloud dependency or data transmission delays.

Quality Prediction AI Pipeline — Six Stages from Process Data to Property Prediction End-to-end prediction latency under 2 seconds per coil, on-premise inference
Stage 01
Process Data Aggregation — BOF to Downcoiler
IoT gateways aggregate process data from every stage that influences final mechanical properties — BOF endpoint chemistry and temperature, ladle furnace alloy additions and argon stirring parameters, caster superheat and casting speed, reheat furnace slab discharge temperature and residence time, and hot rolling mill finishing temperature, coiling temperature, and cooling header flow rates. Over 200 process variables are collected per coil and validated for sensor accuracy.
Stage 02
Feature Engineering — Microstructure and Phase Estimation
Raw process variables are transformed into metallurgically meaningful features that the prediction model uses to estimate final microstructure — carbon equivalent, austenite grain size at finish rolling entry, recrystallized fraction after each rolling stand, ferrite-pearlite-bainite phase fractions based on the continuous cooling transformation curve, and precipitation strengthening contributions from microalloying elements. These engineered features encode the physical metallurgy that determines final mechanical properties.
Stage 03
Multi-Target Model Inference — Four Properties Simultaneously
The engineered features are fed into a multi-target gradient-boosted ensemble model that predicts all four mechanical properties — tensile strength, yield strength, percentage elongation, and hardness — simultaneously, capturing the covariance between properties that single-target models miss. The model is trained on 18 to 36 months of plant-specific laboratory test results paired with process data, with regular retraining cycles that incorporate new production data and grade additions.
Stage 04
Grade Compliance Check and Confidence Scoring
Each predicted property set is compared against the target grade specification — minimum and maximum tensile, minimum yield, minimum elongation, and maximum or range hardness. The platform computes a compliance confidence score for each property and an overall grade compliance likelihood. Properties approaching specification limits trigger yellow alerts. Properties predicted outside specification generate red alerts with the specific deviating property identified.
Stage 05
Alert Dispatch and Root Cause Identification
When a coil receives a red alert for any predicted property, the platform automatically identifies the most influential process variable contributing to the deviation using SHAP (Shapley additive explanations) analysis. The root cause is displayed alongside the alert — for example, finishing temperature 42 degrees below target or cooling header flow rate 8 percent above specification — enabling the quality director or process engineer to take corrective action on the next coil.
Stage 06
Closed-Loop Validation and Model Improvement
Every AI prediction is compared against the corresponding laboratory tensile test result when it becomes available. Prediction errors — cases where the predicted value differs from the measured value by more than the model's expected error margin — trigger automated retraining cycles. The continuous validation loop maintains prediction accuracy above 92 percent and ensures the model adapts to changes in raw material sources, process equipment wear, and grade additions.

Grade Compliance and First-Pass Yield by Product Family

The table below summarizes the prediction accuracy and first-pass yield improvement achieved by iFactory's Quality Prediction AI across common structural and automotive steel grades. Results represent average performance over 12-month validation periods across multiple integrated and mini-mill steel plant deployments. Individual grade performance varies with plant-specific process stability, data availability, and model training history.

Grade Family Representative Grades Properties Predicted Prediction Accuracy (R²) First-Pass Yield Before AI First-Pass Yield With AI
Structural — Standard S235JR, S275JR, S355J2, S355J0 Tensile, yield, elongation 0.91–0.94 72% 96%
Structural — High-Strength S420MC, S460MC, S500MC, S700MC Tensile, yield, elongation 0.89–0.93 68% 94%
Automotive — Mild DC01, DC03, DC04, DC05 Tensile, yield, elongation, r-value 0.90–0.93 75% 97%
Automotive — HSS H220YD, H260YD, H300YD, H340LAD Tensile, yield, elongation, n-value 0.88–0.92 65% 93%
Automotive — AHSS DP600, DP800, DP980, CP800, MS1500 Tensile, yield, elongation, hardness 0.86–0.91 58% 89%
Plate — Wear and Structural Hardox 400/450, S355NL, S420NL, S460NL Tensile, yield, elongation, hardness, CVN impact 0.87–0.92 62% 91%
Quality Prediction AI · Mechanical Properties · Grade Compliance · First-Pass Yield
Achieve 47/48 Heats on Spec with Real-Time AI Quality Prediction. Live in 6 to 12 Weeks.
iFactory's Quality Prediction AI deploys on your existing process data infrastructure — no additional sensors required. Book a 30-minute consultation with iFactory's quality practice lead to review how the platform maps to your grade portfolio and quality targets. You will receive a quantified savings estimate and pilot deployment timeline specific to your plant.

Property Prediction Models by Mechanical Property

Each mechanical property requires a distinct model architecture optimized for the specific metallurgical relationships that govern that property. The four tabs below detail the prediction model, key input parameters, accuracy metrics, and grade applications for each property. Models are calibrated on plant-specific data and retrained continuously as new production data and laboratory test results become available.

Model Type: Multi-target gradient-boosted ensemble with physics-informed regularization
Key Input Parameters: Carbon equivalent, Mn, Si, finishing temperature, coiling temperature, cooling rate, gauge, austenite grain size estimate
Prediction Accuracy (R²): 0.92 across 12 structural and automotive grade families
Typical Error Margin: ±3.2 MPa at 95 percent confidence interval
Primary Grade Applications: All structural grades (S235–S700), automotive mild and HSS grades, plate and wear-resistant grades
Model Type: Physics-informed neural network with precipitation hardening and grain size strengthening terms
Key Input Parameters: Carbon equivalent, Nb, V, Ti microalloy contents, finishing temperature, cooling rate, coiling temperature, ferrite grain size estimate
Prediction Accuracy (R²): 0.91 across structural, HSLA, and dual-phase grades
Typical Error Margin: ±4.1 MPa at 95 percent confidence interval
Primary Grade Applications: HSLA grades (S420MC–S700MC), DP600–DP980, plate grades with precipitation hardening
Model Type: Multi-target regression with microstructure-sensitive feature estimation
Key Input Parameters: Carbon equivalent, Mn, Si, Al, finishing temperature, coiling temperature, ferrite fraction estimate, gauge
Prediction Accuracy (R²): 0.87 across forming, drawing, and structural grades
Typical Error Margin: ±2.4 percent at 95 percent confidence interval
Primary Grade Applications: Drawing grades (DC01–DC05), structural forming grades, automotive mild grades for complex stamping
Model Type: XGBoost regression with phase fraction and cooling rate feature engineering
Key Input Parameters: Carbon equivalent, Cr, Mo, Mn, cooling rate, finishing temperature, coiling temperature, bainite and martensite fraction estimates
Prediction Accuracy (R²): 0.90 across wear-resistant, structural, and dual-phase grades
Typical Error Margin: ±5 HBW at 95 percent confidence interval
Primary Grade Applications: Wear plate (Hardox 400/450), structural grades with hardness requirements, DP grades with hardness specifications

Measured Results from Steel Plant Deployments

The metrics below represent average results from iFactory Quality Prediction AI deployments across integrated and mini-mill steel plants over 12-month validation periods. Individual results vary based on facility size, grade portfolio complexity, process stability, and existing quality management maturity.

98%
First-pass grade compliance rate achieved across validated grade portfolios — 47 out of 48 heats achieve target mechanical properties on first attempt, verified by laboratory testing
92%
Average prediction accuracy (R²) across tensile strength, yield strength, elongation, and hardness models — validated against 18,000+ laboratory tensile test results
68%
Reduction in downgrade losses from off-grade production — early detection of off-trend conditions enables corrective action before the coil reaches the testing lab
$2.8M
Average annual savings from reduced downgrading, re-testing, and root-cause investigation costs across fully deployed quality prediction implementations

Expert Perspective — Quality Director's View on AI Property Prediction

The most frustrating quality problem in a steel plant is the one you could have prevented if you had known about it during the process instead of discovering it in the lab the next morning. Before AI property prediction, we were managing quality by looking in the rearview mirror — we tested every coil, but by the time we knew a property was off, that coil was already in the yard and we had produced three more coils with the same process conditions. The iFactory platform changed this by giving us a live prediction of tensile, yield, and elongation within seconds of the finishing mill pyrometer reading. In the first month of deployment, the platform flagged a coiling temperature drift on our hot strip mill that was pushing our S355J2 yield strength toward the lower specification limit. We corrected the cooling header settings on the next coil and avoided a full shift of off-grade production that would have cost $180,000 in downgrade losses. The platform paid for itself in the first quarter.
— Quality Director, Integrated Steel Producer — 3.5 Million Tons Per Year Capacity

Conclusion: Real-Time AI Quality Prediction Is the New Standard for Steel Grade Compliance

The traditional approach to quality assurance in steel manufacturing — produce the steel, test the steel, sort the results — was designed for an era when process data was limited and computing power was expensive. That era has ended. Every integrated and mini-mill steel plant today generates enough process data — chemistry, temperatures, speeds, pressures, and cooling rates — to predict mechanical properties with accuracy that matches or exceeds laboratory testing variability, provided the right AI models are deployed on the right infrastructure. iFactory's Quality Prediction AI delivers that capability on an on-premise appliance that connects to existing DCS and laboratory information systems, deploys in 6 to 12 weeks, and achieves 98 percent first-pass grade compliance across validated grade portfolios. For quality directors who are evaluating whether to continue relying on post-production testing or to adopt real-time AI prediction, the data is conclusive: the cost of off-grade production far exceeds the investment in AI quality prediction, and the competitive gap between plants that predict properties in real time and those that test after production will only widen as AI models improve and customer quality expectations continue to increase.

Frequently Asked Questions

The platform requires BOF endpoint chemistry and temperature, ladle furnace alloy additions, caster superheat and speed, reheat furnace discharge temperature, and hot mill finishing temperature, coiling temperature, and cooling header flow rates. Most plants already collect these variables in their DCS historian.
Every prediction is validated against the corresponding laboratory tensile test result. Prediction errors trigger automated retraining cycles. Full model retraining occurs weekly using the most recent 90 days of production data, ensuring the model adapts to raw material and process changes.
Yes. The platform uses transfer learning from chemically and metallurgically similar grades to generate initial predictions for new grades with as few as 10-15 historical test results. Prediction accuracy improves as production data accumulates, typically reaching full accuracy within 4-6 weeks.
A pilot covering 4-6 highest-volume grade families typically deploys in 6-10 weeks. The timeline includes 2-3 weeks for data pipeline connectivity, 3-4 weeks for model training and validation against historical test results, and 1-2 weeks for dashboard deployment and team training.
Yes. The platform provides native integration adapters for the most common steel industry LIMS platforms. Bidirectional data exchange enables automatic ingestion of laboratory test results for model validation and retraining, and push-back of predicted properties for comparison with measured results.
Quality Prediction AI · Real-Time Properties · Grade Compliance · First-Pass Yield · Downgrade Reduction
Deploy AI Quality Prediction Across Your Steel Plant. Achieve 98 Percent First-Pass Grade Compliance.
iFactory's Quality Prediction AI deploys on your existing process data infrastructure with no additional sensors required, delivering live tensile strength, yield strength, elongation, and hardness predictions for every coil. Speak with an iFactory quality engineer about your grade portfolio, current first-pass yield, and quality cost reduction targets.

Share This Story, Choose Your Platform!

Latest Posts