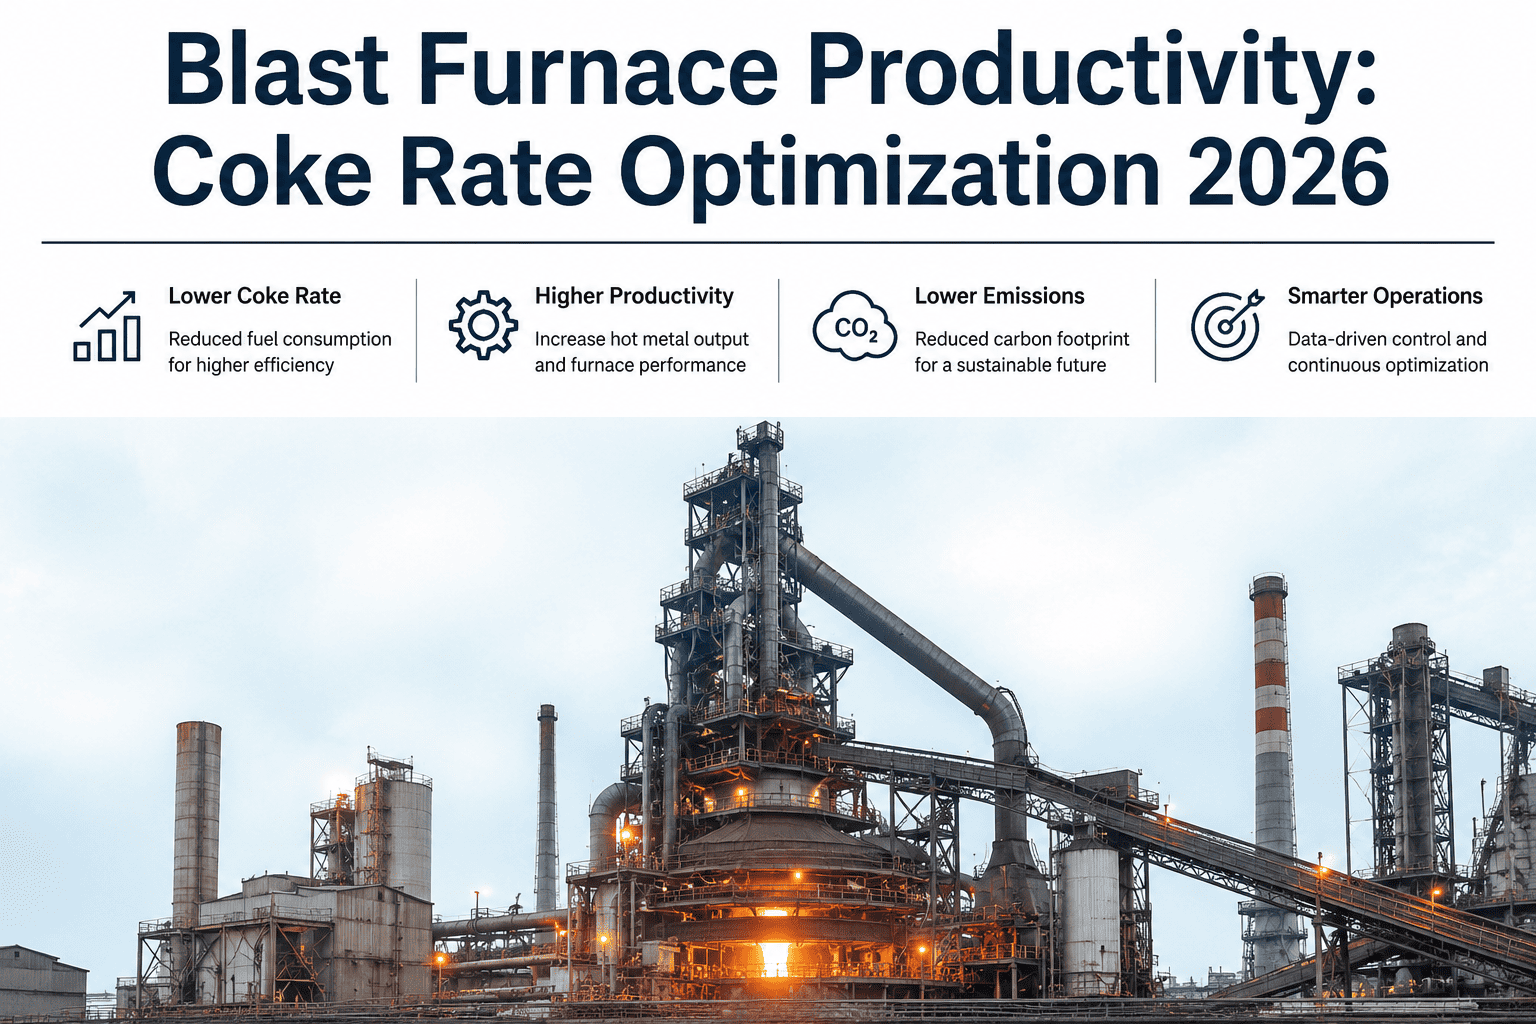
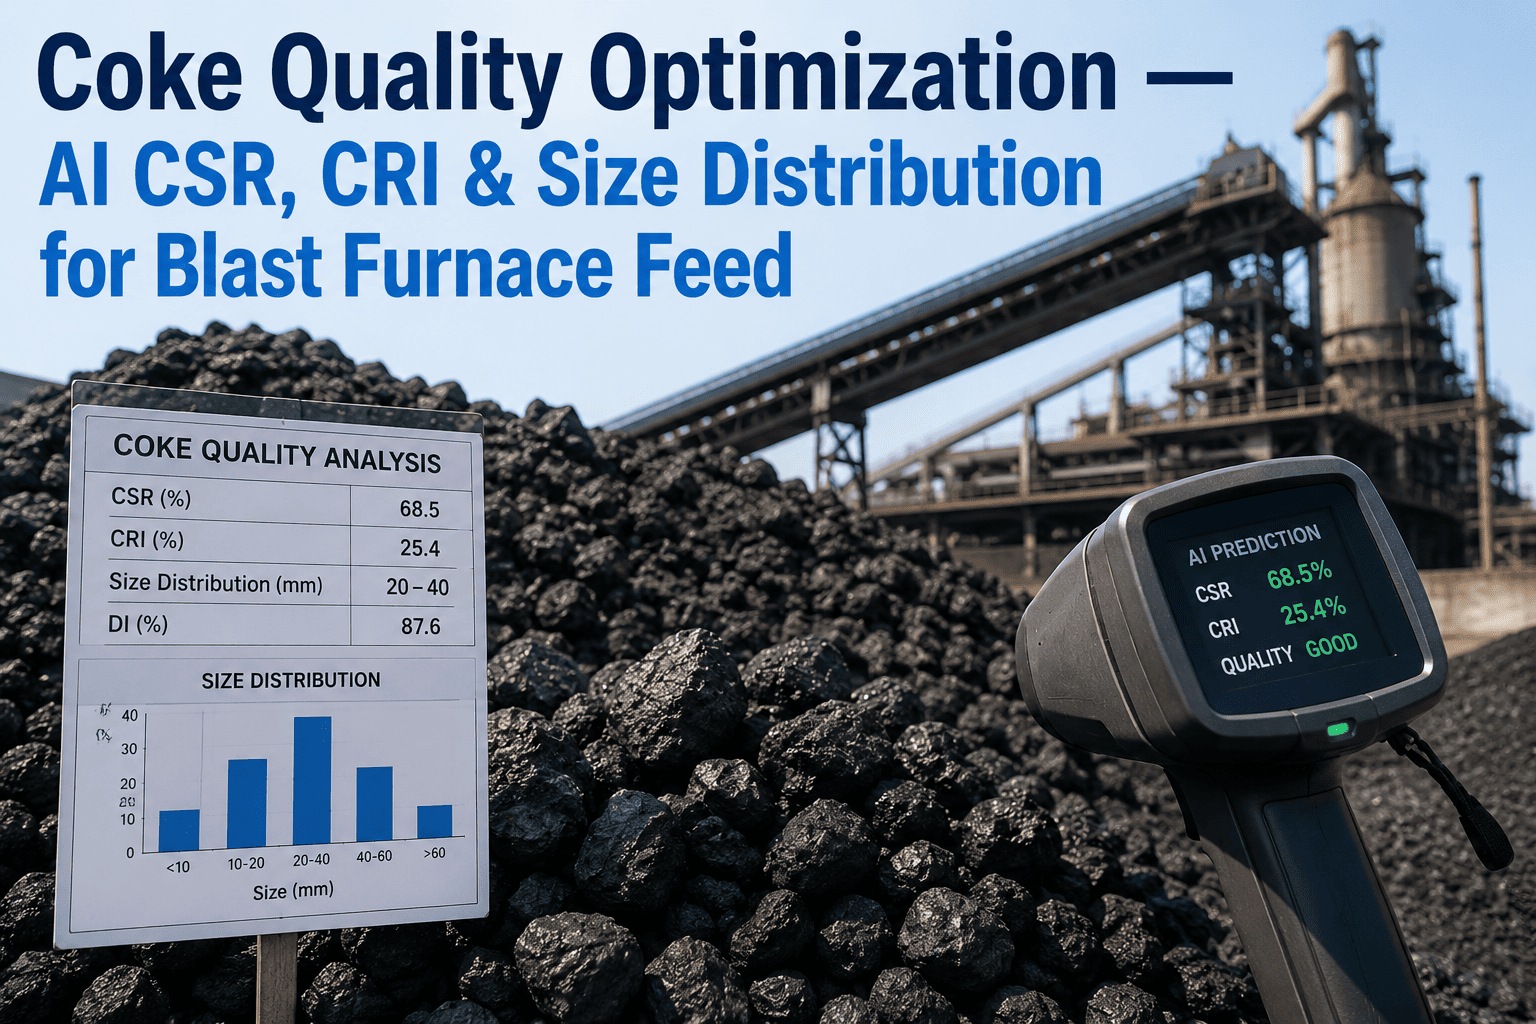
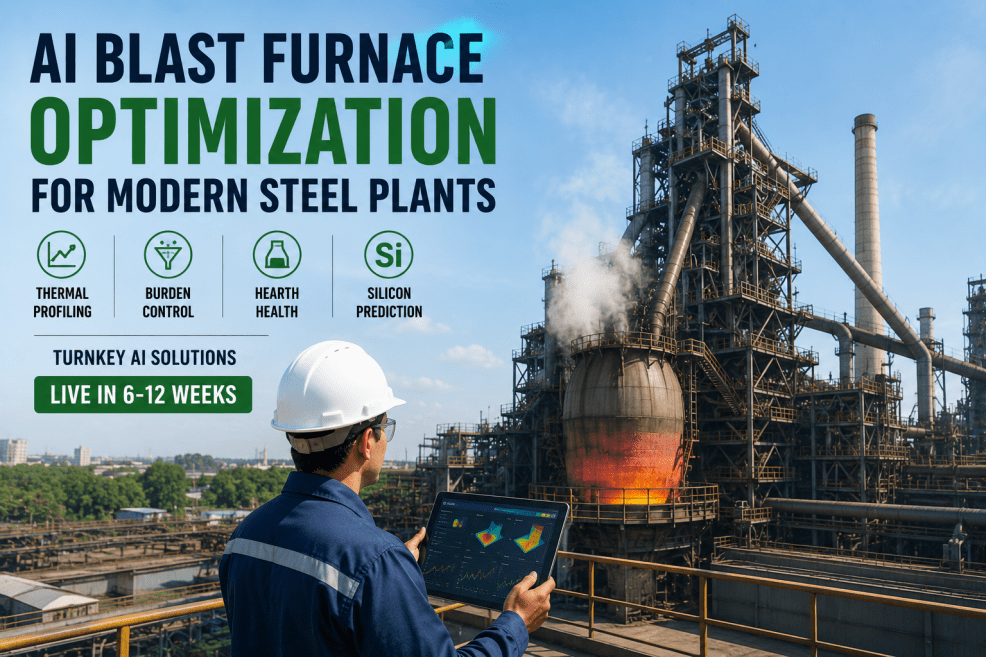
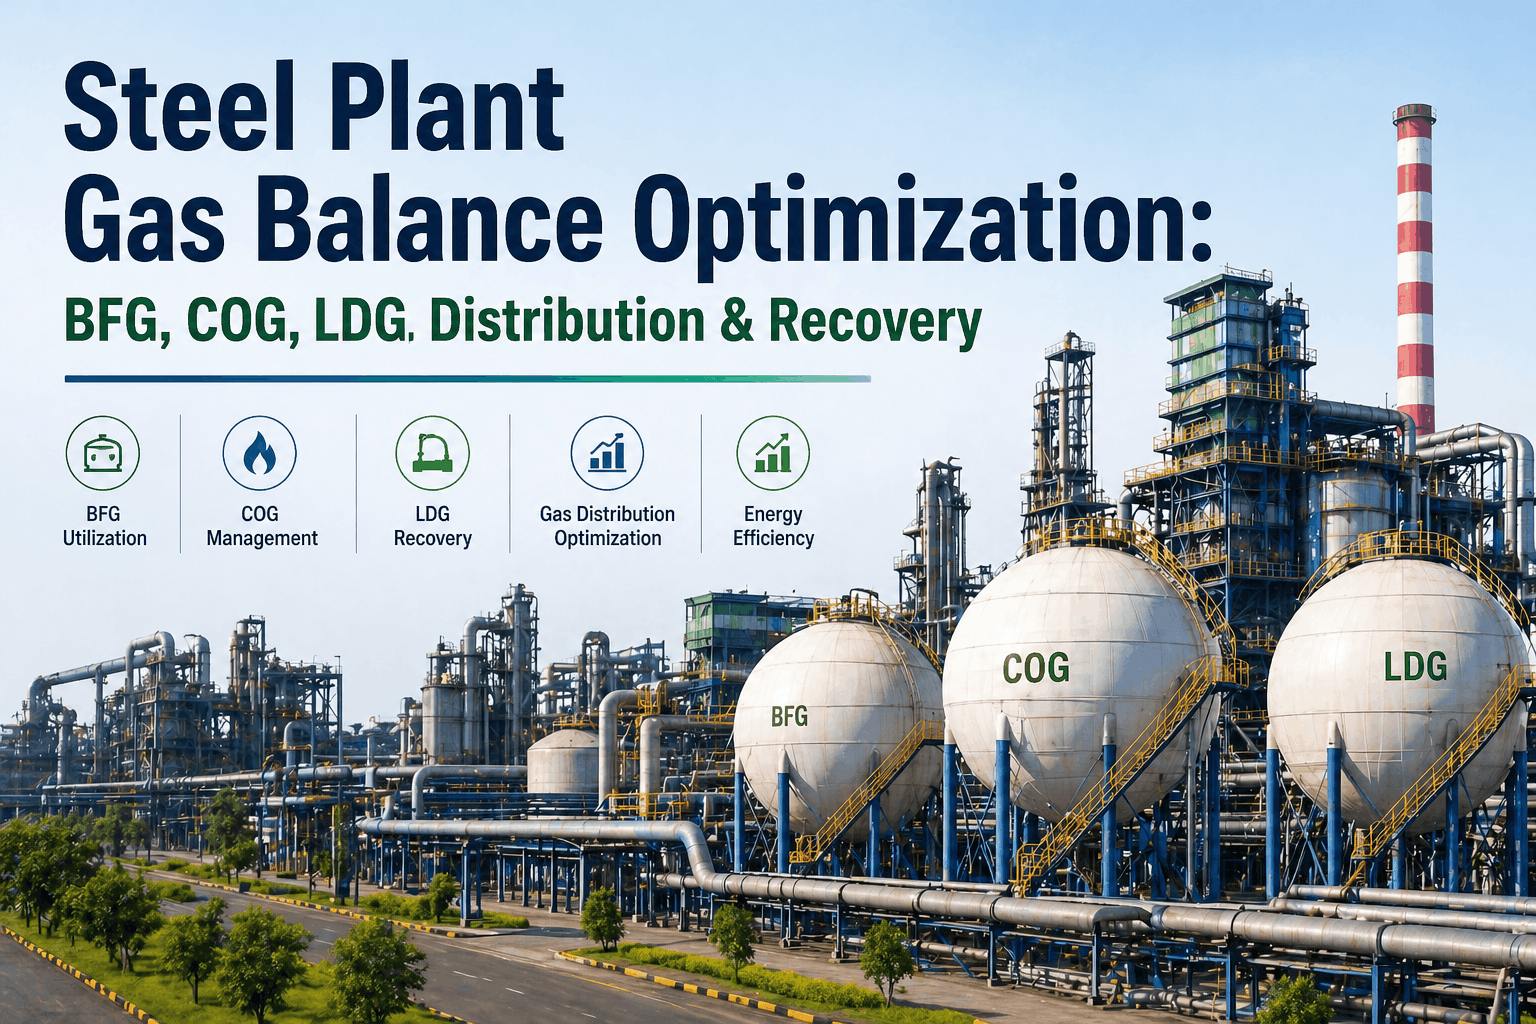
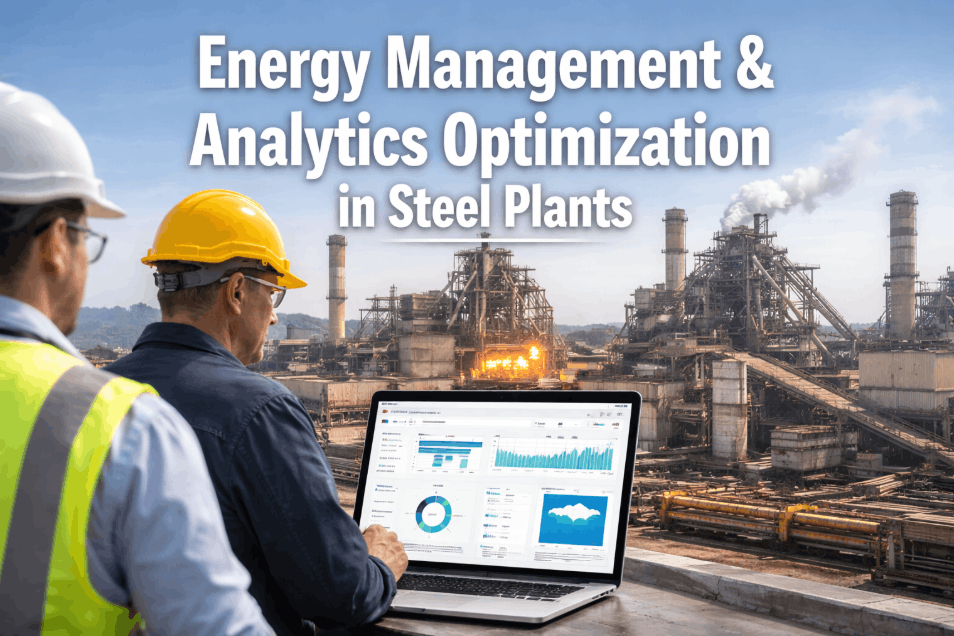
An integrated steel plant is not just a steelmaking operation — it is a miniature energy economy. Oxygen, nitrogen, argon, steam, compressed air, and three species of byproduct gas (COG, BFG, BOFG) flow continuously between dozens of production units, each with fluctuating demand that rarely matches supply. When a BOF blows oxygen at supersonic velocity for 20 minutes and then idles for 25, the air separation unit cannot ramp down and back up fast enough — so excess oxygen vents to atmosphere while the next heat queues up. When two BOFs blow simultaneously, oxygen demand spikes 40–60% above baseline and the gas holder runs dry. Meanwhile, 26.4% of BOF gas is flared globally, 20–30% of compressed air energy is lost to leaks, and steam trap failures bleed thermal energy invisibly across kilometers of distribution piping. The gap between "supplying utilities" and "optimizing utilities" is where $3–8 million per year disappears in a typical 2 MTPA integrated plant. iFactory deploys AI-powered utilities optimization for steel plants — book a 30-minute consultation to see where your utilities budget is leaking.
Utilities & Gas Balance Optimization
Balance Every Gas.
Recover Every Joule.
Waste Nothing.
AI-Driven Optimization of Oxygen, Nitrogen, Argon, Steam, Compressed Air & Byproduct Gas Networks for Integrated Steel Plants
Book a Free Consultation
26.4%
Of BOF Gas Flared Globally — Zero Energy Recovery
20–30%
Of Compressed Air Energy Lost to Leaks in Typical Plants
6–10 GJ/t
Recoverable Energy in Byproduct Off-Gases Per Tonne Steel
$3–8M
Annual Utilities Waste in a Typical 2 MTPA Integrated Plant
The Six Utility Streams That Make or Break Your Plant's Efficiency
Every integrated steel plant manages six interconnected utility streams. Each has unique demand patterns, loss mechanisms, and optimization potential. AI transforms these from isolated supply systems into a coordinated energy network where surplus from one process feeds demand in another — in real time.
Industrial Gases
Oxygen (O2)
50–80 Nm3 per tonne of crude steel
Blast furnace enrichment, BOF lancing (supersonic injection), EAF burners, ladle refining, scarfing
BOF oxygen demand spikes 40–60% during blowing cycles, then drops to near-zero between heats. Simultaneous blows from multiple BOFs create extreme peaks that force venting from the ASU.
AI predicts oxygen demand 15–30 minutes ahead by modeling BOF tap-to-tap schedules and BF operating state — pre-adjusting ASU load and gas holder levels to absorb peaks without venting.
Industrial Gases
Nitrogen (N2) & Argon (Ar)
N2: 30–50 Nm3/t steel | Ar: 3–4.5 Nm3/t steel
N2: pipeline purging, BF tuyere cooling, caster shielding, equipment blanketing. Ar: ladle stirring, tundish sealing, AOD decarburization, continuous casting protection
Over-purging and excessive blanketing consume 15–25% more nitrogen than required. Argon waste during ladle changeovers and tundish preheating adds up silently across hundreds of heats.
AI right-sizes purge flows based on actual process requirements and ambient conditions, reducing nitrogen overconsumption by 10–18% and argon waste during transition periods.
Thermal Utilities
Steam
0.3–0.8 tonnes steam per tonne of crude steel
Turbine drives, vacuum degassing, coke oven heating, sinter plant ignition, reheating furnace atomization, building heating, deaeration
Steam trap failure rates of 15–25% in aging plants bleed thermal energy across kilometers of distribution piping. Header pressure imbalances cause simultaneous venting and supplementary firing in different plant sections.
AI monitors steam header pressures and flow rates continuously, detecting trap failures within hours (vs. annual surveys), and rebalancing generation across WHR boilers and auxiliary boilers.
Pneumatic Systems
Compressed Air
15–25% of plant electrical load
Pneumatic controls, instrumentation, bag filters, material handling, equipment actuation, blast furnace tuyere cooling
Compressed air systems in unmaintained plants waste 20–30% of compressor output through leaks. A single 1/16-inch leak costs over $1,000/year in electricity. Large plants have hundreds of leak points accumulating to $200K–$600K in annual waste.
AI correlates compressor load against actual demand to detect leakage trends, identifies pressure drop anomalies indicating new leaks, and schedules compressor sequencing to minimize partial-load inefficiency.
Cooling Systems
Water (Cooling & Process)
25–100 m3 per tonne of crude steel
BF tuyere and hearth cooling, BOF lance cooling, caster mold cooling, rolling mill descaling, gas cleaning, slag granulation
Cooling circuit fouling reduces heat transfer efficiency by 10–20%, forcing higher water flow rates and pump energy. Scale buildup in closed loops accelerates corrosion and increases maintenance costs.
AI monitors cooling circuit delta-T across each heat exchanger, detecting fouling progression weeks before performance drops below threshold, and optimizing chemical dosing schedules.
Byproduct Gases
COG + BFG + BOFG Network
6–10 GJ recoverable energy per tonne of steel
COG: coke underfiring, BF injection, power gen. BFG: hot stoves, power gen, sinter ignition. BOFG: power gen, reheating furnaces, lime kilns
Gas production is intermittent and unpredictable. COG production depends on coking schedules. BFG volume fluctuates with BF operating state. BOFG is produced only during oxygen blowing. Without coordinated scheduling, surplus gas goes to flare.
AI models gas production from each source 15–60 minutes ahead, coordinates gas holder levels, and dynamically routes surplus to highest-value consumers — prioritizing power generation over flaring.
The Gas Balance Problem: Why Flaring Is a Scheduling Failure, Not an Inevitability
A 3 MTPA integrated steel plant generates approximately 800,000–1,200,000 Nm3/hour of mixed byproduct gases. The calorific value ranges from 3.0 MJ/Nm3 for lean BFG to 17–18 MJ/Nm3 for rich COG. The challenge is not production — it is timing. Gas supply fluctuates minute-by-minute while consumer demand shifts with production schedules. Gas holders provide limited buffer capacity, and when they overflow, the flare stack ignites.
Gas Supply Side (Variable)
Coke Ovens
COG at 17–18 MJ/Nm3 — relatively steady during coking cycles, drops during oven changeovers. ~40% recycled for underfiring, ~60% available for export.
Blast Furnaces
BFG at 3.0–3.5 MJ/Nm3 — highest volume, lowest CV. Production varies with BF operating intensity, burden changes, and irregularities. 5.5% flared globally.
BOF Converters
BOFG at 7–9 MJ/Nm3 — produced only during 15–20 minute oxygen blow cycles, then zero output for 25+ minutes. 26.4% flared globally due to intermittency.
Gas Consumer Side (Schedulable)
Power Plant / CPP
Largest gas consumer — flexible enough to absorb surplus BFG/COG within turbine ramp constraints. AI pre-loads boilers ahead of predicted gas surges.
Hot Blast Stoves
Consume enriched BFG/COG mix for hot blast generation. Stove cycling creates periodic demand dips. AI coordinates stove change timing with gas availability.
Reheating Furnaces
Can switch between BFG/COG/BOFG/natural gas. AI shifts fuel mix toward highest-availability byproduct gas, reducing purchased natural gas consumption.
15–25%
Reduction in external energy purchases with optimized gas network
60–80%
Reduction in flaring events through predictive gas holder management
$1.5–4M
Annual savings from improved byproduct gas recovery alone
What AI Catches That Manual Monitoring Cannot
Utility systems generate thousands of data points per minute. A human operator watching six SCADA screens can track trends — but cannot correlate a BFG pressure drop at the gas holder with a stove cycling event, a compressor load spike in the mill section, and a steam header imbalance at the coke plant all happening within the same 10-minute window. AI can.
Oxygen System
ASU venting during simultaneous BOF blows — oxygen produced but not consumed, vented to atmosphere at $0.03–0.05/Nm3
AI staggers BOF blow schedules by 5–8 minutes to flatten oxygen demand peaks, reducing venting by 30–50%
Steam Network
Failed steam traps losing 25–50 kg/hr of live steam each — in a plant with 2,000+ traps, 15–25% failure rate bleeds $300K–$800K/year
AI detects trap failures via temperature differential analysis on downstream piping within hours, not during annual surveys
Compressed Air
Compressor running at 85% capacity while plant demand is only 60% — the 25% gap is leak load invisible in aggregate pressure readings
AI tracks compressor load vs production-correlated demand baseline, quantifying leak load growth week-over-week
Gas Network
BFG holder approaching overflow during BF irregularity — manual response takes 8–15 minutes, by which time flare is already burning
AI predicts holder overflow 10–20 minutes ahead using BF top gas analysis trends and pre-ramps power plant boiler intake
Cooling Water
Cooling tower approach temperature rising 2–3°C over weeks — fouling reduces heat rejection, increasing pump energy 8–12%
AI flags delta-T degradation trends per circuit, scheduling chemical dosing and cleaning before efficiency loss compounds
Nitrogen System
Continuous purging on idle equipment consuming 15–25% more N2 than required, invisible when buried in aggregate ASU output data
AI correlates nitrogen flow per consumer against equipment operating state, flagging over-purging on idle or standby units
The iFactory Utilities Optimization Platform
iFactory connects to your existing SCADA, DCS, and utility metering infrastructure — no control system modifications required. The platform delivers a centralized utilities command center that makes every gas flow, steam header, compressor load, and cooling circuit visible in real time, with AI-generated optimization recommendations.
Frequently Asked Questions
How much can AI reduce utilities costs in an integrated steel plant?
Typical savings range from $3–8 million per year for a 2 MTPA integrated plant. The largest savings come from byproduct gas recovery optimization ($1.5–4M/year), followed by compressed air leak reduction ($200K–600K), steam system efficiency ($300K–800K), and oxygen/nitrogen right-sizing ($200K–500K). Most plants see positive ROI within 6–12 months.
How does the platform handle the intermittent nature of BOF gas production?
The AI engine models BOF operating schedules — including tap-to-tap timing, scrap charging, and oxygen blowing duration — to predict BOFG production 10–20 minutes ahead. It pre-positions gas holders and pre-ramps power plant boiler intake before the gas arrives, capturing energy that would otherwise go to flare. The same logic applies to managing oxygen demand peaks during simultaneous BOF blows.
Can the platform detect individual steam trap failures?
Yes. The platform monitors temperature differentials on steam lines downstream of traps continuously. A failed trap (stuck open or stuck closed) creates a measurable temperature signature that AI detects within hours. This replaces the traditional annual manual survey model, where failed traps bleed energy undetected for months. Plants with 2,000+ traps and 15–25% failure rates recover $300K–$800K annually from faster detection.
What integration is required?
iFactory connects to existing SCADA, DCS, and utility metering via OPC-UA, Modbus TCP, MQTT, and REST APIs. No control system modifications are required. The platform reads data from flow meters, pressure transmitters, temperature sensors, power meters, and gas analyzers already installed in your plant — wrapping them into a unified analytics layer. Deployment takes 4–6 weeks.
Your Utilities Are Not a Cost Center. They Are an Optimization Goldmine.
iFactory deploys AI-powered utilities optimization for steel plants — balancing gas networks, right-sizing industrial gas consumption, detecting leaks and losses, and turning byproduct waste into recovered energy. Every Nm3 tracked. Every trap monitored. Every flare event predicted and prevented.