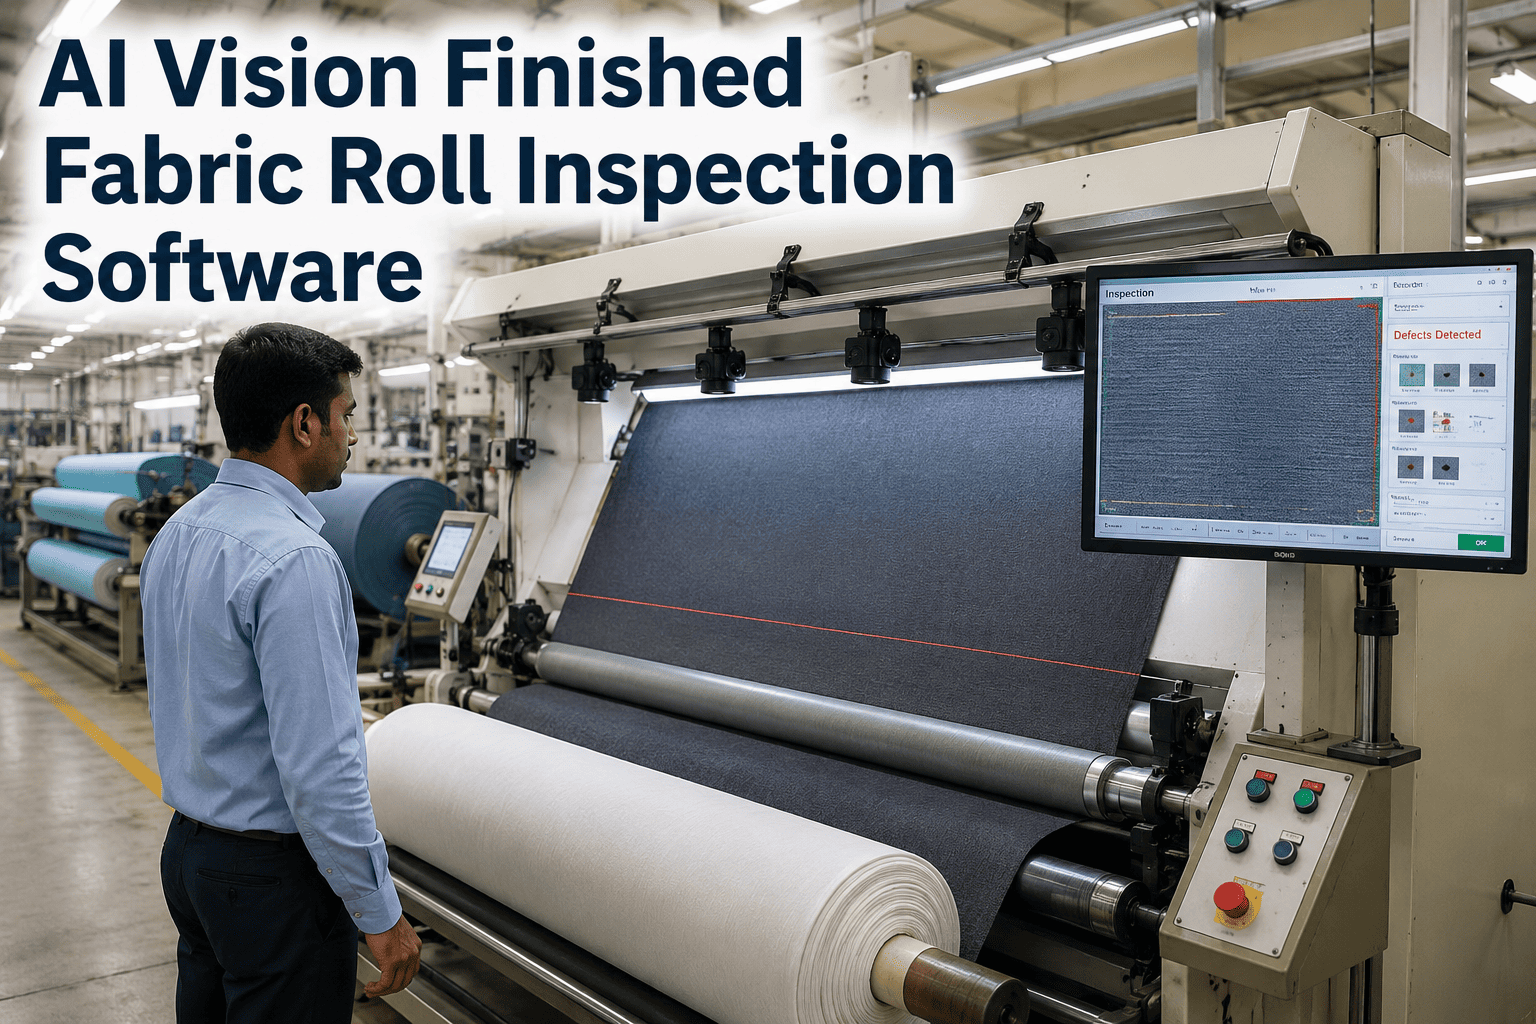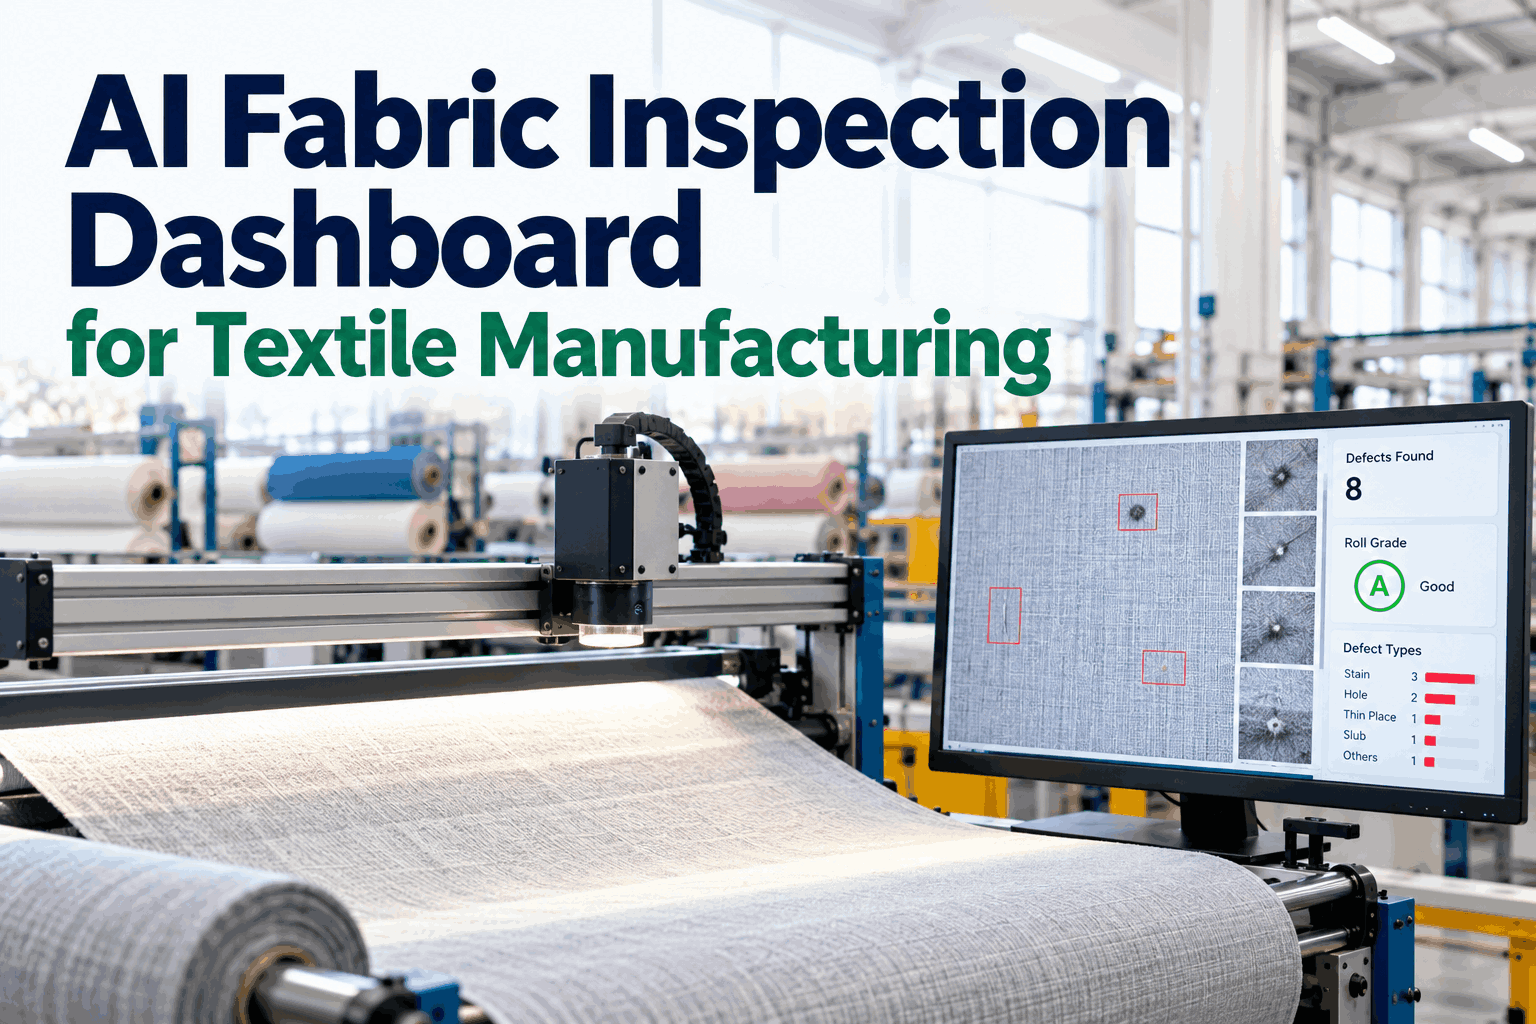
An AI inspection system can find thousands of defects a day. That is only useful if the right people see the right numbers in time to act on them. Too many inspection dashboards show everything and help with nothing: dozens of charts, no clear owner and no link back to the rolls and machines behind the numbers. This article sets out the views a fabric inspection dashboard actually needs, the metrics and formulas behind them, how roll grades should be shown, and who uses what. It is built around three things every mill cares about: defects, rolls and grades. For a live look at a working dashboard, book a short walkthrough.
AI Fabric Inspection Dashboard: Defects, Rolls and Grades in One Live View
Every defect found by AI vision rolled up into roll grades, loom patterns and shift trends, so QC, weaving and dyeing see the same numbers at the same time.
Why Most Inspection Dashboards Go Unused
Inspection data used to be scarce. With AI vision on the frame, it becomes abundant: every defect has a type, size, position, image and time. The temptation is to chart all of it. The result is a screen nobody reads, because it does not answer anyone’s question.
A useful dashboard starts from decisions. The inspector needs to know which calls to confirm. The QC manager needs to know which rolls to hold. The weaving supervisor needs to know which looms to check. The plant head needs to know whether quality is getting better or worse. Each of those is a different view with a different refresh rate, and each has to link down to the rolls and images behind it.
The market is moving this way. Persistence Market Research projects the fabric inspection machine market to reach about US$240 million by 2030, growing 5.2% a year, as mills add automation. The value comes from what is done with the data, which we can explore on a call.
The Five Views Every Fabric Inspection Dashboard Needs
Five views cover almost every decision around fabric inspection. More can be added later, but these should come first.
Each view links to the next. A spike on the Pareto opens the rolls behind it, a roll opens its defect map, and a defect opens its image and source machine. That drill-down is what makes a dashboard trustworthy, and it is easy to see in a demo.
The Metrics Behind the Views
Every number on the dashboard needs a clear definition. When two departments calculate first-quality yield differently, the dashboard becomes a source of arguments instead of decisions.
| Metric | How it is calculated | What it tells you |
|---|---|---|
| Points per 100 sq yd | Total points × 3,600 ÷ (cuttable width in inches × yards) | Roll quality on a comparable basis |
| First-quality rate | Rolls passing the buyer limit ÷ rolls inspected | Share of output sold at full price |
| Defects per 100 m | Defects found ÷ meters inspected × 100 | Defect density, independent of points |
| Rolls on hold | Rolls awaiting a decision at the end of a shift | Decision backlog in QC |
| Meters inspected per hour | Meters through each frame ÷ running hours | Inspection capacity and bottlenecks |
| AI and inspector agreement | Calls confirmed unchanged ÷ calls reviewed | How well the model fits your fabrics |
| Repeat defect rate | Defects matching an open source issue ÷ all defects | Whether upstream fixes are working |
Two of these metrics deserve special attention. The agreement rate between AI and inspectors shows whether the model is ready to take on more of the work, and it should be tracked by defect type, since a model can be excellent on holes and still weak on subtle shade streaks. The repeat defect rate shows whether upstream fixes are holding. If it does not fall after a loom is repaired, the fix did not address the real cause.
Agree these definitions before go-live and keep them in one place. The dashboard should show the formula behind any number with one click, which our engineers set up during configuration.
Showing Roll Grades People Can Act On
The four-point score is the input; the grade is the decision. A clear grading scheme, shown the same way everywhere, removes most of the back-and-forth between QC and sales.
Inside the buyer limit with no hold reasons. Released to stock or dispatch.
Inside a wider limit agreed for secondary use, or with defects that cutting can plan around.
Over the limit or with repeating defects. Sold as off-quality or reworked.
Waiting for a human decision on a borderline call, shade question or buyer query.
Passed, with the defect map sent to cutting so panels avoid marked yards.
Grade thresholds are set by buyer and article, not globally, because a limit that suits a heavy workwear twill would be too loose for a fine shirting. The dashboard should show which rule was applied to each roll so a grade can always be explained.
When grades carry their reasons, sales can answer customer questions without calling QC. Grade rules are configured with your QC lead.
Turning Defect Counts Into Priorities
The Pareto view is where improvement starts. It shows which few defect types account for most of the quality loss, measured in points rather than raw counts so that long, costly defects are not outranked by many tiny ones.
Illustrative data. The first three types account for almost 75% of points, so the week’s improvement work starts with weaving and machine cleanliness.
Clicking a bar should open the rolls and looms behind it. A Pareto that stops at the chart tells you what is wrong but not where, and the where is what the weaving and finishing teams need.
Most plants review this view in a short daily quality meeting. A template agenda comes with the rollout.
Who Uses Which View
A dashboard earns its place when each role has a view built for its own decisions.
Confirms or corrects AI calls, sees the defect image and suggested points, and closes each roll.
Holds, releases and fails rolls, handles buyer questions and watches the review backlog.
Sees defect rates by machine and shift and gets alerts when a machine starts repeating defects.
Tracks shade bands, stains and finishing defects by dye lot and machine.
Checks which rolls for an order are graded, held or ready to ship.
Follows first-quality rate, points trend and repeat defects across the plant.
Access is set by role, so each person lands on the view they need. Ask our support team for the default role set.
Making the Dashboard Part of the Daily Routine
Dashboards fail more often from habits than from software. A screen that is not part of a meeting, a shift handover or a standard decision soon stops being opened. The checklist below covers the routines that keep an inspection dashboard in use after the first month.
None of these steps is technical, and all of them decide whether the dashboard pays back. A short adoption plan is part of every rollout plan.
How iFactory Delivers the Fabric Inspection Dashboard
Defects found, sized and imaged at inspection speed.
Defect map, grade board, Pareto, source view and review queue.
Formulas defined once and shown with every number.
From chart to roll to defect image to source machine.
Each role opens on the view that fits its decisions.
Repeating defects and holds pushed to the right owner.
It pulls roll, order and machine data from your ERP and machine systems. See the dashboard on sample data from a mill like yours in a session.
See Your Own Rolls on a Live Dashboard
Start with one inspection frame. We fit AI vision, connect roll and order data and give your QC and weaving teams the five core views within the pilot.
Broken-end streak detected on six rolls from loom group B since 02:00. Pattern repeats every roll change.
The Dashboard at the Start of a Shift
This is how a QC manager might use the dashboard with iFactory’s assistant at the start of a morning shift.
iFactory ships as a pre-configured NVIDIA AI server, racked and ready with the fabric defect detection and dashboard analytics models loaded. Rack it, plug in power and Ethernet, and the AI is live on your network. Our scope covers cameras and lighting on inspection frames, PLC/SCADA and ERP integration, cabling and network setup, operator and QC team training, and 24×7 remote monitoring.
Server installed, cameras and lighting mounted, historical inspection and defect records loaded.
Models trained on your own fabrics and styles, then piloted on one line with your QC team reviewing every call.
Rollout to the agreed lines, inspector and supervisor training, ERP hand-off and 24×7 remote monitoring in place.
Cameras, server, software and integration come as one package. For pricing on your frame count, contact our sales team.
Frequently Asked Questions
At minimum, a live defect map for each roll, a roll grade board, a defect Pareto, a source view by loom or dye lot, and a review queue for AI calls that need confirmation. Each should link down to the rolls and images behind it.
Points per 100 square yards, first-quality rate, defects per 100 meters, rolls on hold, meters inspected per hour, agreement between AI and inspectors, and the rate of repeat defects.
Grades come from the four-point score against a buyer and article limit, plus any hold reasons such as shade or repeating defects. The dashboard should show which rule was applied to each roll.
Yes, when roll IDs are linked to production records. The source view then shows defect rates by loom, beam, yarn lot or dye lot, which turns inspection data into fixes upstream.
Usually yes. Cameras and lighting can be fitted to existing frames, and roll and order data can be pulled from your ERP.
A typical rollout takes 6–12 weeks: installation and data links, then model training and a pilot on one frame, then go-live and training. Plan it with our team.
One View of Every Defect, Roll and Grade
iFactory turns AI inspection results into a dashboard your QC, weaving and dyeing teams actually use, with every number linked to the rolls and machines behind it.
Every bar opens the rolls, their defect maps and the source looms behind them.