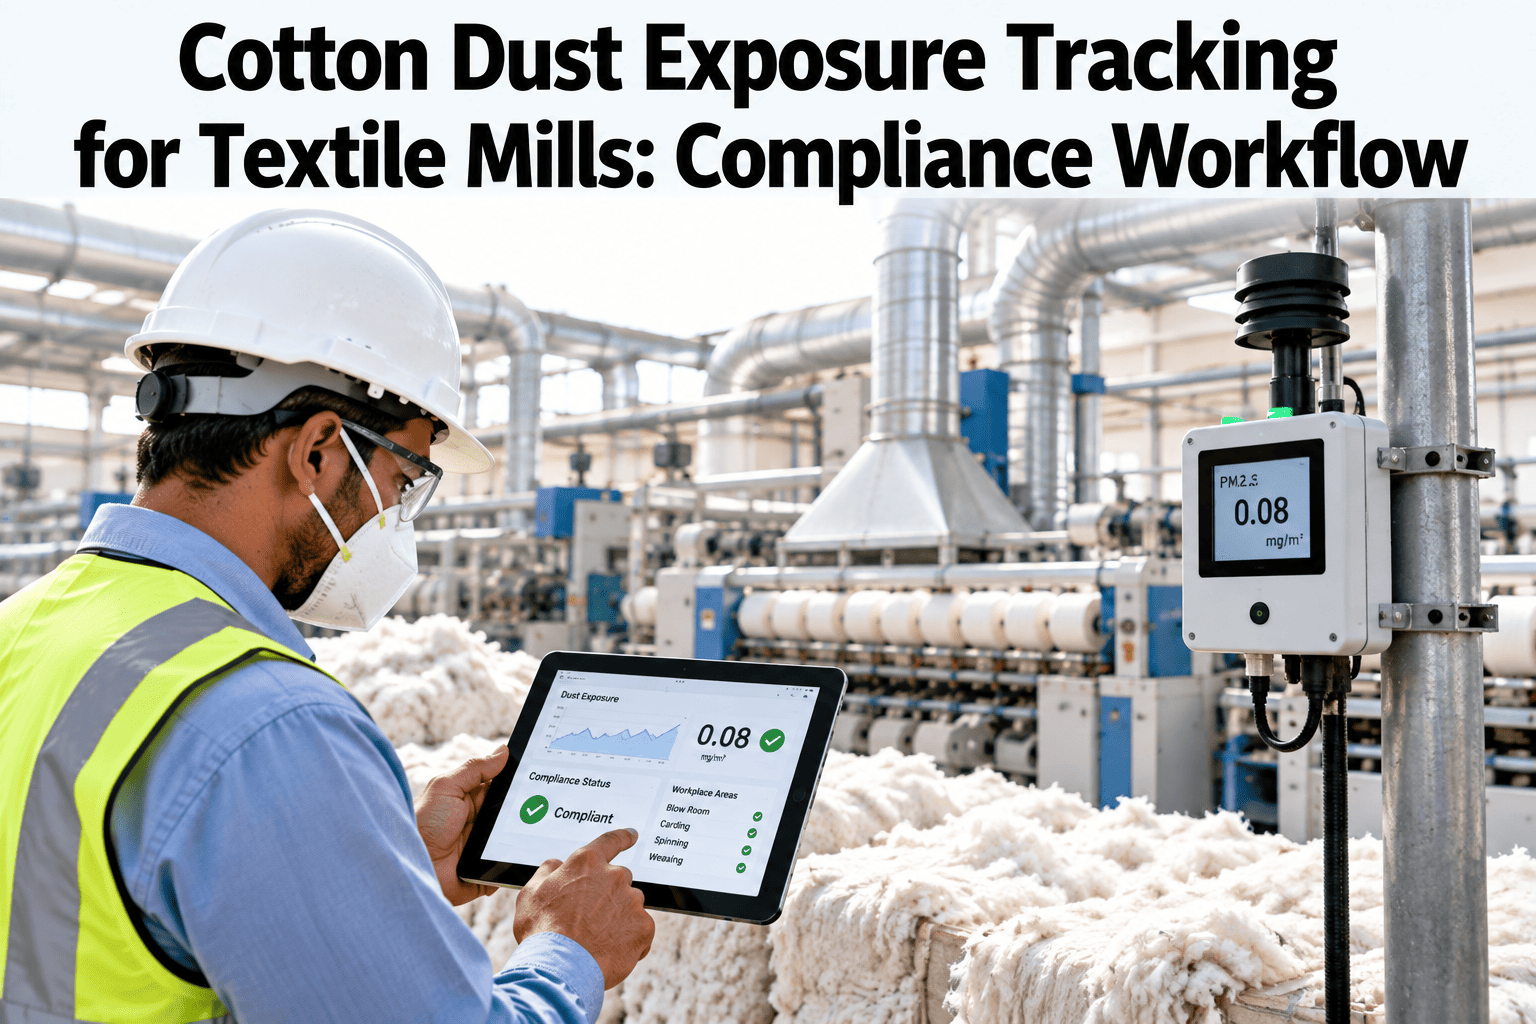
Cotton dust is the kind of hazard that builds quietly. A spinning floor can look clean at shift start and still carry exposure levels that creep past safe limits by mid-shift, especially near blow rooms and carding lines where fiber fly concentrates. Byssinosis and chronic respiratory damage develop over years of exposure, not single incidents, which is exactly why so many mills under-track it: nothing dramatic forces the issue until a worker's health screening or a compliance audit does. Continuous tracking changes that. See how iFactory AI turns dust readings into a zone-by-zone exposure record for your own mill.
Track Cotton Dust Exposure Before It Becomes a Health Finding
iFactory AI monitors airborne cotton dust zone by zone, comparing live readings against exposure limits so corrective action happens during the shift, not after a screening.
Below limit
Approaching limit
Above limit
Why Spot Checks Miss the Real Exposure
Most mills still measure cotton dust with periodic sampling, often a handful of readings per quarter at fixed stations.
That approach catches a snapshot, not a pattern. Dust concentration shifts with humidity, machine speed, maintenance timing, and even the cotton grade running that day, so a single quarterly reading can sit nowhere near what workers actually breathe most shifts.
Levels are typically lowest, right after cleaning and before full production speed.
Fiber fly accumulates near carding and opening lines as throughput climbs.
Often two to three hours before end of shift, when ventilation lag catches up slowest.
Readings fall as machines slow, but cumulative exposure for the shift is already set.
Where Exposure Concentrates Across the Mill
Not every zone carries the same risk. The grid below shows a composite exposure pattern across a typical spinning mill layout.
See Your Own Zones Mapped by Exposure Level
Book a 30-minute session and iFactory AI will show which zones in your mill run closest to the limit.
Monitoring Methods Compared
Different monitoring approaches trade off cost, coverage, and how quickly a problem is caught.
| Method | Coverage | Detection Speed | Best Fit |
|---|---|---|---|
| Quarterly spot sampling | Single point in time | Weeks to months | Baseline compliance filing |
| Personal dosimetry badges | Individual worker, per shift | Hours | High-risk role tracking |
| Fixed-zone sensors | Continuous, by zone | Minutes | Mill-wide pattern detection |
| iFactory AI continuous tracking | Continuous, zone and shift | Real time | Early corrective action |
Reading the Trend, Not Just the Spike
A single high reading matters less than a rising trend across shifts. The bars below show an illustrative two-week exposure trend in the opening line.
What Drives Cotton Dust Levels
Four factors explain most of the variation mills see shift to shift.
Cotton Grade and Trash Content
Higher trash content releases more fiber fly during opening and cleaning.
Ventilation Performance
A fan running below rated airflow lets dust accumulate even with normal production.
Filter Condition
Clogged filters reduce extraction efficiency gradually, often unnoticed until levels spike.
Humidity and Season
Drier air lets fiber fly stay airborne longer, raising readings in winter months.
Corrective Action Path
When a zone crosses its threshold, a clear escalation path matters more than the alert itself.
Zone reading crosses the warning threshold and the shift supervisor is alerted immediately.
Ventilation and filter status for that zone are checked against baseline readings.
If equipment is confirmed at fault, a maintenance ticket is raised with the zone's exposure history attached.
PPE requirements for the affected zone are reviewed while the fix is pending.
Readings are rechecked after the fix to confirm the zone is back under the limit.
Rolling It Out Across the Mill
iFactory AI arrives pre-configured on hardware built to connect to existing ventilation and EHS systems.
Expert Review
iFactory textile specialists reviewed the zone exposure patterns and corrective action path above against common spinning mill layouts, confirming that opening line and blending zones carry the highest and most variable readings.
Frequently Asked Questions
How does continuous tracking compare to our current compliance sampling?
It runs alongside your compliance sampling rather than replacing the filing requirement. Continuous zone data gives you the pattern between official samples, so a rising trend gets caught weeks before the next scheduled reading. Support can walk through how the two fit together for your reporting cycle.
What sensors are used and where do they go?
Fixed-zone particulate sensors are placed according to your mill's airflow map, typically near opening lines, blending, and carding where variability is highest. Placement is reviewed during rollout to match your specific floor layout rather than a generic template.
Can this replace personal dosimetry badges?
Zone sensors and personal dosimetry answer different questions. Zone data shows where and when exposure rises, while dosimetry shows an individual worker's cumulative dose. Most mills run both. See how the two data sets combine in a walkthrough on your own mill.
How fast does an alert reach the floor?
A threshold crossing alerts the shift supervisor within minutes, with the zone, reading, and recent trend attached. That is fast enough to check ventilation or filter status before the shift ends, rather than finding out at the next quarterly review.
Does this help with health screening programs?
Yes, the zone exposure history gives occupational health teams context for individual screening results, showing which zones a worker's shift history actually exposed them to. Ask support how exposure history links to screening records in your EHS system.
Catch the Trend Before It Becomes a Health Finding
iFactory AI tracks cotton dust exposure zone by zone, in real time, so corrective action happens during the shift. Book a walkthrough to see it on your own mill.