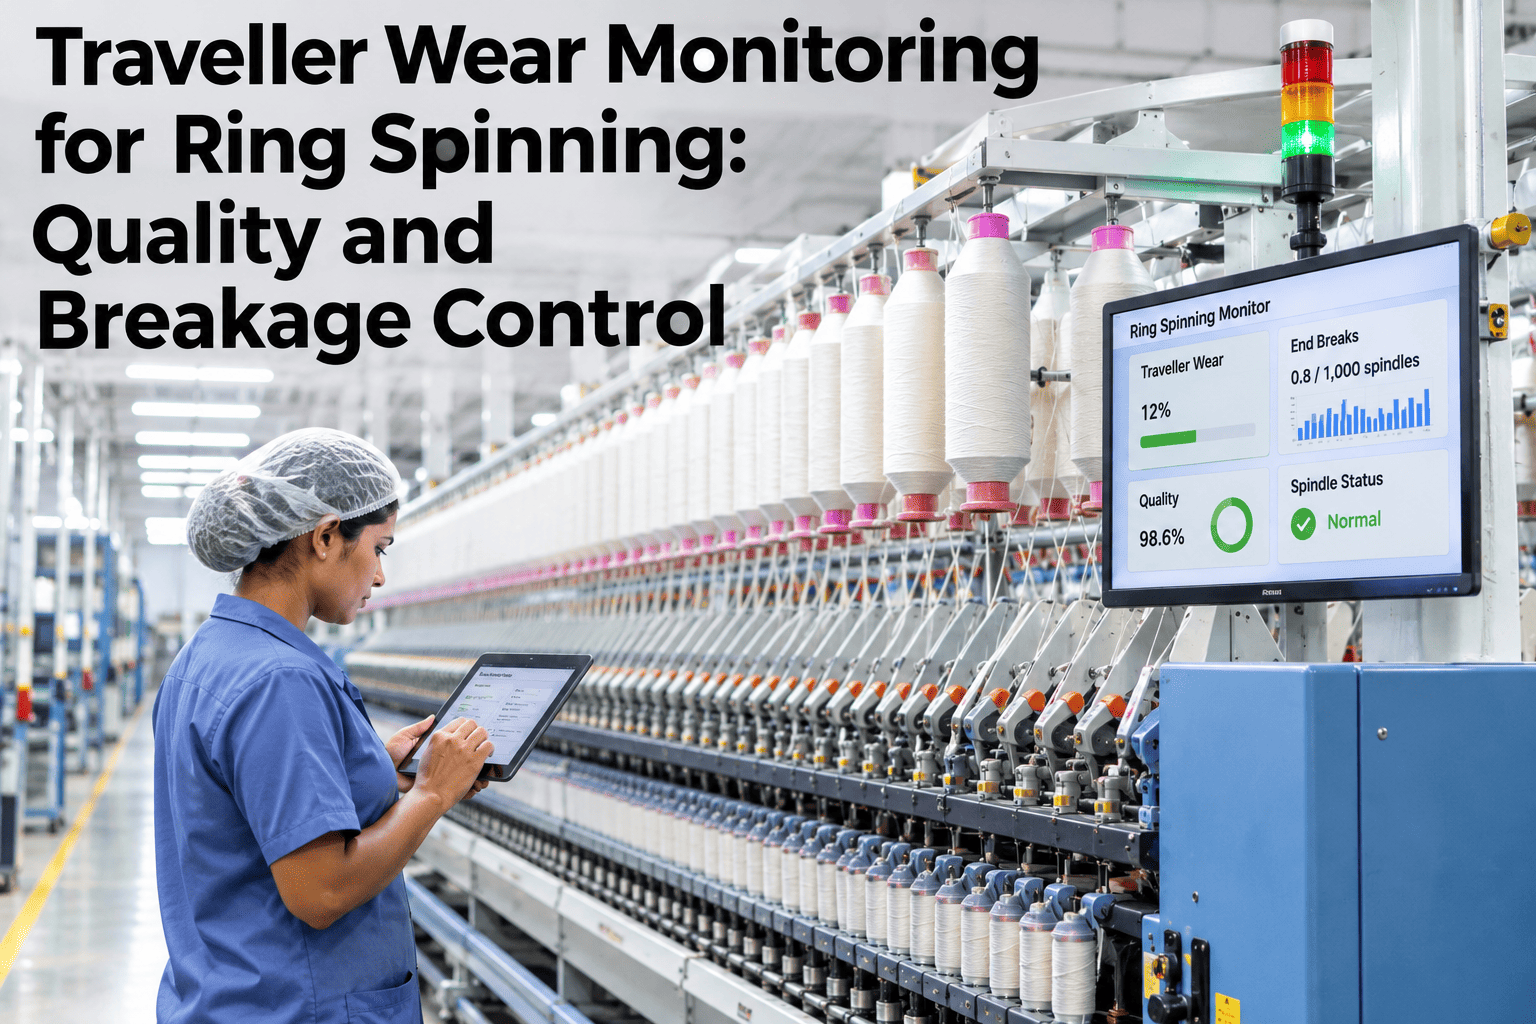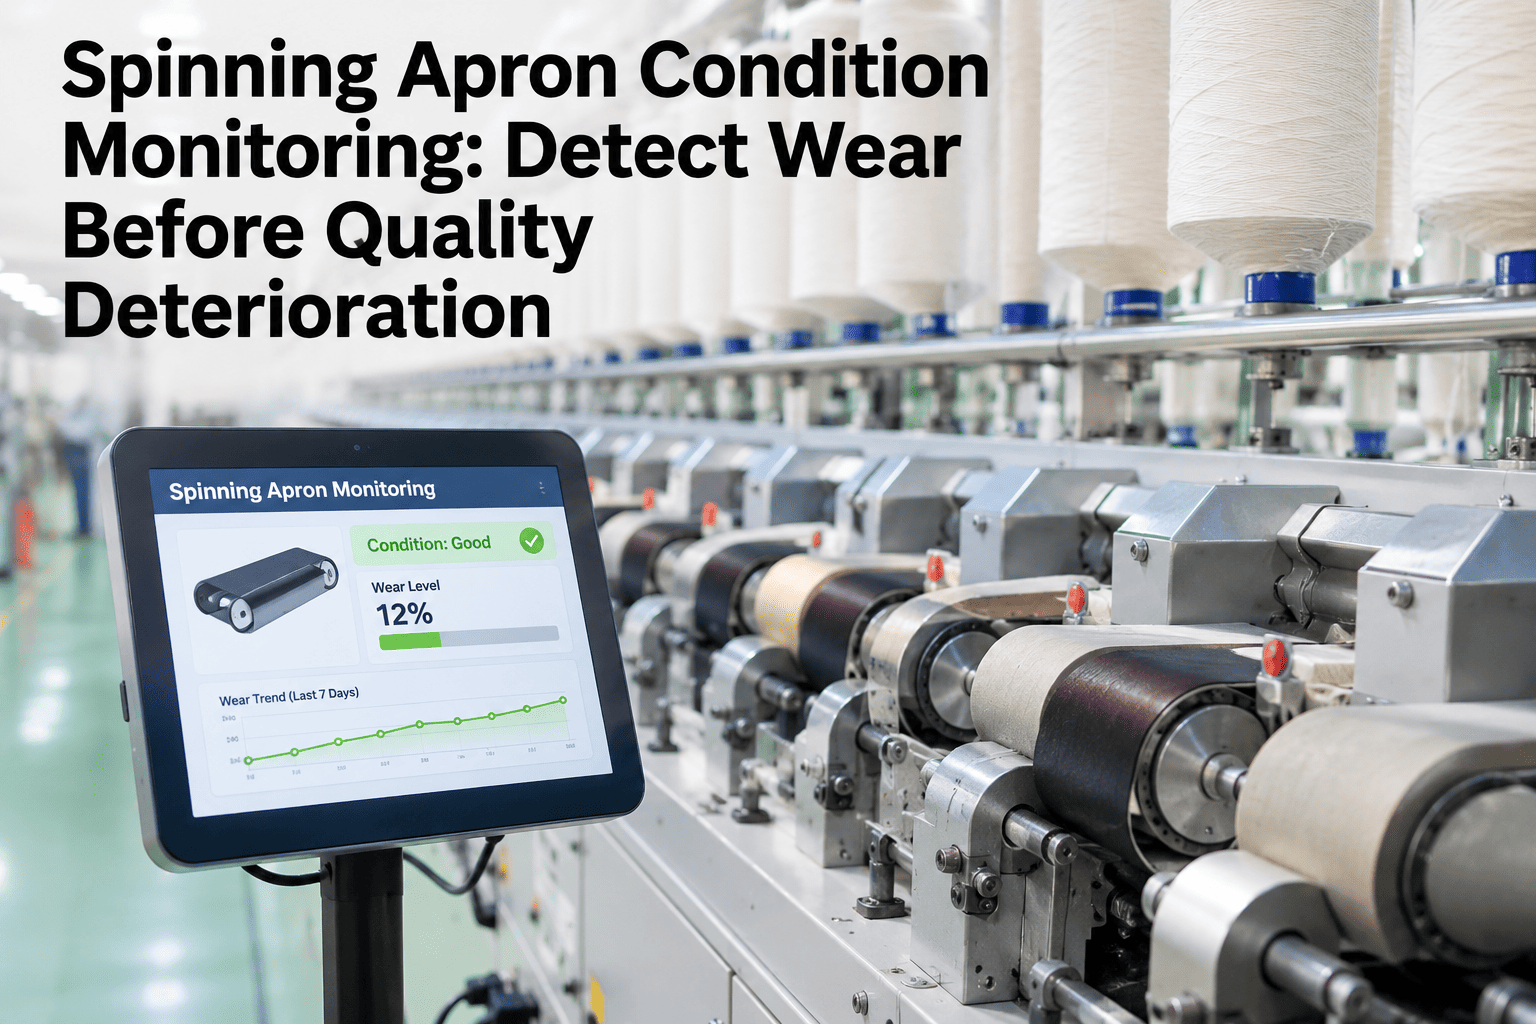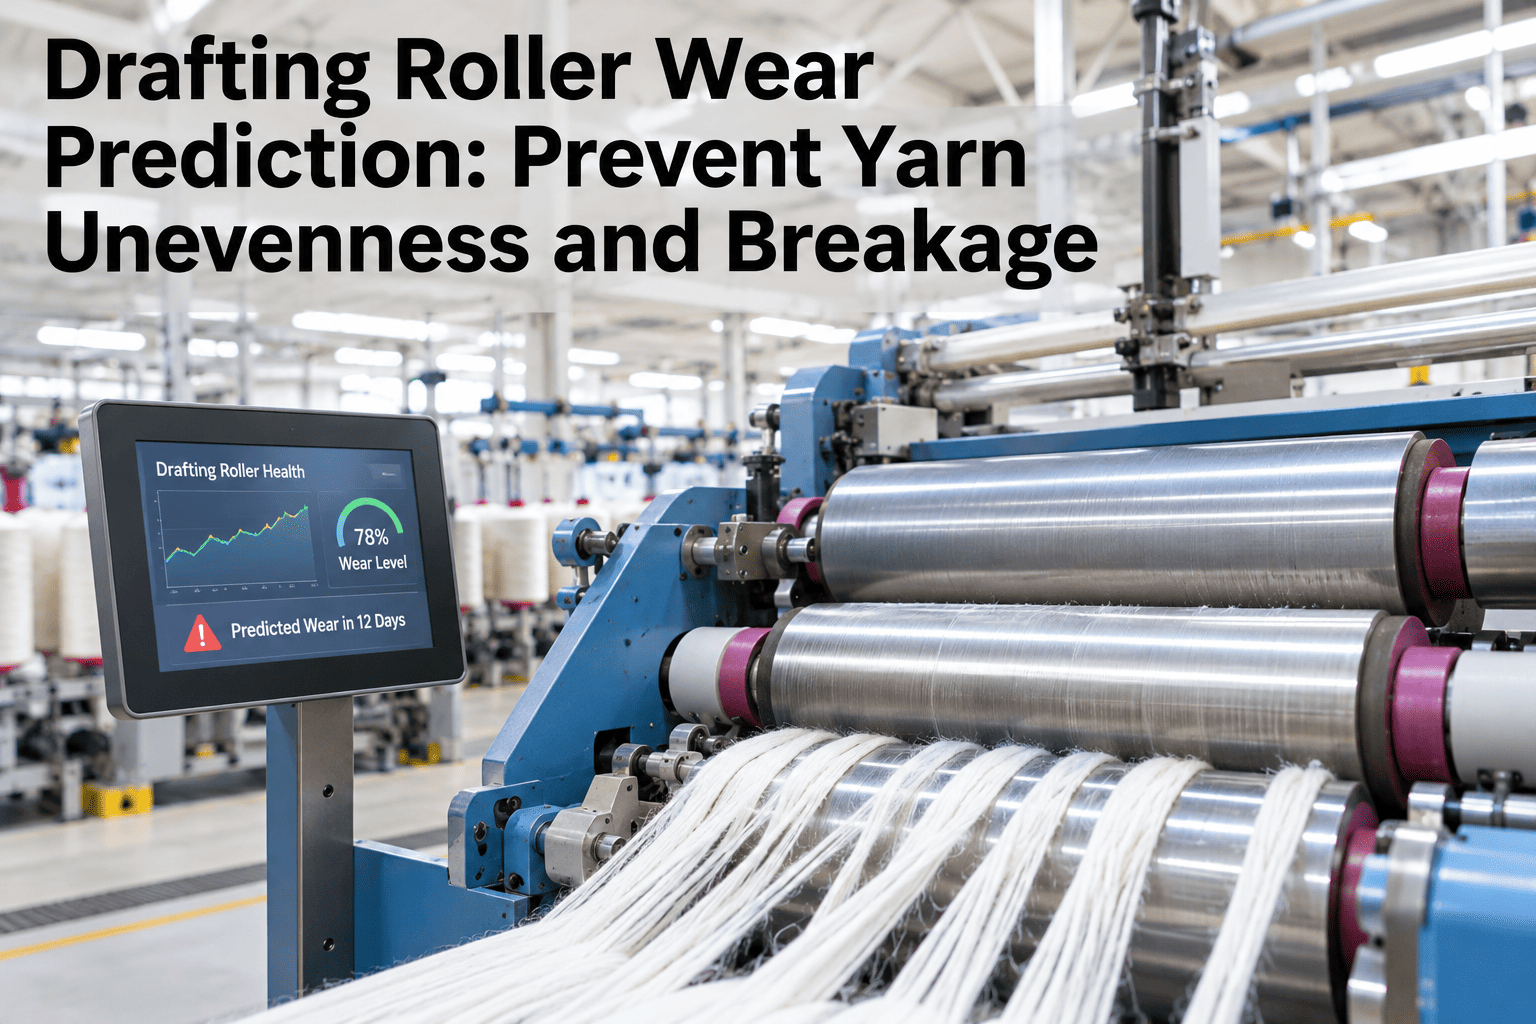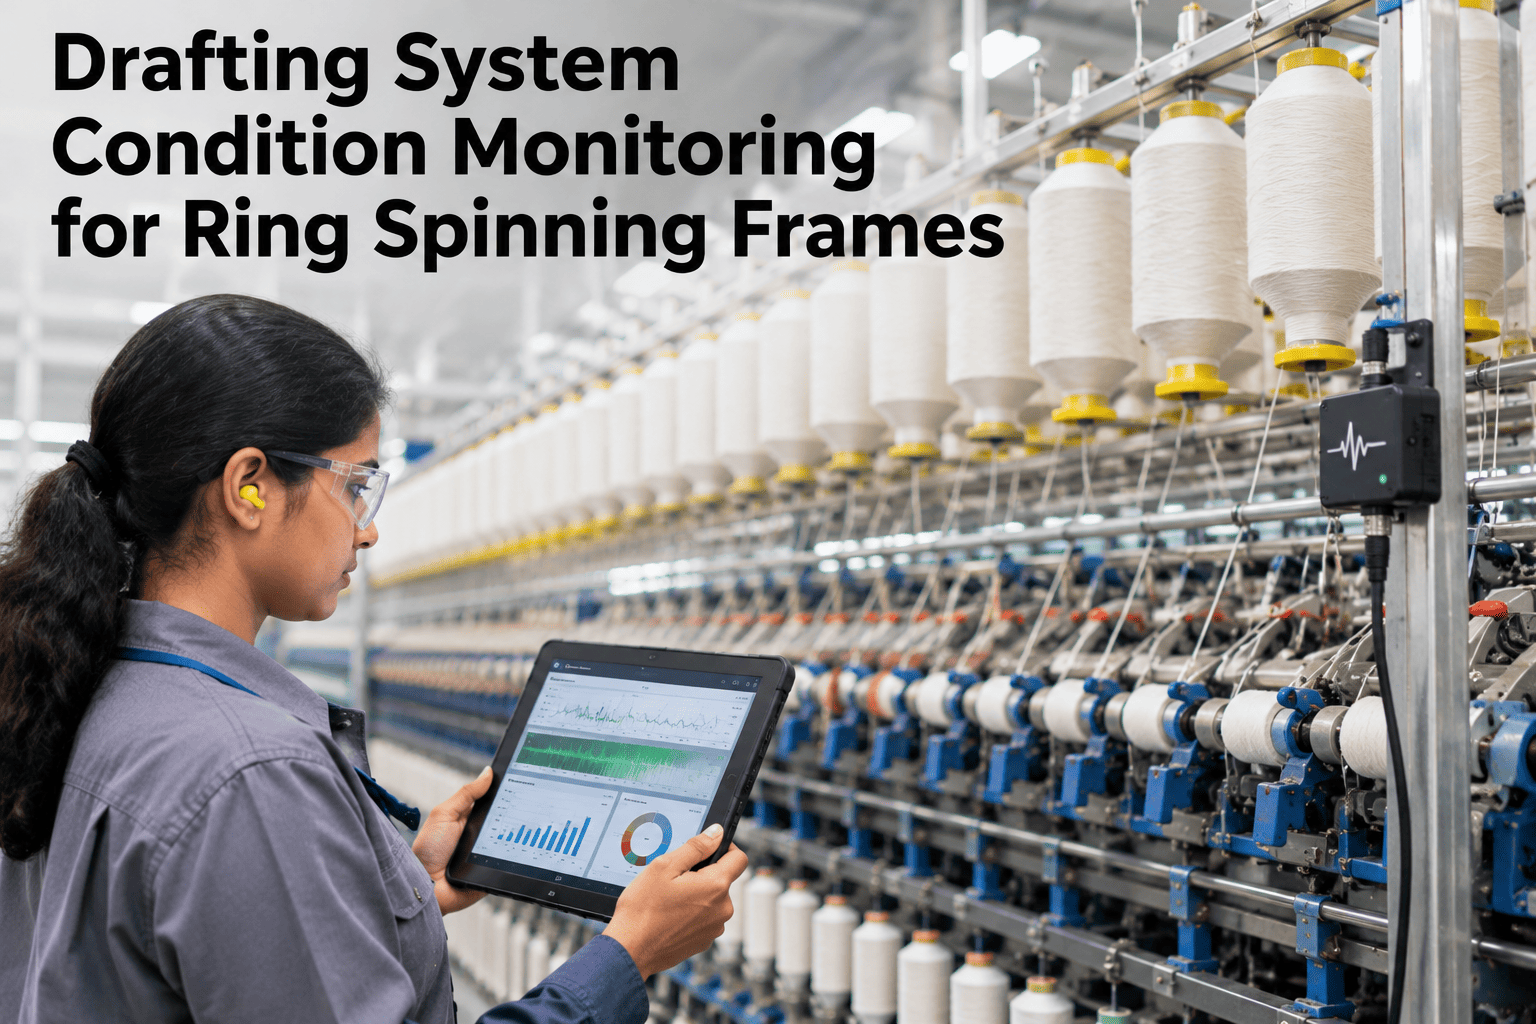
The drafting zone of a ring spinning frame is where yarn count and evenness are determined, and where most quality losses originate. Rollers, aprons and cradle settings that drift gradually — surface wear, eccentricity, glazing, spring pressure loss — do not stop the machine. They change the yarn quietly, and the signal arrives as a rising CVm trend, an increase in thick-and-thin imperfections, or a customer complaint from fabric knitted weeks after the deterioration began. Condition monitoring applied to the drafting system catches these signals while they are still a maintenance action, not a quality failure. Teams that want to see this built around their own fleet and quality data can book a 30-minute walkthrough with iFactory AI.
Catch Drafting Deterioration Before It Shows Up in the Yarn
iFactory AI monitors drafting rollers, aprons, settings and quality signals to identify deterioration before uneven yarn formation and breakage increase.
What Is Drafting System Condition Monitoring?
Drafting system condition monitoring tracks the physical state of drafting rollers, aprons, cradle settings and related components alongside the yarn quality signals those components produce — using the combined data to identify deterioration before it reaches the level that causes measurable quality loss or increased yarn breakage.
In ring spinning, the drafting system is a three-roller arrangement — back, middle and front nips — with an apron zone guiding fibre through the main drafting stage. Each element has a characteristic wear signature and a characteristic quality effect when it begins to fail. Condition monitoring maps these signatures so maintenance acts on the right component at the right time, rather than replacing everything on a calendar cycle or waiting for a visual inspection to catch something that should have been caught weeks earlier.
The Four Drafting Components and Their Condition Signatures
Each component deteriorates through a different mechanism and produces a different pattern in yarn quality data. Understanding these signatures is the foundation of targeted monitoring.
| Component | Failure Mode | Quality Effect | Early Signal | Monitoring Approach |
|---|---|---|---|---|
| Top rollers (cots) | Surface wear, glazing, eccentricity, hardness change | Rising CVm, thick-thin imperfections, periodic spectrogram faults | Cot hardness drift; spectrogram fault wavelength matching roller circumference | Scheduled hardness checks; periodic fault monitoring; running hour tracking |
| Bottom rollers | Fluting wear, surface corrosion, misalignment | Drafting irregularity, count variation, nip inconsistency | Visual groove depth; running hours; CVm trend on affected machines | Running hour counter; CVm trend correlated to roller change history |
| Aprons (top and bottom) | Glazing, cracking, edge wear, tension loss | Drafting waves, irregular yarn, hairiness increase, thick-thin places | Apron surface on inspection; running hours; CVm and IPI trend vs apron age | Running hour tracking; CVm trend monitoring; scheduled surface inspection |
| Cradle and spring | Spring pressure loss, cradle misalignment, saddle wear | Inconsistent drafting force, variable count, thick places | Spring pressure gauge; cradle alignment check; CVm trend on suspect frames | Scheduled pressure calibration; CVm pattern to flag frames for inspection |
Why Calendar-Based Maintenance Misses Drafting Deterioration
Fixed intervals — aprons every three months, rollers every six months — carry two systematic errors: replacing components with useful life remaining, and failing to catch components that deteriorate faster than the interval due to raw material, speed or humidity variation.
Rieter's sensor-based predictive maintenance system reports a 95% accuracy rate in predicting failures on spinning machines, cutting maintenance costs by 15% (Rieter / Textile School, 2025). The gain comes from eliminating unnecessary preventive replacements as much as from preventing unexpected failures.
Reading Quality Data as a Condition Signal
CVm, imperfections and spectrogram data from Uster testing contain diagnostic information about drafting health that goes well beyond the pass/fail quality decision. Three signals stand out as the most actionable for condition monitoring.
Stop Reading CVm Reports. Start Reading Condition Signals.
iFactory AI connects your Uster quality data to your drafting maintenance history — showing which frames are drifting and which components need attention before the CVm crosses a threshold.
Implementing Drafting Condition Monitoring: The Practical Sequence
Condition monitoring for drafting systems does not require replacing maintenance practices overnight or installing new sensors on every frame. The sequence builds from existing data sources and adds sensor inputs only where the data gap justifies the investment.
Common Mistakes Condition Monitoring Corrects
The most expensive drafting maintenance mistakes are not missed replacements — they are replacements done on the wrong frame, at the wrong time. Condition monitoring replaces assumption with data.
Frequently Asked Questions
Does drafting condition monitoring require installing new sensors on each frame?
Not as a starting point. The most valuable first layer uses existing Uster quality data — CVm trend, imperfections and spectrogram — correlated with maintenance history records, adding no hardware. Vibration and current-signature sensors can be added later for earlier detection of specific failure modes. Book a session to discuss what signals are already available in your mill before any sensor investment.
How frequently should drafting components be tested to detect condition drift?
For condition monitoring purposes, each machine should be tested at least twice per month — not once per quality lot — to generate enough data points to identify a CVm drift trend within two to three weeks of its onset. Mills under active investigation may test a suspect frame daily until the trend is confirmed. Our team can review your current testing frequency against your quality risk profile.
Can the system identify which spindle position on a frame is causing a quality problem?
Yes, when cop-level Classimat data and spindle position records are available. With standard lot-level Uster testing, attribution is to the frame rather than the individual spindle. Adding cop-level sampling for investigation cases increases resolution without requiring it as standard practice. Ask how spindle-position attribution is structured for investigation workflows.
What data does iFactory AI need to start condition monitoring?
The minimum starting dataset is Uster test results by machine and date for six to twelve months, plus a maintenance log covering apron changes and roller buffing events for the same frames. Additional raw material lot records and production schedule data improve the analysis but are not required to start. Book a session to review your available data before any platform commitment.
How is drafting condition monitoring different from standard preventive maintenance?
Standard PM uses fixed intervals regardless of actual condition — replace aprons every three months, buff rollers every six. Condition monitoring replaces fixed intervals with data-triggered decisions: an apron is replaced when the combination of running hours, CVm trend and surface condition indicates it is approaching failure, which may be at two months or four. See how condition-based scheduling compares to your current PM calendar.
Connect Drafting Condition to Yarn Quality — Before the Complaint Arrives
iFactory AI links your Uster quality data to drafting maintenance history so your team can see which frames are drifting and which components need attention — weeks before a customer sees the result.