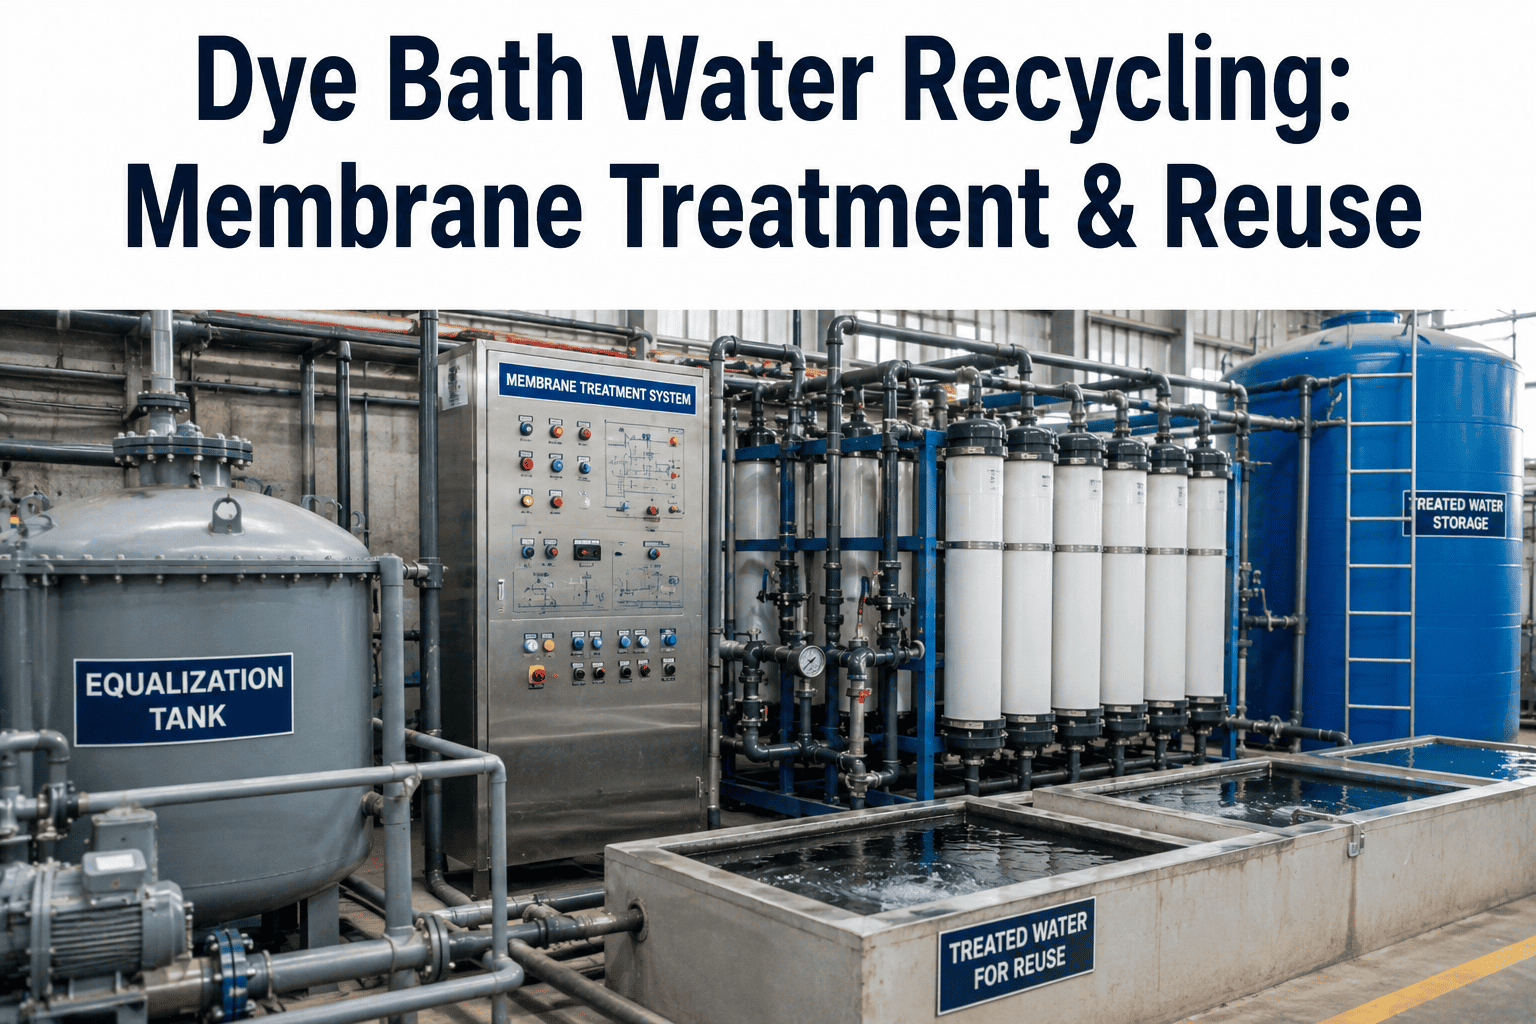
Reactive dyeing leaves roughly 30 percent of the dye unfixed to the fabric, which means every dye bath discharged without recovery is not just wasted water, it is wasted color and salt going straight down the drain. Membrane treatment changes that calculus by filtering the spent bath through progressively finer layers until what comes out the other side is clean enough to go straight back into the next dye recipe. The challenge most dye houses run into is not whether membranes work, since decades of pilot and full-scale studies confirm they do, but which membrane stage to trust for which water quality target, and how to keep that recovery train performing consistently once fouling starts pulling flux down batch after batch.
Every Dye Bath You Discharge Is Water, Salt, And Color You Already Paid For Once
UF, NF, and RO membranes recover 70 to 90 percent of spent dye bath water at a quality suitable for direct reuse. Choosing and maintaining the right stage combination is what determines whether that recovery holds up in daily production, not just in a pilot trial.
Why Membrane Filtration Outperforms Older Treatment Methods For Reuse-Grade Water
Textile dye houses have relied on coagulation-flocculation, biological treatment, and activated carbon for decades, and each has a place in a full treatment train, but none of them alone produces water clean enough to go directly back into a dye bath without risking shade variation. Membrane filtration closes that gap because it separates by physical pore size rather than chemical reaction, which means performance is predictable and repeatable across different dye classes and effluent compositions in a way that biological or chemical treatment alone cannot guarantee. Membrane bioreactor systems, which combine biological treatment with a membrane barrier, have also gained traction as a pretreatment stage precisely because they reduce the organic load reaching downstream NF and RO membranes, though membrane fouling remains their most cited operational drawback and a major driver of reduced membrane lifespan when left unmanaged.
Physical Separation, Not Chemical Reaction
Pore size determines what passes through, so performance does not depend on dosing accuracy or reaction time the way coagulation and biological treatment do.
Recovers Dye And Salt, Not Just Water
Nanofiltration in particular can separate residual dye from dissolved salt, allowing both streams to be recovered and reused rather than treated as combined waste.
Consistent Across Dye Classes
Studies across reactive, acid, and disperse dye effluents show membrane systems achieving high color and COD rejection regardless of the specific dye chemistry used upstream.
Modular And Scalable
Membrane skids can be sized and staged incrementally, letting a mill start with UF on one line and expand to a full UF-NF-RO train as the business case is proven.
What Each Membrane Stage Actually Removes — And Why The Order Matters
UF, NF, and RO are not interchangeable, and using them out of sequence either wastes their capability or destroys them prematurely through fouling. Each stage is sized to remove a different class of contaminant, and the water quality target for reuse determines how many stages a given batch actually needs to pass through.
Ultrafiltration — The Pretreatment Workhorse
UF membranes remove suspended solids, colloidal matter, and most large dye molecules, typically achieving greater than 90 percent color and chemical oxygen demand removal on their own. Its real value in a recycling train is protecting the finer NF and RO membranes downstream from the fouling load that would otherwise shorten their operating life dramatically.
Nanofiltration — The Dye And Salt Separator
Operating at lower pressure than RO while still rejecting most multivalent salts and residual dye, NF is the stage most capable of splitting a spent bath into a reusable dye-and-salt concentrate and a lower-salinity permeate. Reported conductivity results vary sharply by membrane type, meaning membrane selection at this stage has an outsized effect on whether the permeate is actually suitable to feed back into a light shade dye recipe.
Reverse Osmosis — The Final Polish
RO is the stage that reliably produces water pure enough for general process reuse across dye classes, with commercial RO membranes achieving qualified reuse-standard permeate at water recovery ratios around 70 percent in single-batch testing. Flux does decline sharply once recovery pushes past roughly 50 percent, which is the practical ceiling most systems are engineered around rather than chasing marginal extra recovery.
The Membrane Choice On Paper Is Rarely The Bottleneck — Sustained Performance Is
Every mill that has run a membrane pilot already knows UF, NF, and RO can hit strong rejection numbers in a controlled test. What determines whether that performance survives daily production is how quickly fouling builds, how consistently cleaning cycles are triggered, and whether anyone is watching flux decline before it becomes a full system failure. iFactory tracks that in real time so your recovery train performs like the pilot did, every single day.
What Membrane Treatment Actually Delivers, Backed By Published Results
The figures below summarize performance ranges reported across peer-reviewed and pilot-scale studies on membrane treatment of textile dye bath and dyeing effluent, giving a realistic picture of what a well-designed and well-maintained recovery train can achieve.
Matching Membrane Stages To What You're Actually Trying To Recover
Not every mill needs a full three-stage cascade, and over-specifying the treatment train adds capital and energy cost without a proportional water quality benefit. The right combination depends on what you are trying to recover and reuse, and where in the process that recovered water needs to go.
| Recovery Goal | Recommended Train | Typical Reuse Point |
|---|---|---|
| Suspended solids and bulk color removal only | UF alone | Rinsing, washing, cooling towers |
| Recover dye and salt for reuse in dark shades | UF pretreatment + NF | Same or darker shade dye recipes |
| General process water for any shade, including light | UF + NF + RO | Dye bath feed water, general process use |
| Zero liquid discharge concentrate management | UF + RO + evaporation/crystallization | Salt recovery, minimal residual discharge |
Fouling Is Not A Maintenance Footnote — It's The Main Threat To Recovery Economics
Textile dye bath effluent is one of the more difficult feed streams membranes encounter, carrying a high organic load, residual dyes, salts, and batch-to-batch composition swings that create constant fouling pressure. Left unmanaged, fouling does not just reduce flux gradually, it can trigger a broader performance collapse as rising transmembrane pressure drives up specific energy consumption and forces repeated aggressive chemical cleaning that shortens membrane lifespan over time.
Organic And Biological Foulants Build First
Protein-like substances and soluble microbial products are consistently identified as the primary organic foulants on RO membranes treating pretreated dye wastewater, forming a fouling layer well before any inorganic scaling becomes visible.
A Measurable Threshold Signals Cleaning Time
Research on RO systems treating dyeing wastewater identifies a permeability decline of more than 15 percent, often occurring after a specific cumulative permeate volume, as the practical signal that cleaning is due rather than waiting for a visible production problem.
Combined Cleaning Recovers Most, Not All, Performance
Alkaline forward flushing followed by pure water backwashing has been shown to recover fouled membrane permeability to as much as 96 percent of a new membrane's baseline, though each cleaning cycle still carries a chemical cost and a small cumulative toll on membrane life.
Catching The 15 Percent Decline Before It Becomes A 40 Percent Production Problem
The published fouling thresholds are useful benchmarks, but very few dye houses are tracking transmembrane pressure and specific flux closely enough in daily operation to catch a 15 percent decline exactly when it happens. Most catch fouling only once output visibly drops or a batch fails quality, by which point the membrane has already been operating inefficiently for days or weeks, burning extra energy to force the same throughput through a partially blocked surface. iFactory connects to pressure, flow, and conductivity sensors on your existing membrane skids to track specific flux continuously and flag the exact point cleaning becomes cost-effective, rather than leaving that call to a fixed calendar schedule or a reactive response to falling output.
Continuous Flux Tracking
Specific flux is calculated in real time from pressure and flow data, replacing periodic manual checks with a continuous performance curve for every membrane stage.
Cleaning-Cycle Optimization
Cleaning is triggered by actual performance decline rather than a fixed calendar interval, avoiding both premature cleaning cost and delayed cleaning that wastes energy.
Permeate Quality Correlation
Conductivity and rejection data are tracked alongside flux, so a quality drift that could affect shade consistency is caught before that water is reused in a dye recipe.
Membrane Lifespan Forecasting
Historical fouling and cleaning-recovery patterns build a forecast for remaining membrane life, giving maintenance and finance teams advance notice ahead of replacement.
What A Membrane Recycling Investment Actually Returns
A membrane recovery train pays back through several overlapping savings streams rather than a single one, which is exactly why the case tends to be stronger than it first appears when a mill only prices out the water bill. Fresh water procurement drops directly with the recovery ratio achieved. Effluent treatment and discharge volume falls by the same proportion, reducing load on downstream ETP capacity that would otherwise need to expand. Dye and salt recovery, particularly through the NF stage, offsets a portion of raw material cost that most mills never previously counted as recoverable. Full-scale case studies pairing UF membrane recovery with dye reuse have documented dye material cost savings running into six figures annually alongside a comparable reduction in effluent treatment cost, with combined return on investment achieved well inside a standard capital planning horizon.
The variable that most often separates a strong return on paper from a strong return in practice is sustained membrane performance. A recovery train specified for 70 percent water recovery but running at 50 percent due to unmanaged fouling delivers a meaningfully smaller annual saving than the business case assumed, which is why treating fouling monitoring as part of the initial investment decision, not an afterthought once the system is running, tends to protect the payback period leadership actually approved.
A Realistic Path From First Pilot Skid To Full Production Recovery
Mills that succeed with membrane recycling rarely start by retrofitting the entire dye house at once. The more reliable path begins with a single UF or UF-NF pilot skid running on one production line, validated against real dye recipes and real shade tolerances rather than clean laboratory water, since laboratory results consistently overstate what a membrane will achieve against actual dye bath composition. That pilot period is also when fouling behavior specific to your effluent becomes visible, informing cleaning frequency and pretreatment requirements before the investment scales to a facility-wide system.
Once the pilot validates both water quality and operating cost, expansion typically follows the treatment train outward rather than doubling the same stage, adding NF for dye and salt recovery once UF pretreatment is proven, then RO once a broader reuse target across shade ranges is set. Sequencing the rollout this way keeps capital exposure proportional to demonstrated results at each stage, and gives the operations team time to build the monitoring and cleaning discipline a larger system depends on to hold its rated recovery ratio in daily production rather than only in a commissioning test.
Common Questions From Dye House Managers On Membrane Water Recycling
Turn Your Membrane Skid's Pilot-Test Performance Into Its Daily Performance
iFactory connects to the pressure, flow, and conductivity sensors already on your UF, NF, and RO systems to track fouling before it costs you flux, water quality, or membrane life. Book a demo and see your own recovery train's real performance curve, not the spec sheet number.