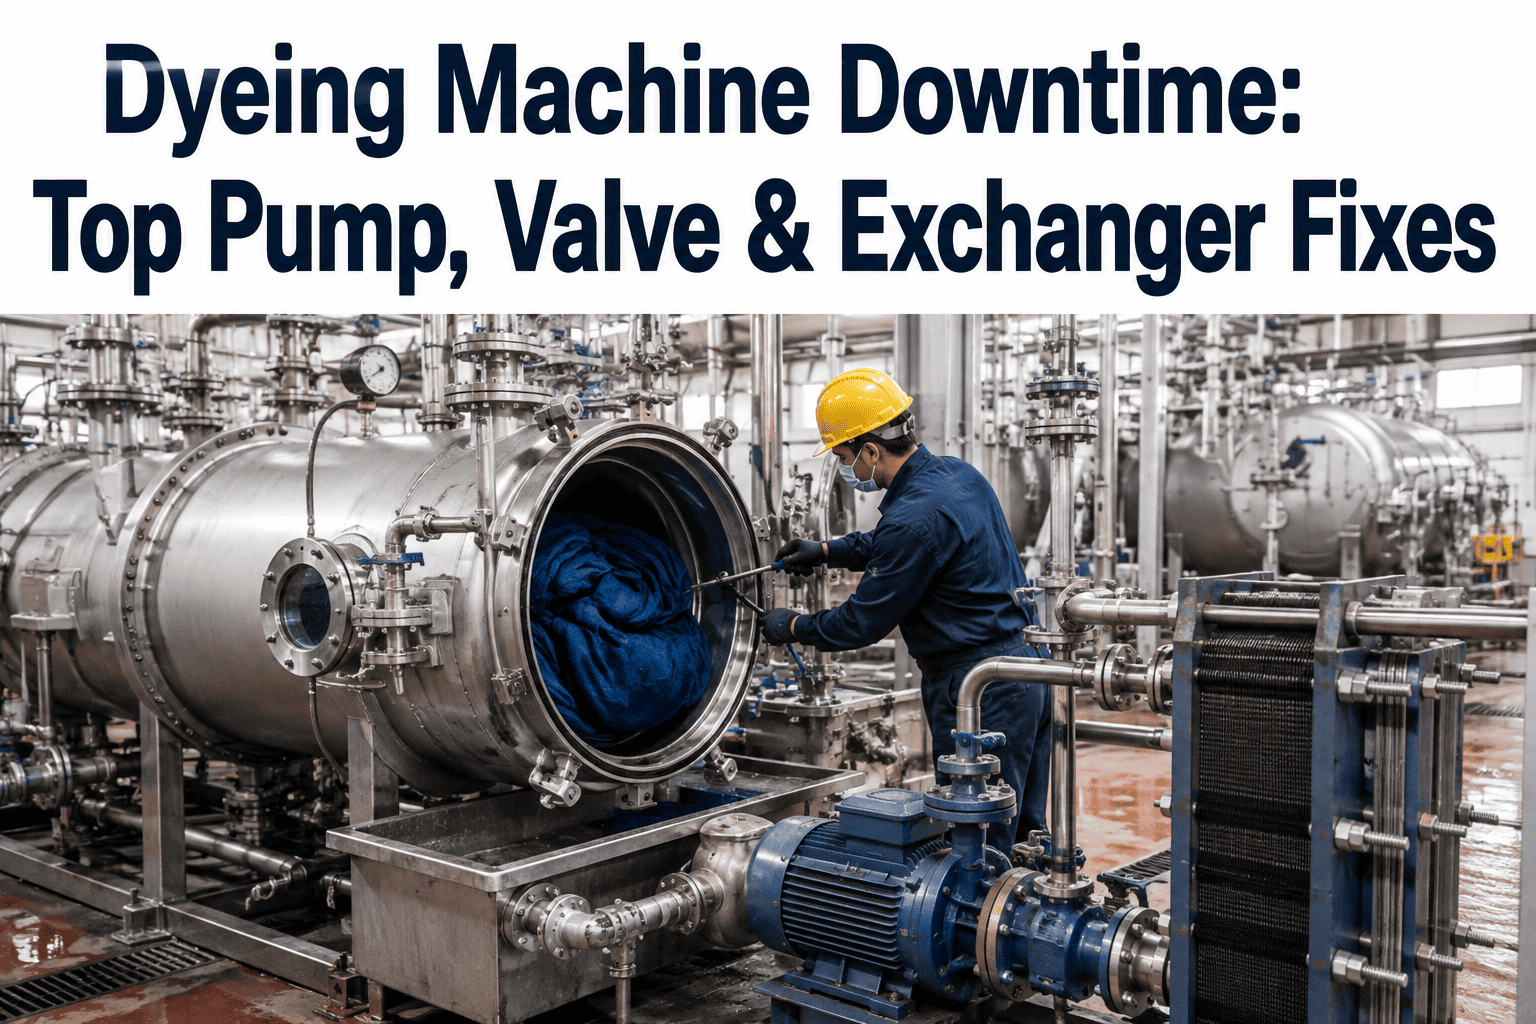
A dyeing machine is one of the most mechanically and thermally stressed assets in a textile mill, cycling hot dye liquor through circulation pumps, driving motors under variable load, and relying on heat exchangers to hit precise temperature profiles that determine shade consistency. When any one of these three systems degrades quietly, the first sign is rarely a mechanical alarm — it is a shade variation, a longer-than-expected heating cycle, or a batch that fails color matching and has to be redyed at real cost. Dyehouses that want to catch that degradation before it reaches the fabric can Book a Demo to see how sensor-based monitoring is applied across dyeing machine critical components.
Why Dyeing Machines Fail Quietly Before They Fail Loudly
Unlike a mechanical loom, where wear shows up as vibration and noise the moment a component starts to degrade, a dyeing machine's most damaging failures often build up inside sealed systems that are difficult to inspect visually while the machine is running. A circulation pump losing efficiency due to impeller wear does not announce itself with a dramatic noise — it shows up as a subtle drop in liquor flow rate that changes dye penetration and levelness across the batch. A heat exchanger accumulating scale or fouling does not trip an alarm — it simply takes longer to reach the target temperature, and if the process controller is not compensating correctly, the batch can complete outside the intended dyeing curve without anyone noticing until quality inspection flags an off-shade lot. This quiet failure mode is exactly why sensor-based monitoring adds more value on dyeing equipment than a purely reactive maintenance approach ever can.
Circulation Pump: The System Driving Liquor Flow and Dye Levelness
The circulation pump moves dye liquor through the fabric or yarn package continuously during the dyeing cycle, and the consistency of that flow rate directly determines how evenly dye penetrates the substrate. Impeller wear, mechanical seal degradation, and bearing wear all reduce pump efficiency gradually, and because most dyehouses do not measure flow rate directly on every machine, this efficiency loss often goes undetected until it becomes severe enough to cause a visible levelness problem. Vibration monitoring on the pump housing catches bearing and impeller issues well before they affect flow, while motor current signature analysis on the pump drive reveals cavitation and blockage issues that a purely mechanical vibration sensor might miss.
Vibration and Bearing Health
Accelerometers on the pump housing detect the earliest stages of bearing wear and impeller imbalance, flagging a rising vibration trend weeks before the pump would fail outright or cause a noticeable flow reduction.
Cavitation Detection
A distinct high-frequency vibration and acoustic signature accompanies cavitation, and catching this signature early prevents the accelerated impeller erosion that cavitation causes when it runs unaddressed over multiple dyeing cycles.
Flow Rate Estimation
Correlating motor current draw against known pump curves allows flow rate to be estimated continuously without installing a dedicated flow meter on every machine, giving dyehouses a practical way to monitor levelness risk fleet-wide.
Drive Motor: Current Signature as an Early Warning System
The motor driving the circulation pump or the machine's rotating reel carries a wealth of diagnostic information in its electrical current signature, information that most dyehouses never tap into because it requires nothing more invasive than a current transformer clamped around the supply cable. Motor current signature analysis can reveal bearing wear, rotor bar defects, voltage imbalance, and mechanical load abnormalities without any physical contact with the motor itself, making it one of the least invasive and most cost-effective monitoring techniques available for dyeing machine drive systems. A gradual increase in current draw at a given load point, for example, often indicates increasing mechanical friction somewhere in the drive train — whether in the motor bearings, the coupling, or the driven pump itself — well before that friction becomes severe enough to cause a trip or a failure.
| Motor Signal Pattern | Diagnostic Meaning | Recommended Response |
|---|---|---|
| Gradual current rise at constant load | Increasing mechanical friction or bearing wear | Schedule lubrication and bearing inspection |
| Current imbalance across phases | Voltage supply imbalance or winding issue | Electrical inspection before next production cycle |
| Periodic current spikes matching shaft rotation | Rotor bar defect or coupling misalignment | Vibration cross-check and alignment verification |
| Sudden current drop under normal load | Possible cavitation or flow restriction upstream | Check strainer, valve position, and liquor level |
Heat Exchanger: Fouling Detection Before It Costs a Cycle
Heat exchangers on dyeing machines transfer thermal energy to bring the liquor to target temperature and hold it through each stage of the dyeing curve, and their performance depends heavily on staying free of scale, fiber lint, and dye residue buildup on the heat transfer surfaces. Fouling accumulates gradually, and its main symptom — a longer heating time to reach the same target temperature — is easy to miss because process controllers often compensate automatically by extending the heating phase, meaning the machine still completes the cycle but the total batch time creeps upward without anyone flagging it as an equipment problem rather than a normal process variation. Left unaddressed, fouling reduces heat transfer efficiency enough that the machine may struggle to hold precise temperature control during critical dwell stages, directly risking shade consistency on temperature-sensitive dye classes.
Thermal sensors placed at the exchanger inlet and outlet, combined with tracked heating rate data over successive batches, reveal fouling trends long before they become severe enough to affect shade outcomes. A heating rate that has slowed by even ten to fifteen percent compared to the machine's established baseline is a reliable early indicator that cleaning is needed, and scheduling that cleaning during a planned changeover avoids both the quality risk of continuing to run a fouled exchanger and the production disruption of an unplanned mid-week cleaning stoppage.
Deploying Sensors Across a Dyehouse Fleet
Rolling out component-level monitoring across an entire dyehouse fleet works best as a phased effort that starts with the machines carrying the highest production value or the worst historical shade-variation record. Retrofitting sensors onto existing dyeing machines is generally straightforward since vibration, current, and thermal sensors attach externally without requiring modification to the machine's process piping or control system, which keeps installation downtime to a matter of hours per machine rather than requiring an extended shutdown.
Identify Priority Machines
Rank machines by production value, historical redye rate, and criticality of the dye classes typically run on each unit to determine initial deployment priority.
Install and Baseline
Attach vibration, current, and thermal sensors, then run several normal production cycles to establish the baseline signature each component is later compared against.
Tune Alert Thresholds
Calibrate deviation thresholds against the baseline data, balancing sensitivity to catch genuine degradation without flooding the maintenance team with false alerts.
Link to Maintenance Workflow
Route alerts directly into the maintenance work order system so a flagged pump, motor, or exchanger generates a scheduled inspection rather than sitting unread on a dashboard.
Expand Fleet-Wide
Extend instrumentation across the remaining dyehouse fleet once the pilot machines demonstrate reliable early detection and the maintenance team trusts the data.
Connecting Equipment Health to Dye Quality Outcomes
The strongest case for component-level monitoring on dyeing machines comes from correlating equipment condition data directly against quality outcomes rather than treating maintenance and quality as separate disciplines. When a batch fails shade matching, tracing that failure back to a specific machine's pump flow trend, motor current pattern, or heat exchanger heating rate at the time of the batch often reveals a mechanical root cause that would otherwise be attributed to dye chemistry, water quality, or operator error. Building this correlation over time transforms condition monitoring data from a pure maintenance tool into a quality diagnostic resource that dye chemists and lab technicians can reference when investigating an unexplained shade deviation.
This connection also changes how dyehouses schedule preventive maintenance. Rather than servicing every machine on a fixed calendar regardless of actual condition, planners can prioritize cleaning and repair work based on which machines are showing genuine drift in flow, current, or thermal performance — protecting quality-critical capacity while avoiding unnecessary downtime on machines that are still running within tolerance. Over a full production year, this shift from calendar-based to condition-based servicing typically reduces both total maintenance hours and the number of quality incidents traced to equipment degradation.
Building the Business Case for Dyehouse Leadership
Justifying a sensor investment to dyehouse leadership works best when the case is framed around the two costs that matter most on the production floor: the cost of a redyed batch and the cost of an unplanned machine stoppage in the middle of a production run. A redye consumes not just the dye chemicals and water for a second cycle but also the machine time that could have gone to a new batch, and on a high-utilization dyehouse floor that lost capacity often costs more than the chemistry itself. When leadership can see a specific historical redye traced back to a pump or heat exchanger issue that monitoring would have caught weeks in advance, the investment case tends to make itself without requiring elaborate financial modeling.
The second part of the business case is about protecting delivery commitments. Dyehouses operating under tight customer delivery windows cannot absorb an unplanned multi-hour machine stoppage without cascading delays across the rest of the production schedule, and the cost of that disruption extends well beyond the immediate repair bill into rescheduling, expedited shipping, and strained customer relationships. Framing the investment around schedule protection resonates strongly with plant managers and production planners who deal directly with the operational chaos an unplanned stoppage creates, even when the maintenance department's own budget conversation focuses more narrowly on repair costs.
Training the Team to Act on Sensor Data
Sensor data only changes outcomes when the people receiving alerts know what to do with them, and dyehouses that skip this step often end up with a technically successful monitoring deployment that fails to move the needle on actual downtime or quality metrics. Building a short, specific response playbook for each type of alert — what to check first when a pump vibration alert fires, what the heating rate deviation threshold means for scheduling a heat exchanger cleaning, how to interpret a current imbalance reading — turns raw sensor output into a repeatable maintenance action rather than an ambiguous notification that technicians have to figure out on the fly.
Equally important is closing the loop between what the sensor predicted and what the technician actually found during the resulting inspection. Logging inspection outcomes against the alert that triggered them builds a feedback dataset that improves threshold accuracy over time and helps the team distinguish alert patterns that reliably predict a specific failure mode from patterns that need further refinement. Dyehouses that invest in this feedback discipline during the first few months of deployment consistently report higher confidence in the system and faster technician response times than those that treat the sensor platform as a passive dashboard to check occasionally.
Frequently Asked Questions: Dyeing Machine Predictive Maintenance
Which dyeing machine component delivers the fastest return when a dyehouse is deciding where to start?
Circulation pump monitoring typically delivers the fastest visible return because pump degradation directly affects levelness and shade consistency, making the connection between equipment condition and batch quality easy for both maintenance and quality teams to see in the data. Heat exchanger monitoring is a strong second priority for dyehouses running temperature-sensitive dye classes, since fouling has a slower but equally real impact on shade outcomes. Dyehouses can Book a Demo to review their own redye history and identify the highest-impact starting point.
Do these sensors require shutting down the dyeing machine or modifying process piping for installation?
No — vibration sensors attach externally to pump and motor housings, current clamps attach around existing electrical supply cables, and thermal sensors are typically installed at accessible inlet and outlet points without requiring any modification to the machine's dyeing process piping or control logic. Installation on a single machine generally takes a few hours and can be scheduled during a routine changeover window rather than requiring a dedicated production stoppage.
How does a dyehouse distinguish equipment-related shade variation from dye chemistry or recipe issues?
Correlating the timing of a shade deviation against the equipment condition data from that specific batch — pump flow trend, heating rate, and motor current pattern — reveals whether the machine was operating within its normal baseline or showing measurable drift at the time the batch ran. When equipment data shows no meaningful deviation, quality teams can more confidently rule out mechanical causes and focus investigation on chemistry, water quality, or process parameters instead, which significantly narrows the root cause investigation timeline.
Can this monitoring approach scale across a large dyehouse with many machine types and ages?
Yes — the monitoring approach itself is largely equipment-agnostic since vibration, current, and thermal sensing apply to any machine with a circulation pump, drive motor, and heat exchanger regardless of manufacturer or age, though baseline thresholds do need to be established individually for each machine given that wear characteristics and normal operating ranges vary across different models and years of service. Contact iFactory Support for guidance on planning a phased rollout across a mixed-fleet dyehouse, including how to sequence machine types, prioritize older equipment with limited historical maintenance records, and structure baseline calibration so results remain comparable as the fleet grows.
What is a realistic timeline to see measurable results after starting a dyeing machine monitoring pilot?
Most dyehouses see the first meaningful early-warning alerts within four to six weeks of installation, once baseline data has been collected and thresholds tuned against actual running conditions on the pilot machines. Measurable reduction in redye rate and unplanned downtime typically becomes visible within two to three months as the maintenance team builds confidence acting on alerts and the correlation between equipment condition and quality outcomes becomes clearer through accumulated batch history.
Planning for Scale Across Multiple Dyehouse Sites
Dyeing operations running multiple sites face an additional layer of complexity when scaling condition monitoring beyond a single pilot dyehouse, since machine age, process recipes, and even water chemistry can vary meaningfully from one facility to another, affecting how baseline thresholds should be set on ostensibly identical equipment. Rather than assuming a threshold configuration that works well at one site will transfer directly to another, successful multi-site rollouts treat each facility's baseline calibration as its own short project, while still standardizing the underlying sensor types, alert categories, and maintenance response workflow across every location so that data and lessons learned remain comparable and transferable between sites.
This standardization pays off most clearly when a group-level reliability or quality team wants to compare equipment health trends across the full site network — identifying, for example, whether a particular pump model or heat exchanger design consistently shows earlier degradation across multiple facilities, which points toward a design or maintenance procedure issue rather than a site-specific operational problem. Building that cross-site visibility from the start, even while calibration remains local to each dyehouse, turns a single-site pilot into the foundation for a genuinely group-wide reliability program rather than a series of disconnected local initiatives.