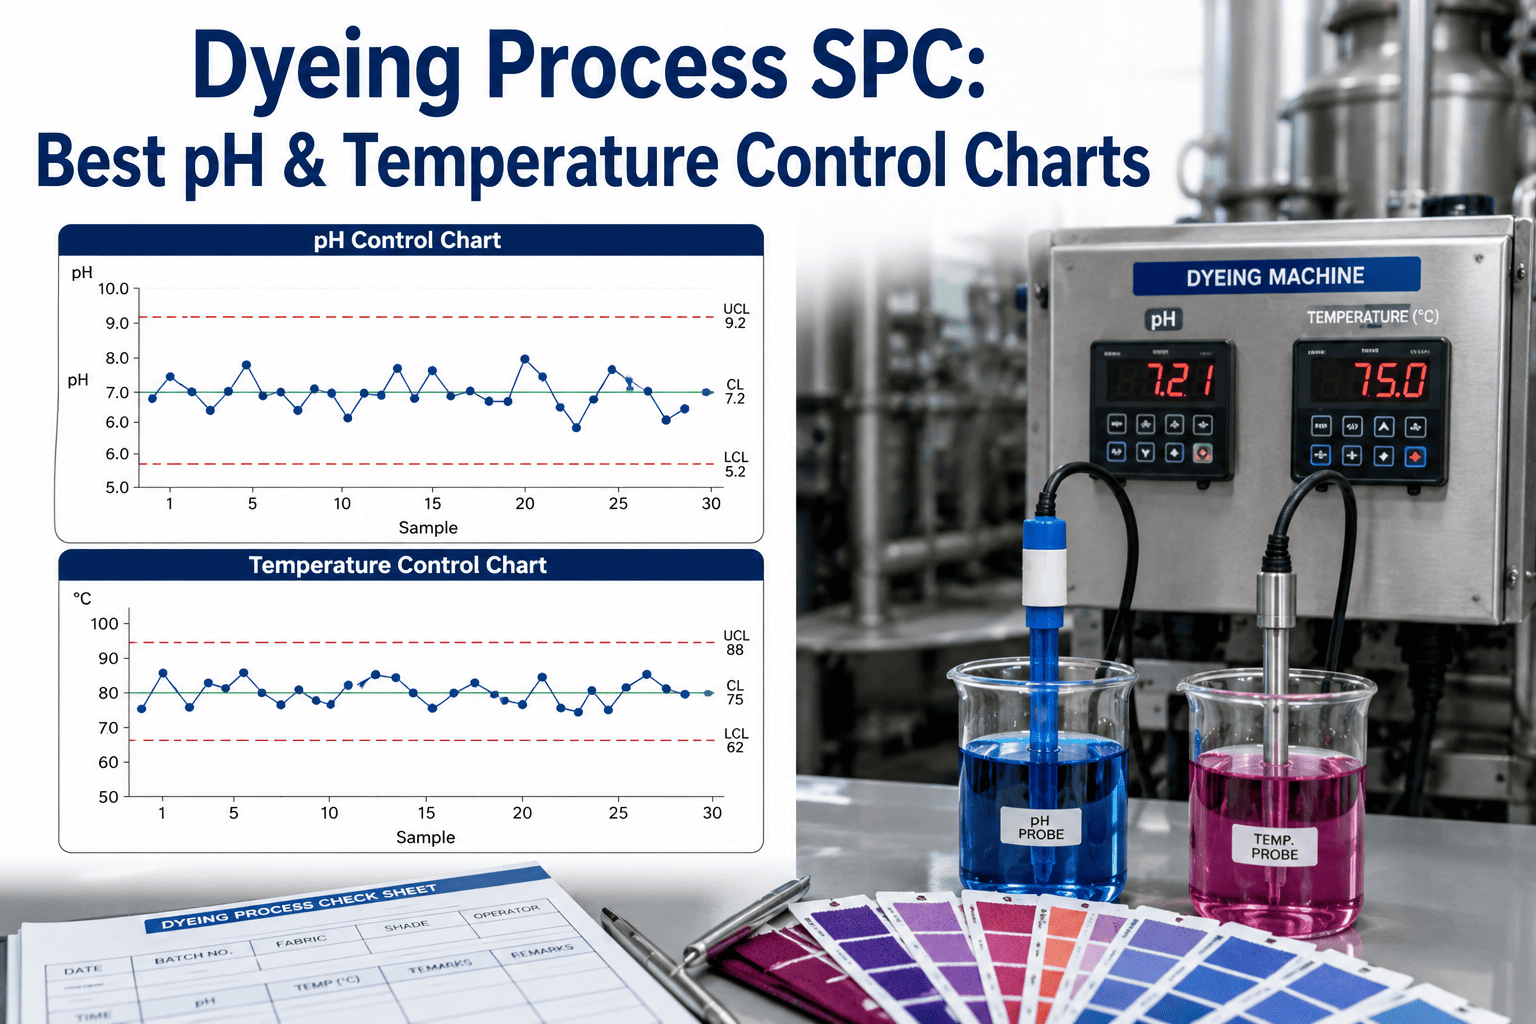
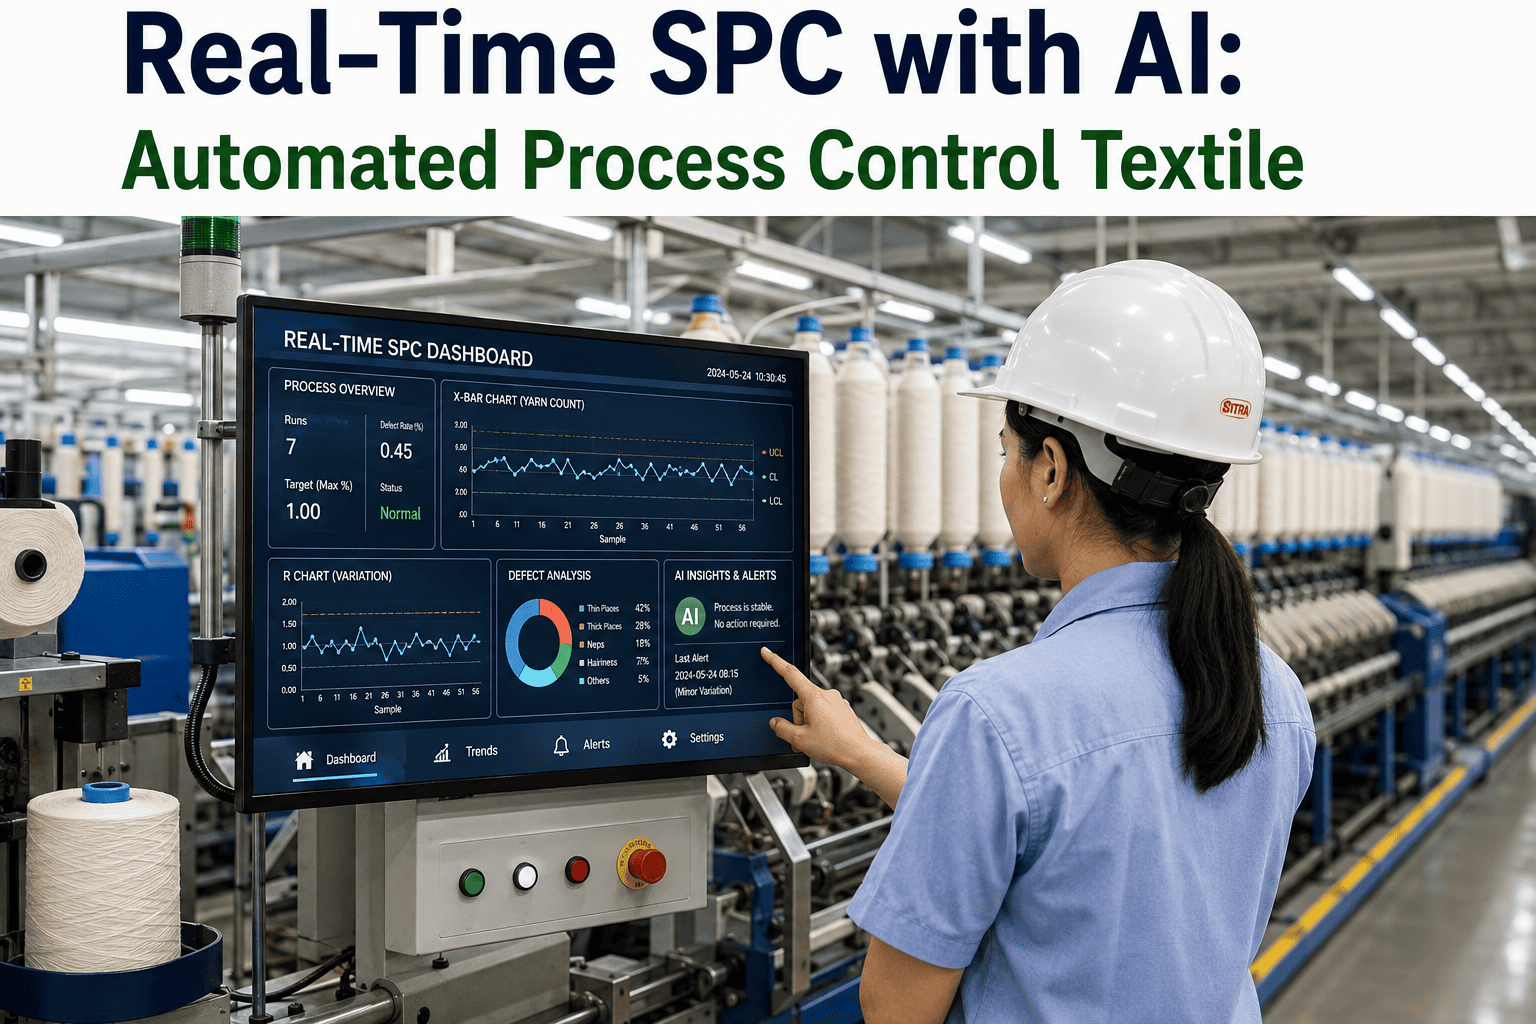
A dyeing batch can drift out of tolerance long before anyone notices a shade mismatch on the finished roll, because pH, temperature, time, and conductivity rarely fail all at once — they creep. A bath running half a point of pH away from target for twenty minutes can consume dye unevenly, and by the time an operator pulls a lab dip the batch is already committed. Statistical process control turns these four parameters into a running record instead of a single end-of-cycle check, flagging the moment a reading drifts outside its control limit rather than after the fabric has already absorbed the consequences. Plants that still rely on hourly spot-checks are effectively sampling a process that changes by the minute. See how automated SPC charts catch drift on your dyeing floor.
Snapshot
SPC control charts plot pH, temperature, time, and conductivity against upper and lower control limits calculated from your own process history, not generic textbook values. When a reading breaches a limit or shows a run of consecutive points trending in one direction, the system raises an alarm while the bath can still be corrected, typically ten to twenty minutes before the deviation would otherwise show up as a shade or fastness defect on the finished batch.
Turn Four Numbers Into an Early Warning System
iFactory streams pH, temperature, time, and conductivity from your dyeing machines into live control charts with automated out-of-control alarms, so a drifting bath gets corrected instead of discovered at the lab dip.
Why Spot-Checks Miss the Drift That Ruins a Batch
Manual monitoring samples a process at a handful of fixed points in the cycle, which works fine when conditions are stable and fails quietly whenever they are not.
01
Hourly checks miss minute-to-minute swingsA steam valve sticking open for fifteen minutes can push bath temperature two or three degrees above target and fully recover before the next scheduled reading, leaving no trace in the log even though the fabric already absorbed dye under the wrong condition.
02
A single reading cannot show a trendpH creeping upward across six consecutive readings is a statistically meaningful signal that something in the auxiliary dosing is off, but each individual reading can look perfectly acceptable on its own when viewed in isolation rather than as a sequence.
03
Operators react to the last defect, not the next oneWithout a running chart, corrective action is usually triggered by a failed lab dip rather than by the process data itself, which means the correction always arrives after the batch that caused the complaint has already been dyed.
04
Conductivity drift is almost never checked manuallySalt and auxiliary dosing errors show up first in bath conductivity, but very few floors log this parameter by hand at all, so a dosing mistake often goes completely unnoticed until dye exhaustion or shade depth is visibly affected.
The Four Parameters Every Dyeing SPC Chart Should Track
Each parameter reveals a different failure mode, which is why a chart tracking only one or two of them still leaves blind spots in the process.
pH
Governs dye reactivity and fixation rate. A pH that drifts outside the target band changes how quickly dye exhausts onto the fiber, producing uneven depth and, in reactive dyeing, incomplete fixation that shows up later as poor wash fastness.
Temperature
Controls dye diffusion rate and migration. Overshoot accelerates strike rate unevenly across the batch while undershoot slows exhaustion, and either one shifts the achieved shade away from the approved lab standard.
Time
Determines whether the bath reaches equilibrium exhaustion. Cutting a hold stage short leaves dye in the liquor rather than on the fiber, while an extended hold beyond the process window wastes energy without improving depth.
Conductivity
Reflects salt and electrolyte concentration in the bath. Since electrolyte level directly affects dye exhaustion in most reactive and direct dyeing processes, a conductivity reading outside range signals a dosing error before it affects the finished shade.
Control Limits at a Glance
Control limits should be calculated from your own historical process data rather than copied from a generic reference, but the ranges below reflect typical bands used as a starting point across reactive dyeing processes.
| Parameter |
Typical Target Band |
Common Out-of-Control Cause |
| Bath pH |
10.5 – 11.5 |
Alkali dosing pump drift or delayed alkali addition timing |
| Bath Temperature |
±1.5°C of setpoint |
Steam valve response lag or heat exchanger fouling |
| Hold Time |
±5 minutes of profile |
Operator override of the programmed cycle or timer fault |
| Conductivity |
±8% of target |
Incorrect salt dosing volume or weighing scale calibration drift |
See Your Own Control Limits, Not a Generic Reference Table
iFactory calculates upper and lower control limits from your machine's own dyeing history, so alarms reflect how your specific process actually behaves rather than a textbook range that may not fit your recipe mix.
Building the Control Chart: A Five-Step Rollout
Moving from manual logs to live SPC charting does not require replacing existing sensors on most machines, only connecting what is already there to a consistent analysis layer.
1
Pull baseline data from recent good batchesHistorical readings from batches that passed lab approval establish what a normal, in-control process actually looks like for each machine and recipe family before any limits are set.
2
Calculate control limits per parameter, per machineUpper and lower limits are set from the variation naturally present in the baseline data, since a shared machine or dye class often runs a different acceptable band than another.
3
Stream live readings into the chartExisting pH probes, temperature sensors, and conductivity meters feed continuous readings into the chart in real time, plotting each new point against the calculated limits as the batch progresses.
4
Set automated alarms for limit breaches and trend runsAlarms trigger both on a single point crossing a control limit and on a run of several consecutive points moving in the same direction, catching gradual drift as well as sudden excursions.
5
Review and recalculate limits on a fixed scheduleControl limits are revisited periodically as recipes, dye lots, or machine conditions change, keeping the chart accurate rather than letting it drift out of sync with the current process.
What Plants See After Implementation
10–20 min
Typical Early Warning Before a Defect Would Appear
4
Core Parameters Tracked Continuously
Zero
New Sensors Typically Required
Per Machine
Control Limits Calculated Individually
We were logging pH and temperature by hand every hour and still getting shade complaints we could not explain. Once we saw the readings plotted as a continuous chart instead of a list of numbers, the pattern was obvious — our alkali pump was drifting slowly over each shift and recovering right before the next manual check. We would never have caught that from spot readings alone.
Dyeing Floor Manager
Reactive Dyeing Unit — Gujarat
Frequently Asked Questions
QDo we need new sensors to start SPC charting?
Most dyeing machines already carry pH probes, temperature sensors, and dosing controllers that produce the readings an SPC chart needs, so the gap is usually in connecting and analyzing that data rather than in missing instrumentation. Conductivity meters are the one parameter more likely to be absent on older machines, and adding one is a relatively low-cost step compared to reworking the rest of the monitoring setup.
Talk to an expert about what your current machines already support.
QHow are control limits different from the recipe tolerance in our dyeing procedure?
Recipe tolerance is usually a fixed band written into the standard operating procedure, while statistical control limits are calculated from the actual variation your process shows when it is running well. A process can be within recipe tolerance and still be statistically out of control if it shows a trend or unusual pattern, which is exactly the kind of early signal a fixed tolerance band alone cannot detect. Both are useful together rather than as substitutes for each other.
QWhat happens when an alarm triggers mid-batch?
An out-of-control alarm is meant to prompt operator investigation and correction while the bath can still be adjusted, such as correcting a dosing pump, adjusting a steam valve, or extending a hold stage, rather than automatically stopping the machine. The specific corrective action depends on which parameter breached its limit and by how much, which is why the alarm includes the parameter, the direction of drift, and the magnitude rather than a generic warning.
QCan SPC charts work across multiple dye classes and recipe families on the same machine?
Yes, though control limits typically need to be calculated separately for each recipe family since a reactive dyeing process and a direct dyeing process on the same machine can have meaningfully different normal operating ranges for pH and conductivity in particular. Grouping recipes with similar chemistry together when calculating limits keeps the chart accurate rather than averaging distinct processes into one overly wide band.
QHow long does it take to see a measurable reduction in shade rejections after rollout?
Most plants see initial value within the first few weeks simply from operators reacting to real-time alarms instead of waiting for lab dip results, since that alone closes the gap between when a deviation occurs and when it is corrected. Recipe-specific control limits and trend-based alarms typically mature over four to eight weeks as enough batch history accumulates to fine-tune the limits for each machine and recipe family.
Book a demo to see a rollout timeline for your floor.
Stop Finding Out From the Lab Dip
iFactory streams pH, temperature, time, and conductivity into live SPC charts with automated alarms, so drift gets corrected mid-batch instead of discovered on the finished roll.
pH Monitoring
Temperature Tracking
Conductivity Charts
Automated Alarms