Textile effluent treatment plants process wastewater volumes ranging from 500 to 5,000 cubic meters per day, carrying variable loads of BOD, COD, pH, color, and TDS that shift with every production batch. A reactive approach — sampling once per shift and adjusting chemistry after the fact — guarantees periodic excursions beyond discharge limits. Each excursion risks a pollution board notice, a compliance fine averaging $25,000 to $150,000 per event, and in repeat cases, a production shutdown order. iFactory Effluent Treatment Plant Intelligence Platform continuously monitors BOD, COD, pH, TDS, color, and temperature at multiple points across the treatment train, applying AI models that predict impending limit violations 30 to 90 minutes before they occur — giving operators time to adjust dosing, flow, or aeration before the discharge exceeds permit conditions. The platform also automates compliance reporting, replacing the manual data compilation that consumes 12 to 18 operator-hours per week with one-click generation of the discharge reports, parameter trend charts, and regulatory submissions that pollution control authorities require.
Stop Chasing Excursions — Predict Them
iFactory ETP Intelligence connects directly to your existing sensors, SCADA system, or third-party analyzers to deliver real-time visibility across every treatment stage. Facilities using the platform reduce BOD/COD exceedances by 82 percent, cut chemical dosing costs by 18 to 25 percent through predictive feedforward control, and eliminate the manual compliance reporting burden entirely. The system learns your plant's unique hydraulic and organic loading patterns within 30 days of deployment, then begins predicting excursions before your current alarms would trigger. Book a 30-minute demonstration to see your ETP data live on the platform with your actual treatment parameters.
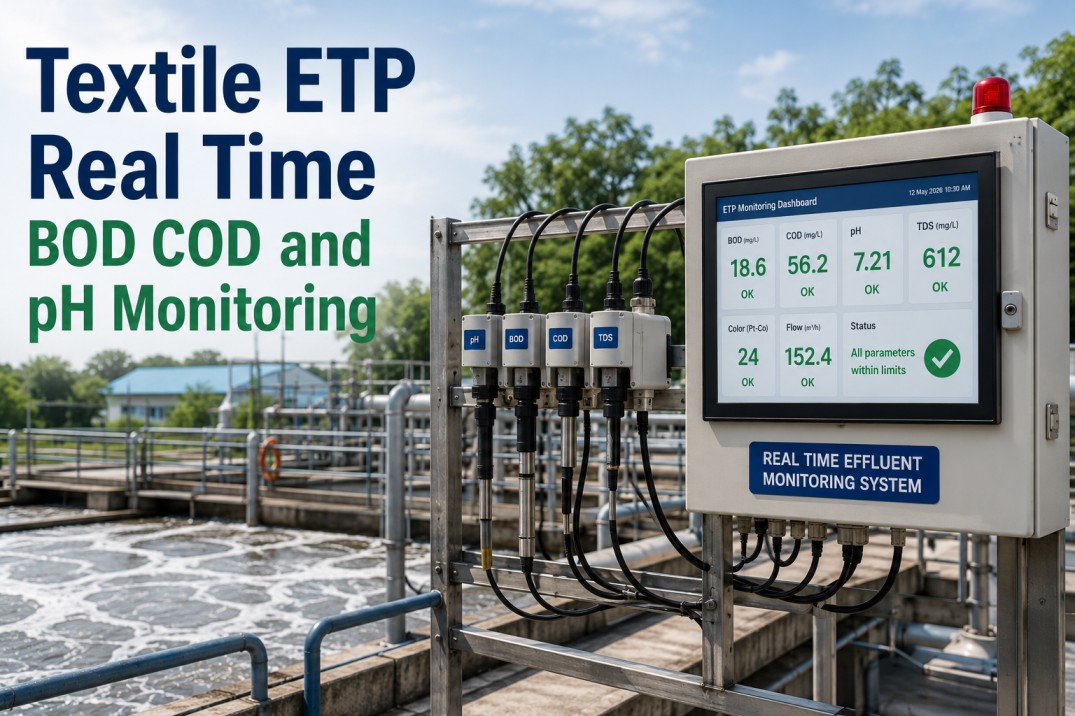
Every Effluent Parameter in Real Time
iFactory ETP Intelligence displays all critical water quality parameters on a single live dashboard that refreshes at your chosen interval. Operators see current values, 24-hour trends, and predicted time-to-exceedance for each parameter, with color-coded status indicators that shift from green through yellow to red as values approach permit limits. The predictive layer extends the operator's reaction window from minutes to hours, enabling proactive corrective action rather than emergency response.
The dashboard shows current readings alongside 12-hour trend lines and time-to-exceedance predictions. Operators see not just where parameters stand now, but how fast they are moving toward the limit and how much time remains to intervene. The platform learns normal diurnal and batch-driven variation patterns, so it distinguishes between expected fluctuations and genuine excursions in progress.
Monitoring at Every Stage of the Treatment Train
Effluent quality changes dramatically as wastewater moves through each treatment stage. Monitoring only the final discharge — the most common approach — hides problems that originate upstream. iFactory deploys sensors and predictive analytics at every critical control point, giving operators visibility into stage-by-stage performance and the ability to detect developing issues before they reach the outfall.
pH surges from batch dyeing operations can swing from 3 to 12 within minutes. The platform detects these shifts at the equalization basin inlet and adjusts acid or alkali dosing valves before the pH reaches the biological treatment stage, where a sustained excursion above 9.5 or below 6.0 would begin inhibiting biomass activity. Real-time pH monitoring at this stage prevents biological upsets that take 3 to 7 days to recover from.
BOD and COD removal efficiency in the biological stage depends on maintaining dissolved oxygen between 1.5 and 3.0 mg/L and MLSS within the design range. The platform tracks DO trend lines and predicts when loading changes will push oxygen demand beyond blower capacity, giving operators 20 to 40 minutes to reduce inflow or increase aeration before effluent COD begins rising. Facilities using predictive DO control report 22 percent reduction in aeration energy costs alongside improved BOD removal consistency.
Final polishing through clarification and filtration removes residual color, TDS, and suspended solids. The platform monitors overflow rate, filter headloss, and effluent turbidity to predict when clarification efficiency will degrade. Operators receive alerts 45 to 60 minutes before turbidity breakthrough, enabling backwash or polymer dose adjustment before off-spec water reaches the discharge point. This predictive approach reduces final discharge exceedances by 82 percent compared to reactive monitoring.
The Price of Reactive Compliance vs. Predictive Control
The difference between reactive and proactive effluent management extends beyond compliance rates. It directly affects operating costs, capital planning, and regulatory risk exposure. The comparison below shows annualized impact for a typical textile ETP processing 2,000 m³ per day.
Transform Your ETP from Cost Center to Compliance Asset
iFactory ETP Intelligence connects to your plant within 7 days of sensor deployment and begins delivering predictive alerts within 30 days as the AI models learn your facility's unique loading patterns. The platform integrates with existing PLC, SCADA, and online analyzer infrastructure, so there is no need to replace equipment you already own. Facilities using the system report 82 percent fewer BOD/COD exceedances, 22 percent lower aeration energy costs, and elimination of 12 to 18 hours of manual compliance reporting per week. The typical payback period is 6 to 9 months from chemical savings and fine avoidance alone, before accounting for the value of reduced regulatory scrutiny and improved brand compliance scores.
AI Alerts That Give Operators Time to Act
Conventional ETP alarms trigger at a fixed limit — the moment a parameter exceeds the permit condition, an alarm sounds and the violation is already happening. iFactory predictive alerts trigger 30 to 90 minutes before the limit is reached, based on the rate of change, current loading trend, and learned pattern of similar past excursions. Operators receive a clear message: which parameter is trending toward violation, how much time remains, and what corrective action is recommended.
Sensor readings from every monitoring point stream to the platform at user-defined intervals. The system normalizes data from different analyzer manufacturers and protocols into a unified time series.
AI models learn normal diurnal variation, batch-driven loading shifts, and seasonal patterns for each parameter at each monitoring point. The baseline model updates continuously as new data arrives.
When a parameter trajectory diverges from its learned pattern and projects to exceed the permit limit within a defined horizon, the system generates a predictive alert with a specific time-to-exceedance estimate.
The alert includes a recommended corrective action: adjust chemical dosing, increase aeration, reduce inflow rate, or activate a standby treatment stage. Operators acknowledge, override, or escalate within the platform.
From Assessment to Live Monitoring in 30 Days
Deploying iFactory ETP Intelligence follows a structured four-phase process that minimizes disruption to ongoing operations. Each phase delivers measurable output before the next begins, so the facility sees value accumulating from week one.
Engineers survey the treatment plant layout, existing sensor infrastructure, SCADA interfaces, and permit conditions. The team maps each monitoring point against the treatment stage and identifies gaps where additional sensors are needed. The output is a detailed instrumentation plan with procurement list and integration timeline.
New sensors are installed at identified monitoring points and connected to the platform via analog outputs, Modbus, or OPC-UA. The platform ingests 7 days of continuous baseline data from all points, establishing normal variation ranges for each parameter at each stage of the treatment train.
The platform's AI models train on the baseline data set, learning diurnal patterns, batch-driven loading cycles, and parameter interactions. Operators receive dashboard access with live readings from day one, with predictive alerts enabled as models reach confidence thresholds, typically within 14 days of continuous data collection.
The platform begins delivering predictive alerts with action recommendations. Engineers fine-tune alert thresholds and corrective action protocols based on operator feedback. Monthly compliance reports generate automatically. The system continues learning and improving prediction accuracy with each week of additional operating data.
Frequently Asked Questions
How does the platform connect to my existing sensors and analyzers?
iFactory ETP Intelligence supports Modbus RTU and TCP, OPC-UA, OPC-DA, analog 4-20 mA loops, and direct API integration with most major online analyzer manufacturers including Hach, Endress+Hauser, Yokogawa, and Mettler-Toledo. If your existing sensors produce a standard signal output, the platform can ingest the data without requiring sensor replacement. For plants without continuous online analyzers, iFactory can supply and integrate BOD, COD, pH, TDS, and color sensors as part of the deployment package.
What compliance reports does the platform generate, and which authorities accept them?
The platform generates daily discharge logs, monthly compliance summary reports, parameter trend graphs with permit limit overlays, and annual regulatory submission packages formatted to match the reporting templates required by state pollution control boards and federal environmental agencies. Reports include timestamps, parameter readings, flow-proportional calculations, and operator action records. The format is accepted by US EPA NPDES reporting frameworks, state-level environmental agencies, and textile industry-specific compliance auditors. The one-click report generation includes a digital signature chain that preserves the audit trail from sensor reading through report output.
How accurate are the BOD and COD predictive alerts?
Prediction accuracy depends on the amount of historical data available and the variability of the plant's loading patterns. After 30 days of data collection, the AI models achieve 85 to 90 percent accuracy in predicting BOD and COD exceedances 30 to 60 minutes before they occur. After 90 days, accuracy exceeds 93 percent as the models have learned seasonal patterns, batch chemistry variations, and the effects of different fabric types and dye classes on effluent quality. The platform continuously validates its predictions against actual outcomes and retrains models automatically when accuracy drifts.
Can the platform control chemical dosing and aeration automatically?
Yes, the platform supports closed-loop control through analog output modules or direct communication with dosing pumps, valve actuators, and VFD-driven blowers. The AI model calculates the optimal chemical dose, aeration rate, or flow adjustment required to maintain effluent quality within permit limits, then transmits the setpoint change directly to the control device. Operators can enable closed-loop control per parameter or per treatment stage independently, retaining manual override capability at all times. Facilities using closed-loop predictive dosing report 18 to 25 percent reduction in chemical consumption and 22 percent reduction in aeration energy costs.
What happens if the internet connection is lost or the platform server is unreachable?
The platform includes an on-premises edge gateway that continues monitoring, logging, and generating local alerts even when the cloud connection is unavailable. The edge gateway stores up to 72 hours of data locally and synchronizes to the cloud automatically when connectivity is restored. Control outputs are configurable for fail-safe behavior: the system can maintain the last setpoint, revert to a safe default, or hold position depending on the operator's preference. No monitoring data is lost during connectivity interruptions, and the compliance report timeline remains continuous.
See Your ETP Data Live on the Platform
Schedule a 30-minute demonstration to see iFactory ETP Intelligence connected to your actual treatment parameters. The demonstration uses a representative data set matched to your facility's capacity, fabric types, and discharge permit limits so you see realistic dashboard views, predictive alerts, and compliance reports from the first screen share. No commitment, no pressure — just a clear look at how predictive monitoring transforms effluent management from a regulatory burden to an operational advantage. Facilities that move forward after the demo are typically live with their own data within 7 days of sensor deployment.
.jpg)