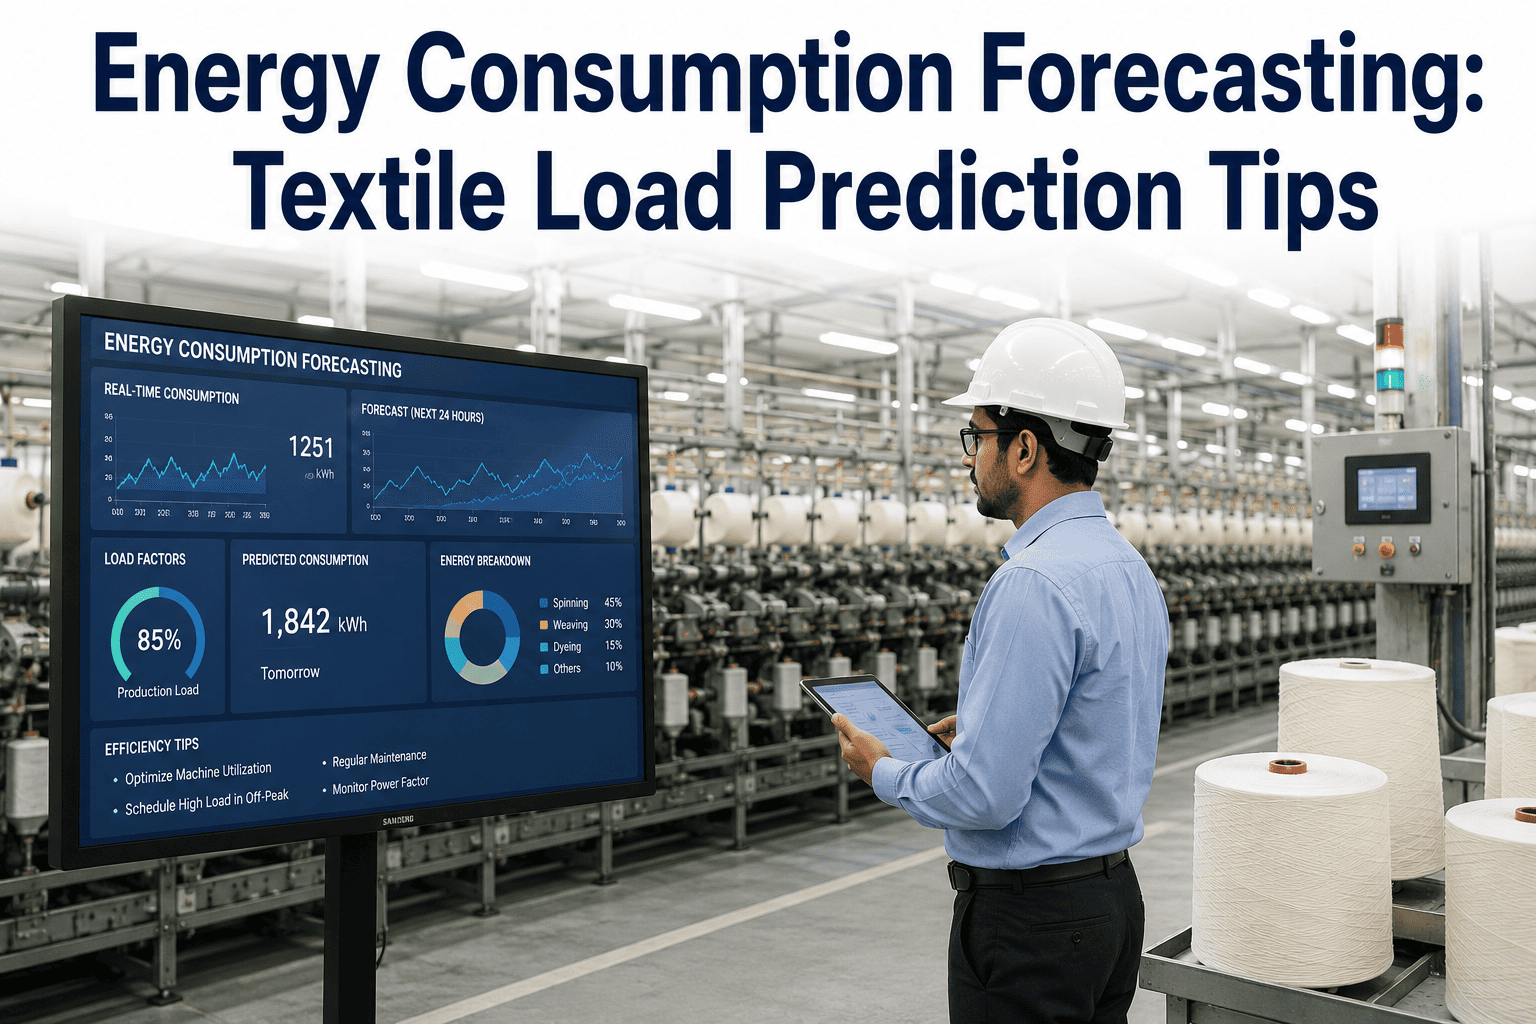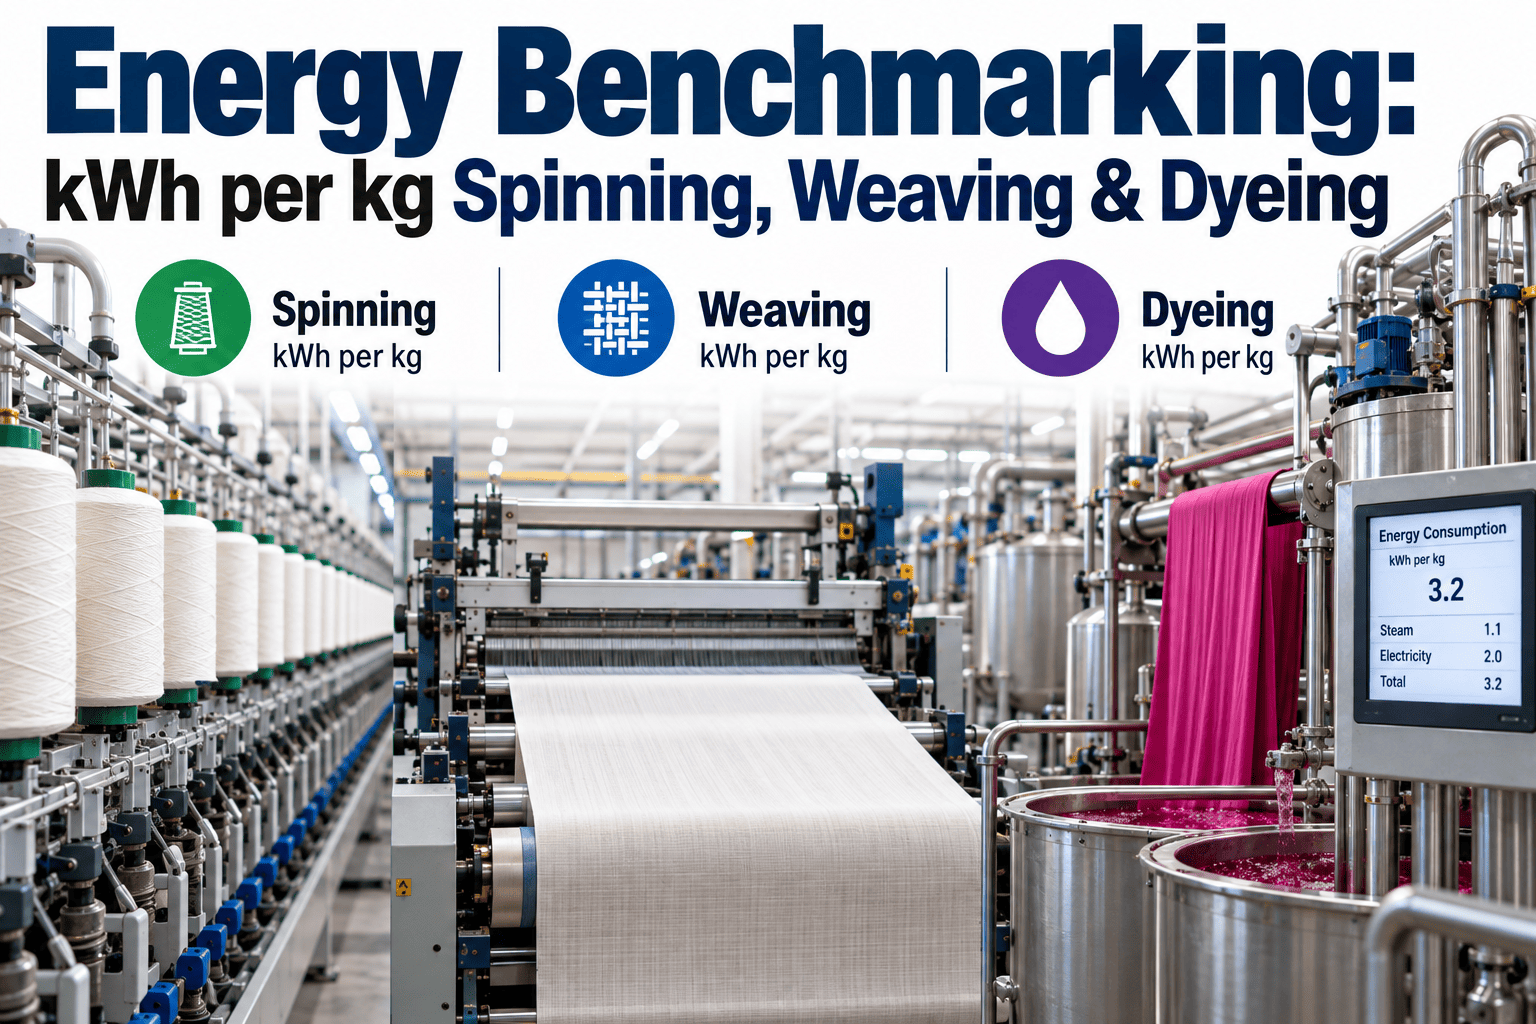
Most textile mills track total electricity spend every month, but a single utility bill doesn't say whether spinning is running efficiently or quietly burning 20 percent more power than it should per kilogram of yarn produced. Specific energy consumption — kWh per kg of output — is what actually reveals whether a department's energy use is in line with its process, because it strips out the effect of simply running more or fewer hours. Once each department has a real target range instead of a vague "use less energy" goal, gaps become specific and fixable rather than a number that only moves with production volume. You can get a walkthrough of your own numbers with iFactory AI to see how actual kWh per kg compares against target across every department.
Turn "We Used a Lot of Power This Month" Into a Specific, Fixable Number
iFactory AI benchmarks kWh per kg across spinning, weaving, dyeing, and finishing, so a department running above its target shows up as a specific gap instead of a line item on the electricity bill.
Total Consumption Rises and Falls With Volume, Not With Efficiency
A month with higher output will always show a higher total kWh number, and a month with lower output will show a lower one, regardless of whether either month was actually run efficiently. That makes total consumption almost useless for spotting a genuine efficiency problem.
Dividing consumption by output — kWh per kg — removes that volume effect and turns energy use into a rate that can be compared month to month, shift to shift, and against an industry or internal target, the same way OEE separates a slow week from a genuinely inefficient one. Mills that want to see this rate calculated automatically from their own meter data can book a specific energy consumption walkthrough rather than building the comparison by hand each month.
A busy month with slightly worse efficiency can still show lower total kWh than a quiet month run well, hiding the actual direction of performance.
Spinning, weaving, and dyeing have completely different energy profiles, so a single mill-wide kWh target tells almost nothing about any one department.
Without a defined target range, it's difficult to say whether a given month's number reflects a real problem or ordinary month-to-month variation.
Without knowing which department has the largest gap against its own target, energy-saving investment often goes to whichever area is easiest to reach rather than where it matters most.
Seeing Each Department's Actual Rate Against Its Own Target Band
A useful benchmarking view doesn't just list numbers — it shows each department's actual kWh per kg next to the range that department should realistically be running in, so a gap is visible at a glance rather than buried in a spreadsheet column. Talk to our team about setting up this gauge view against your own department meters.
In this pattern, weaving and finishing sit comfortably inside their target band, while spinning and dyeing are both running well above theirs. That split is exactly the kind of prioritization a mill needs — dyeing and spinning become the two places to investigate first, rather than a general instruction to reduce energy use everywhere at once.
What "Normal" Looks Like Across the Four Major Stages
| Department | Typical Target Range | Primary Energy Driver | Common Cause of Gap |
|---|---|---|---|
| Spinning | 0.9-1.1 kWh/kg | Spindle speed, motor loading | Oversized or aging motors, poor loading balance |
| Weaving | 0.6-0.75 kWh/kg | Loom speed, compressed air use | Compressed air leaks, idle-running looms |
| Dyeing | 3.5-4.2 kWh/kg | Bath heating, liquor ratio, agitation | High liquor ratio, poor heat recovery, reprocessing |
| Finishing | 1.0-1.3 kWh/kg | Drying, stentering, calendaring | Over-drying, poor exhaust heat capture |
Five Factors That Actually Drive Specific Energy Consumption
A motor running well below its rated load wastes a disproportionate share of the energy it draws, a common issue on older spinning frames.
A higher-than-necessary water-to-fabric ratio means more liquor to heat, which is one of the largest single levers on dyeing's energy intensity.
Undetected leaks in weaving and finishing air lines force compressors to run harder than actual production demand requires.
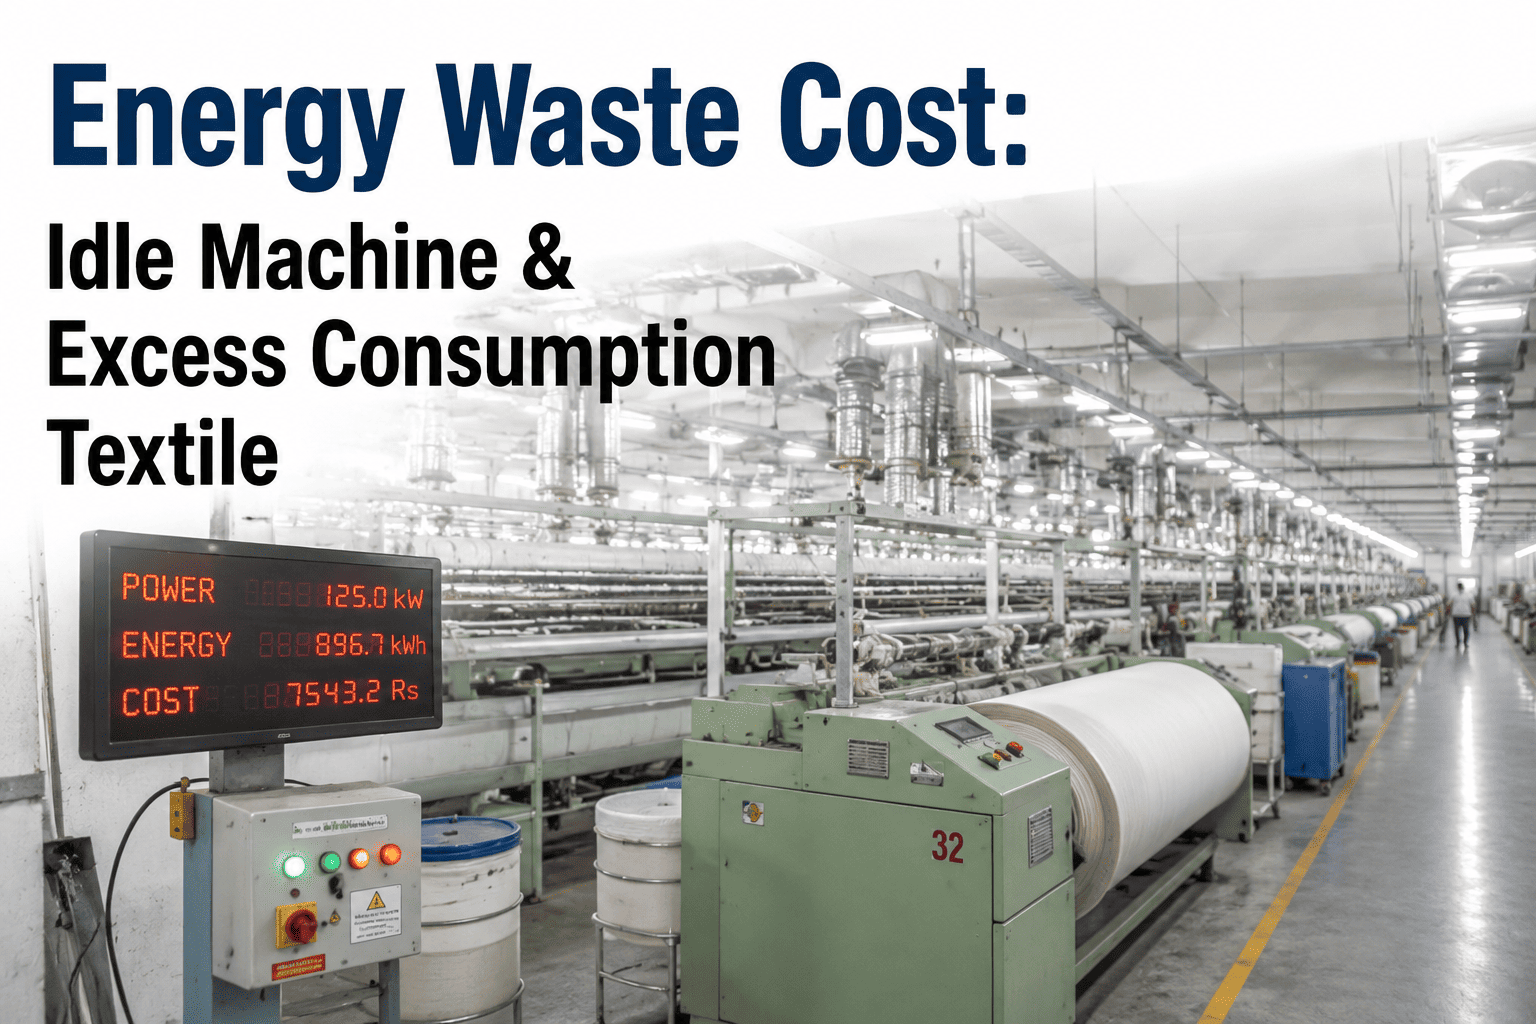
Machines left running between batches or during minor stoppages still draw significant power without adding a single kilogram of output.
A batch that has to be redyed or refinished due to a quality issue effectively doubles the energy spent on that kilogram of output.
Common Mistakes That Undercut a Benchmarking Program
Applying a single kWh/kg figure across spinning, weaving, and dyeing ignores how differently each process actually consumes energy.
An annual snapshot misses seasonal shifts, equipment degradation, and process changes that a monthly or weekly view would catch much earlier.
Heavier fabrics or darker shades naturally consume more energy per kilogram, and comparing periods with different mixes without adjusting for that skews the picture.
Chasing a small gap in a low-consumption department while ignoring a larger gap in a high-consumption one wastes limited improvement budget.
Closing a Persistent Dyeing Energy Gap
A mill's dyeing department had been running at roughly 5.1 kWh per kg for several months, well above its 3.5-4.2 kWh/kg target range, but the gap was masked in the monthly utility report because total plant consumption looked broadly consistent with prior periods.
Once dyeing was benchmarked separately, the liquor ratio on several older jet dyeing machines turned out to be running noticeably higher than the newer machines on the same floor. Adjusting the ratio and recovering more exhaust heat from the bath brought dyeing back within roughly 8 percent of its target range within two months.
Mills carrying a similar unexplained gap in dyeing or any other department can put their own numbers in front of an iFactory AI specialist to see where the same kind of gap is likely hiding.
Setting Up a Benchmarking Program That Sticks
Sub-meter electricity by department where possible, since a single mill-wide meter can't separate spinning's consumption from dyeing's.
Set a target range for each department rather than a single fixed number, since normal process variation makes a single-point target impractical.
Adjust targets for product mix, since a run of heavier fabric or darker shades will naturally push kWh/kg higher without indicating a real problem.
Review the gap between actual and target monthly at minimum, and prioritize improvement work on whichever department shows the largest sustained gap.
Mills unsure what their current metering setup can already support can check with our support team before adding new hardware, since a phased rollout is usually more practical than instrumenting everything at once.