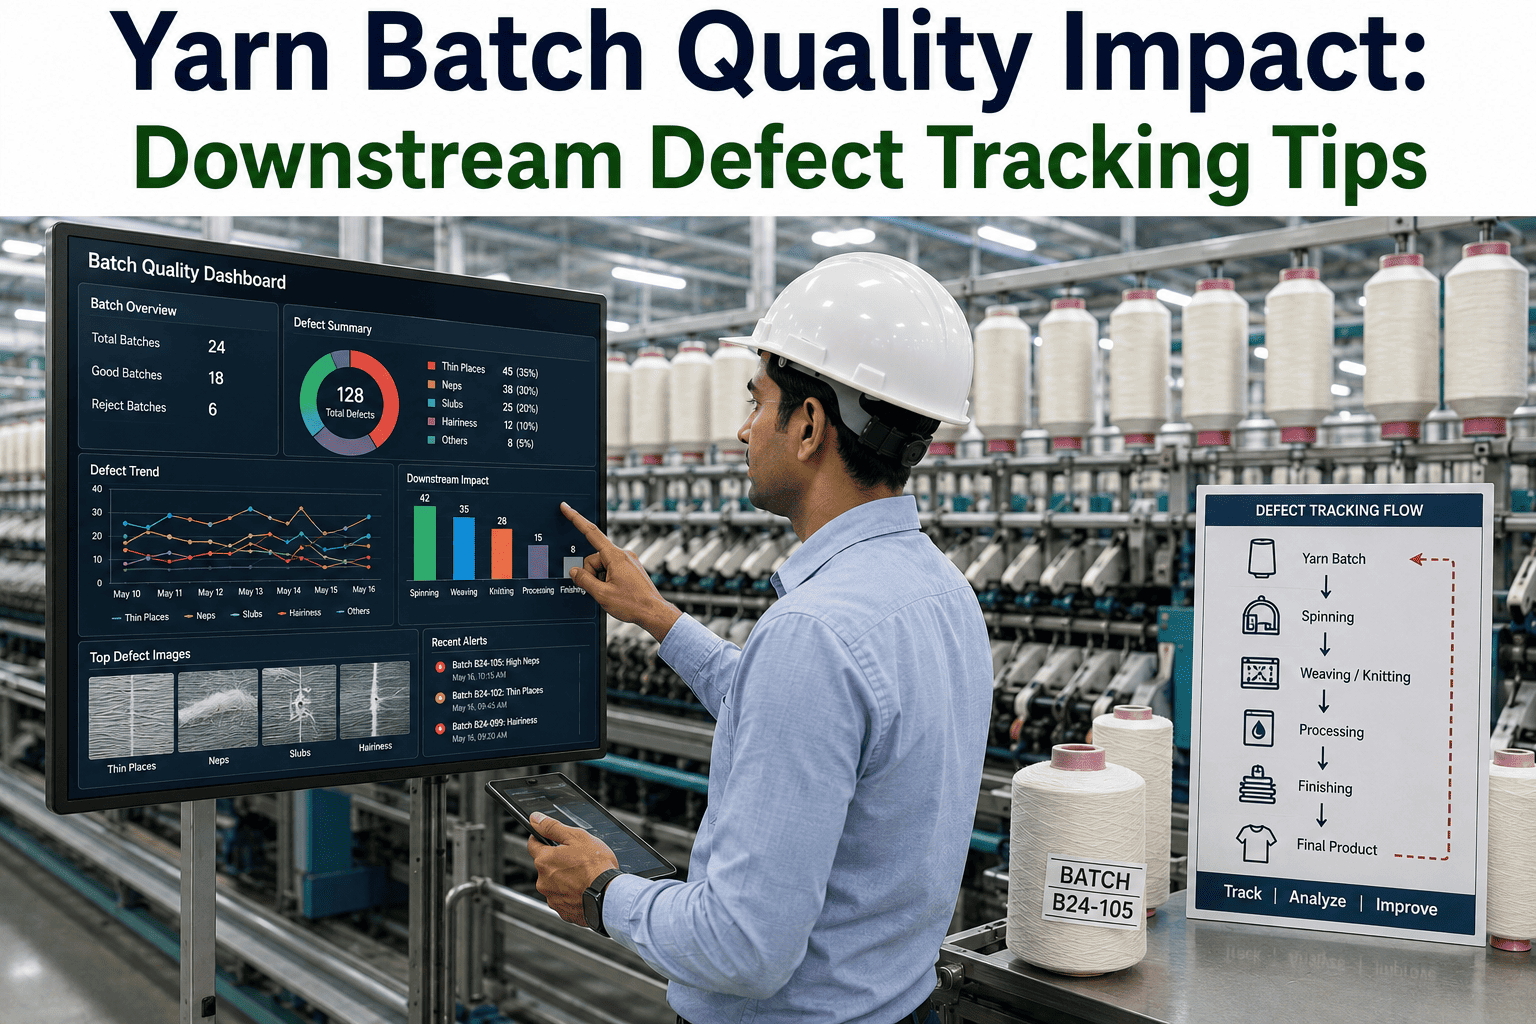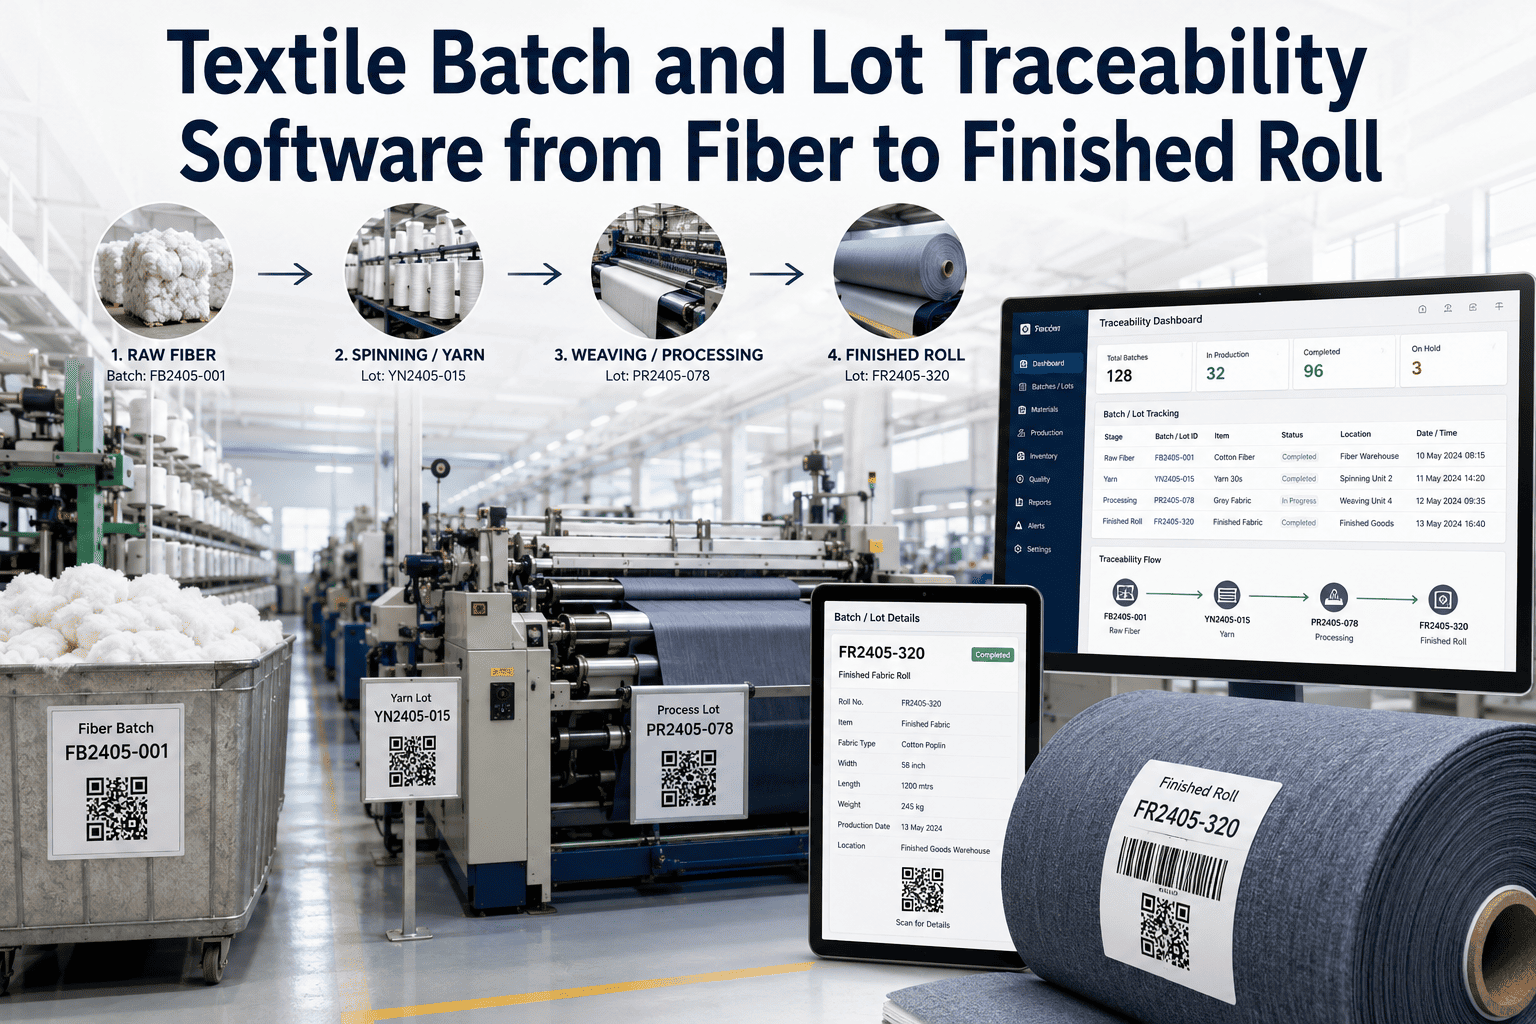
Two rolls of the same fabric, same specification, same nominal process — one comes off the line clean and the other has a recurring thin place every few hundred meters. The fiber content is identical. The machine settings on paper are identical. What's different is everything a simple "which batch was this" record can't capture: which yarn lot fed the creel, which specific loom ran it, which operator was on shift, and what time of day the drift actually started. iFactory's multi-dimensional traceability links every defect back to all four of those variables at once, not just the one that happens to be easiest to log.
Fabric Defect Traceability: Linking Yarn, Machine, Operator & Shift
Most fabric defects don't have one cause — they have a specific combination of causes that only shows up when you can cross-reference all four traceability dimensions at once. This guide covers how to build that cross-reference and read it correctly.
Why a Single-Dimension Defect Log Misses the Real Pattern
Most textile quality systems record a defect against one primary dimension — usually the machine or the batch — and treat the others as supplementary notes if they're captured at all. This produces a defect log that looks organized but answers the wrong question. Knowing that Loom 7 produced twelve defects this month tells you Loom 7 has a problem. It does not tell you whether that problem is mechanical, whether it only happens with a specific yarn supplier's lot, whether it clusters on one operator's shifts, or whether it's actually a combination — a specific yarn lot that only causes trouble on Loom 7 because of a tension calibration difference between that loom and the others.
Knitted and woven fabric defects have long been understood to originate from three broad sources acting together rather than in isolation: faults introduced by the yarn itself, faults introduced during the knitting or weaving process, and faults introduced by the surrounding environment. A defect log that only captures one of these three loses the ability to see when two or three are compounding — and compounding causes are exactly the ones that keep recurring after a single-cause fix has already been tried and failed.
This has a practical consequence that shows up repeatedly in quality review meetings: a team investigates a defect, finds a plausible explanation on the one dimension they happened to be looking at, implements a fix, and watches the defect return within weeks. The fix wasn't wrong — it addressed a real contributing factor. It just wasn't the only contributing factor, and without visibility into the other dimensions, there was no way to know that going in. Multi-dimensional traceability doesn't replace root cause investigation; it makes sure the investigation starts with the full picture instead of whichever slice of it happened to be easiest to pull up.
Stop Guessing Which Dimension Actually Caused the Defect
iFactory logs every defect against yarn lot, machine, operator, and shift simultaneously, so a Pareto analysis can finally show which combination is really driving the pattern.
The Four Traceability Dimensions
Each of the four dimensions below captures a different category of root cause, and each requires a different data source to link reliably. Building all four into the same defect record — rather than four separate logs that have to be manually cross-referenced after the fact — is what makes multi-dimensional root cause analysis actually possible.
Yarn-originated defects trace back to the raw material itself: slubs from irregular thickness, broken ends from insufficient tensile strength, dye lot inconsistency, contamination introduced during spinning. Linking a defect to a specific yarn lot — not just a general supplier or a broad receiving date — requires that the yarn's lot identifier travel with the physical package from receiving through creel loading and into the specific production run it feeds. A defect that recurs across multiple machines but consistently traces back to the same yarn lot is a strong signal the root cause sits upstream of the production floor entirely.
Machine-originated defects trace back to mechanical condition and calibration: tension settings drifting out of specification, a worn reed causing consistent thread damage, a needle or harness fault producing a repeating pattern defect at a fixed interval. Because these defects often repeat at a predictable spacing tied to a specific mechanical component's cycle, linking the defect to the specific machine — and ideally the specific settings in effect at production time, not just the machine's identity — turns a vague "Loom 7 is having problems" into a specific, correctable mechanical finding.
Operator-linked defects trace back to setup and in-process monitoring decisions: threading errors, tension adjustments made by feel rather than by specification, delayed response to an early warning sign the machine itself flagged. This dimension is the one most often tracked poorly or not at all, in part because it can feel punitive to log — but the goal of operator linkage is not to assign blame for an individual defect, it is to identify where additional training, a clearer setup procedure, or a redesigned monitoring workflow would prevent the same class of defect from recurring across multiple operators, not just one.
Shift-linked defects trace back to conditions that vary by time of day or by the handoff between crews: humidity and temperature fluctuations affecting fiber behavior, a night shift running with less direct supervisor oversight, a defect rate that spikes specifically in the hour immediately following a shift change — often a sign the outgoing operator's in-progress observations aren't being effectively communicated to the incoming one. This dimension is frequently the hardest to see because it requires enough historical data, tagged consistently by shift, to distinguish a real time-of-day pattern from ordinary day-to-day variation.
Reading the Cross-Reference: Single-Cause vs. Compounding Defects
The real diagnostic power of multi-dimensional traceability shows up when a defect appears across more than one dimension at once. A defect concentrated on a single machine, regardless of yarn lot or operator, points to a mechanical root cause. A defect concentrated on a single yarn lot, regardless of machine or operator, points to a material root cause. But a defect that only appears when a specific yarn lot runs on a specific machine — and doesn't appear when either factor is present alone — is a compounding cause, and it is the pattern most likely to survive a single-dimension corrective action untouched.
Statistical process control tools built for exactly this kind of investigation — Pareto charts ranking defect frequency by category, control charts tracking defect rate over time against expected variation, and proportion-defective charts monitoring whether a process remains in statistical control — become considerably more useful once the underlying data carries all four dimensions rather than just one. A Pareto chart built from machine-only data will rank machines by defect count and stop there. The same chart, built from data that also carries yarn lot, operator, and shift, can be re-sliced along any of those axes without recollecting anything, turning one dataset into as many diagnostic views as the investigation actually needs.
| Pattern Observed | Likely Root Cause Category | Typical Corrective Action | Confidence |
|---|---|---|---|
| Defect follows one machine, any yarn, any operator | Mechanical / calibration | Inspect and recalibrate the specific machine | High |
| Defect follows one yarn lot, any machine, any operator | Material / supplier quality | Quarantine the lot, escalate to supplier | High |
| Defect follows one operator, any machine, any yarn | Setup or monitoring procedure | Retrain on specific procedure step | Moderate |
| Defect clusters at shift changeover only | Handoff communication gap | Structured handoff checklist | Moderate |
| Defect only appears on specific yarn + specific machine combo | Compounding — tension/calibration mismatch | Adjust machine setting for that yarn type specifically | Requires cross-reference |
| Defect spread evenly across all dimensions | Process design or specification issue | Review the underlying process parameters themselves | Requires deeper investigation |
See Compounding Causes That a Single-Dimension Log Would Miss
iFactory's cross-reference view shows defect concentration across all four dimensions simultaneously, surfacing the yarn-machine combinations that only cause trouble together.
Classifying Defects for Consistent Cross-Referencing
Cross-referencing across four dimensions only works if the defect itself is classified consistently — a mixed vocabulary of defect names undermines every downstream Pareto analysis. Textile quality control commonly grades defects by size using a points system: minor defects spanning up to 3 inches score 1 point, 3 to 6 inches score 2 points, 6 to 9 inches score 3 points, and anything beyond 9 inches scores as a major, cut-able defect at 4 points. Applying this consistently, alongside a standardized defect-type taxonomy — separating a broken end from a slub from a dropped stitch, rather than lumping them into a generic "fabric fault" category — is what makes the yarn, machine, operator, and shift cross-reference meaningful rather than noisy.
Slubs and irregular thickness typically trace to yarn quality. Broken ends and broken picks often trace to yarn tensile strength combined with machine tension settings — a compounding pattern. Dropped stitches and skipped stitches typically trace to needle condition or threading, pointing toward the machine and operator dimensions. Oil stains and machine marks trace almost exclusively to the machine dimension, specifically lubrication and maintenance condition. Color and dye lot inconsistency traces to the yarn dimension, upstream of the weaving or knitting process entirely. Classifying each incoming defect against this kind of likely-origin taxonomy before cross-referencing narrows the analysis considerably, rather than treating every defect as equally likely to originate from any of the four dimensions.
Common Mistakes in Fabric Defect Traceability
Logging the machine but not the yarn lot feeding it. Machine identity is usually the easiest data point to capture automatically, which means it gets logged consistently while yarn lot — which often requires a manual scan at the creel — gets skipped under time pressure. This asymmetry biases every subsequent analysis toward finding machine-only causes.
Treating operator linkage as a blame exercise. When operators sense that logging their shift against a defect is used punitively, the data quality on that dimension degrades — defects get logged late, vaguely, or not at all. The dimension exists to find training and procedure gaps, not to identify individuals for discipline, and the logging system needs to visibly reflect that distinction.
Analyzing each dimension separately instead of cross-referencing. A monthly report showing "defects by machine" and a separate report showing "defects by yarn lot" will never surface a compounding cause, because the pattern only exists in the intersection of the two, not in either one viewed alone.
Using inconsistent defect-type naming across shifts or inspectors. If one inspector logs a defect as "thin place" and another logs the visually identical issue as "unevenness," the Pareto analysis undercounts both categories and never surfaces either as the priority it actually is.
Not tagging defects by shift consistently. Time-of-day and handoff-related patterns are the hardest to see under normal circumstances, and they become invisible entirely if shift isn't captured as a first-class field on every defect record, not an optional note added when convenient.
Defect Traceability KPIs to Track
Four-Dimension Capture Rate
Percentage of logged defects with all four dimensions — yarn lot, machine, operator, and shift — recorded, not just the one or two easiest to capture automatically.
Compounding Cause Identification Rate
Share of recurring defect patterns correctly identified as a cross-dimension combination rather than attributed to a single dimension in isolation.
Overall Defect Rate
Total defective output as a percentage of production, tracked consistently against the same defect-type taxonomy across every shift and line for a comparable baseline.
Repeat Defect Rate After Corrective Action
Same defect type recurring on the same machine, yarn lot, or operator within a defined period after a corrective action was closed. A high repeat rate signals the corrective action addressed a symptom, not the actual root cause.
I've walked into more than one plant that had already tried to fix the same defect twice — recalibrated the loom, then separately audited the yarn supplier, and the defect kept coming back both times. What nobody had checked was whether the defect only showed up when that specific yarn ran on that specific loom. Once we cross-referenced the two dimensions instead of investigating them one at a time, the pattern was obvious within an afternoon. Most persistent defects aren't mysterious. They're just being investigated one dimension short of where the actual answer lives.
Turning Cross-Referenced Data Into a Standing Practice
Building the four-dimension capture is only the first step. The pattern only becomes visible if someone actually reviews the cross-reference on a regular cadence, and reviews it in a way that specifically looks for combinations, not just single-dimension leaders. A weekly quality meeting that opens with "which machine had the most defects this week" will keep surfacing the same kind of answer every time, because that is the question being asked. A meeting that instead opens with "did any yarn lot and machine combination show a defect rate meaningfully higher than either factor's rate alone" trains the team to look for exactly the pattern that single-dimension review structurally cannot find.
This is also where defect classification consistency pays off directly — a review that can filter cleanly by defect type, not just by count, can ask a much sharper question: not "did Loom 7 have more defects" but "did Loom 7 have more broken-end defects specifically, and does that concentration hold across every yarn lot or only certain ones." The second question is answerable only when the underlying data was captured with enough consistency and granularity to support it, which is exactly why classification discipline and multi-dimensional capture have to be built together rather than treated as separate initiatives.
Frequently Asked Questions
A single-dimension cause means a defect concentrates on one traceability dimension regardless of the others — for example, appearing on one specific machine no matter which yarn lot or operator is involved, pointing clearly to a mechanical root cause. A compounding cause means the defect only appears when two specific dimensions intersect — a particular yarn lot combined with a particular machine's tension settings, for instance — and does not appear when either factor is present without the other. Compounding causes are the pattern most likely to survive a single-dimension corrective action, because fixing only the machine or only investigating the yarn in isolation never reveals the actual interaction driving the defect. Book a demo to see how iFactory's cross-reference view surfaces compounding causes automatically.
Operator linkage tends to degrade in data quality specifically because it can be perceived as a blame mechanism rather than a diagnostic one — when logging a defect against a shift feels punitive, operators understandably become less diligent about capturing it accurately or promptly. The dimension's actual purpose is identifying where a setup procedure, a training gap, or a monitoring workflow needs improvement across the workforce broadly, not flagging individuals for correction. Quality systems that make this distinction visible in how the data is used — reviewing patterns across operators rather than singling out individuals — tend to see meaningfully better data quality on this dimension. Book a demo to see how iFactory frames operator data as a training and procedure signal, not a disciplinary record.
Shift-linked patterns often trace to conditions that vary predictably by time of day — humidity and temperature fluctuations affecting fiber behavior, reduced direct supervision during off-hour shifts, or a defect spike specifically in the window right after a shift change, which frequently points to an incomplete handoff between outgoing and incoming operators rather than either operator individually. These patterns are invisible unless shift is captured as a consistent, first-class field on every defect record, because distinguishing a genuine time-of-day trend from ordinary day-to-day variation requires enough consistently tagged historical data to run a real statistical comparison. Book a demo to see shift-pattern analysis applied to your own defect history.
Yes — consistent defect classification is a prerequisite for meaningful cross-referencing, not an optional refinement. A points-based sizing system, commonly grading defects from 1 point for small imperfections up to 4 points for major cut-able defects based on length, combined with a standardized defect-type taxonomy that distinguishes a broken end from a slub from a dropped stitch, ensures that every inspector and every shift is describing the same defect the same way. Without that consistency, a Pareto analysis across yarn, machine, operator, and shift will undercount or fragment categories that are actually the same underlying issue described differently. Book a demo to see how iFactory standardizes defect classification across every inspector and shift.
The mechanics of capturing all four dimensions — yarn lot, machine, operator, and shift — on every defect can be implemented relatively quickly, often within weeks, since much of the underlying data already exists somewhere in production records. What takes longer is accumulating enough consistently tagged history to distinguish a genuine pattern from ordinary process variation, particularly for shift-based and compounding patterns that need a meaningful sample size across multiple time periods and combinations before a trend becomes statistically distinguishable from noise. Most plants see clear single-dimension patterns within the first month or two and start surfacing genuine compounding causes over a longer multi-month window as the dataset deepens. Book a demo to see a realistic timeline for your specific production volume and defect rate.
Give Every Defect a Complete Cause Profile, Not Just a Machine Number
iFactory links yarn lot, machine, operator, and shift to every defect automatically, so root cause analysis starts with a complete cross-reference instead of four separate reports nobody has time to reconcile.