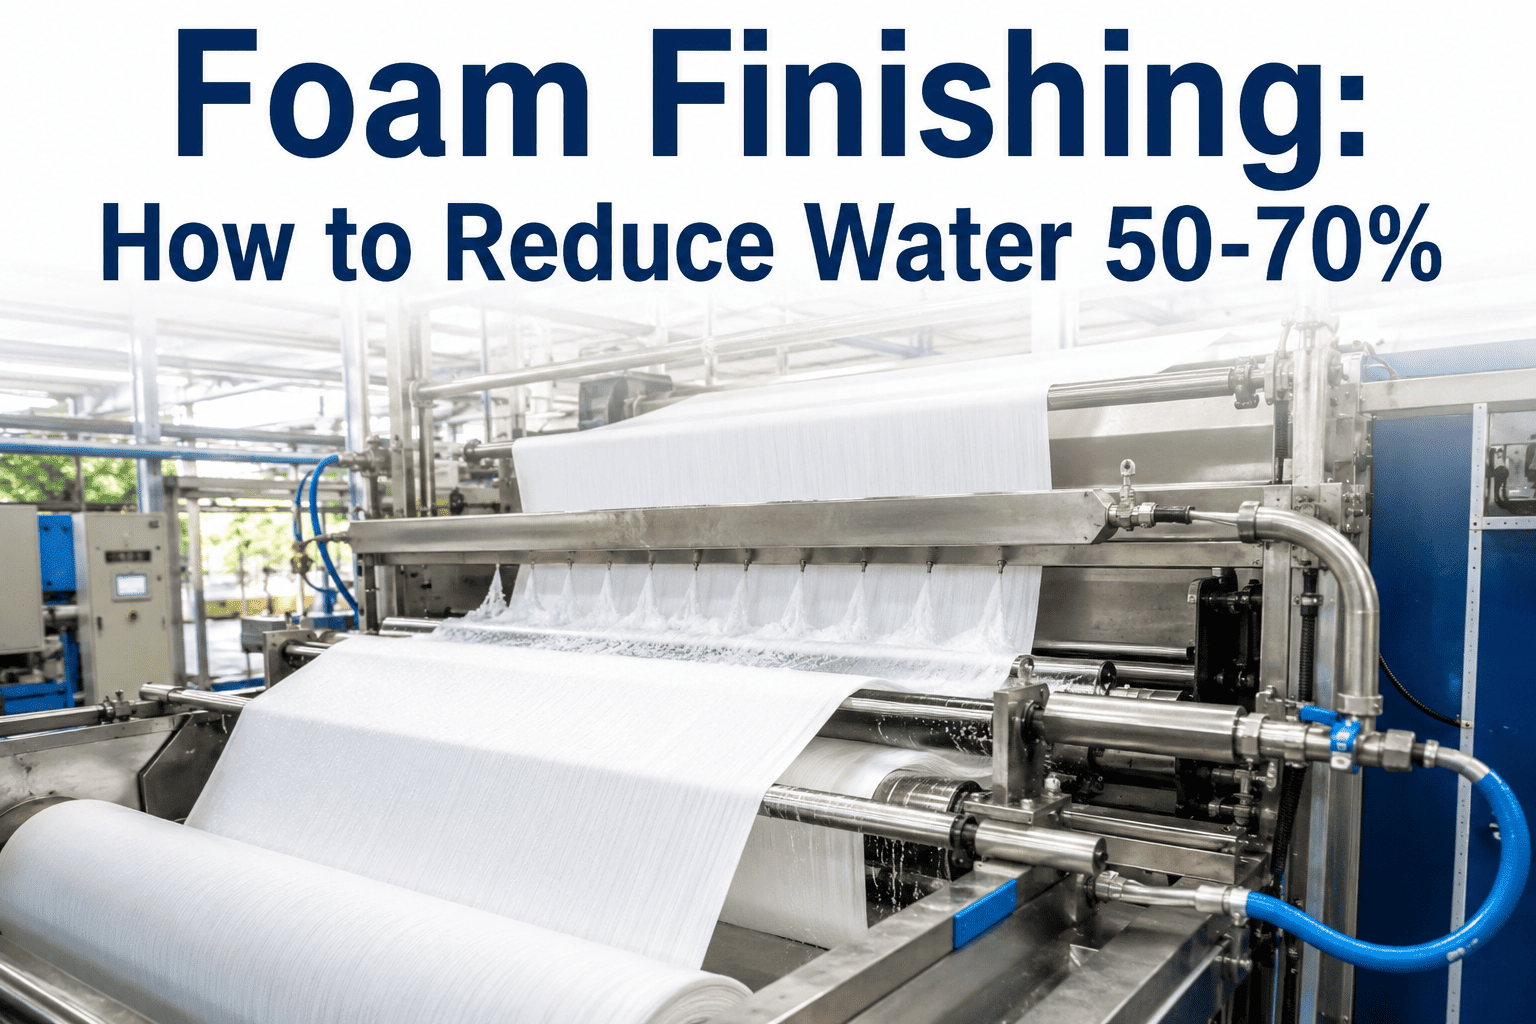
Conventional pad application saturates fabric with far more finishing liquor than the fabric actually needs to hold the target chemical add-on, and the excess simply gets driven off in the dryer at real energy cost. Foam finishing replaces that liquid bath with a stable foam carrying the same active chemistry in a fraction of the water volume, and because there is dramatically less water to evaporate, drying energy drops alongside water consumption. For finishing plant managers evaluating water and energy reduction projects, foam application is one of the few retrofits that improves both utility lines simultaneously rather than trading one for the other, a balance explored further in iFactory's support documentation.
01 / How Foam Carries the Same Chemistry With Far Less Water
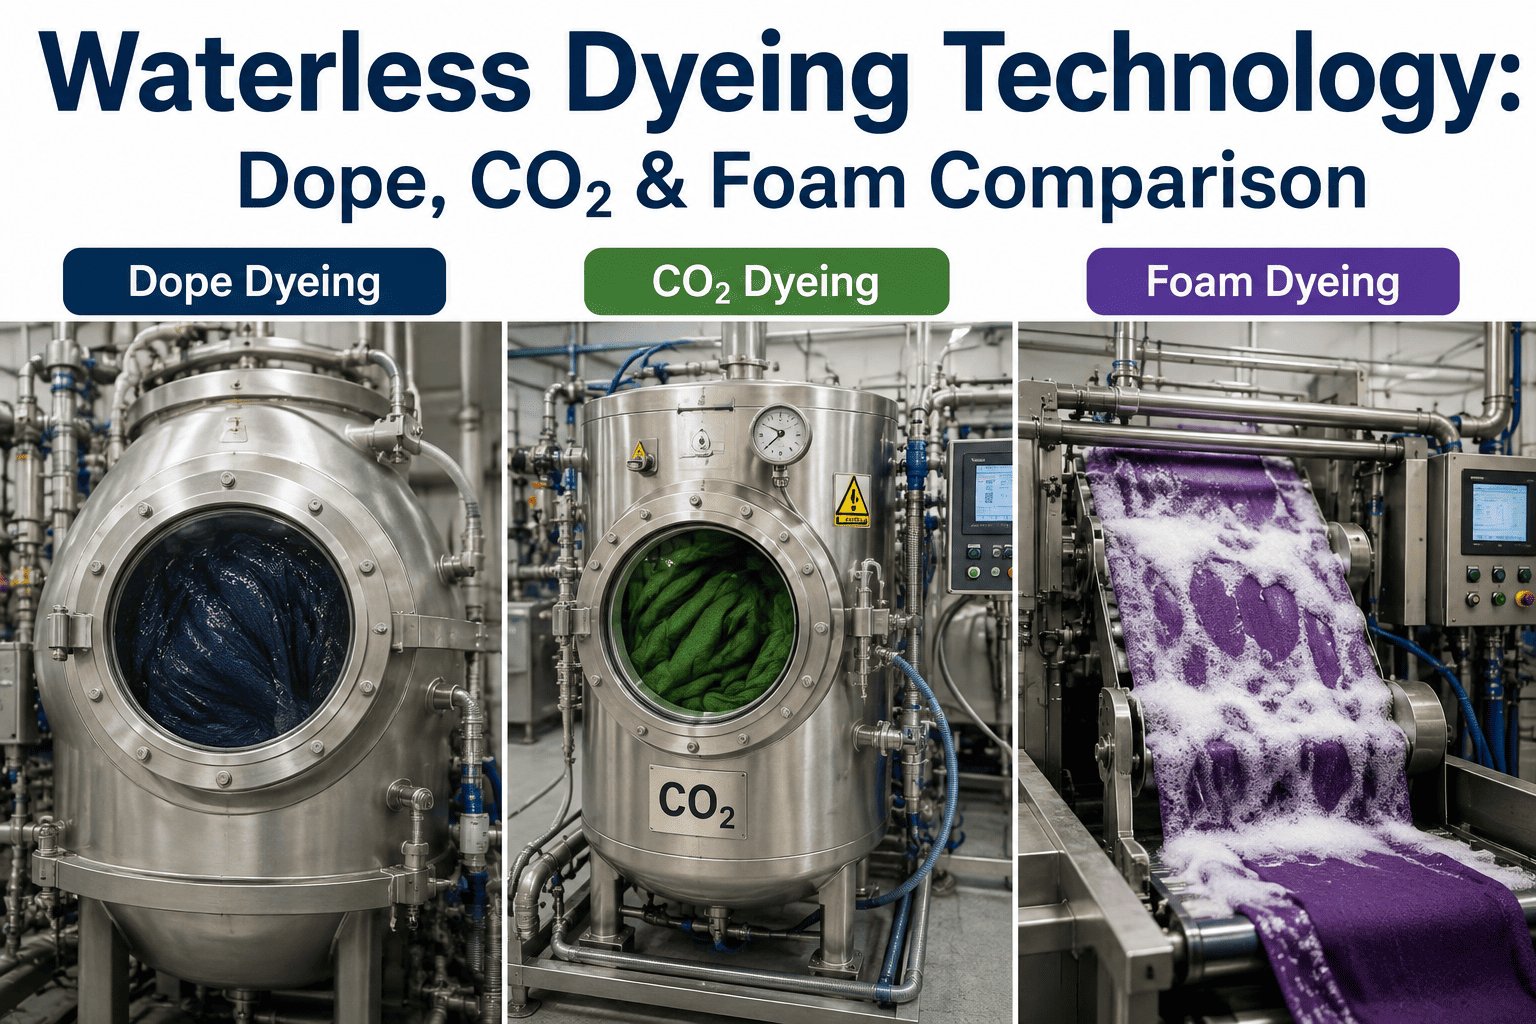
Foam finishing works by generating a stable, fine-cell foam from the finishing liquor using mechanical agitation and a foaming surfactant, then metering that foam onto the fabric through a precision application head rather than immersing the fabric in a full liquor bath. Because foam is mostly air by volume, the same mass of active chemical — softener, water repellent, flame retardant, or other finish — is delivered in a liquid volume that is typically thirty to fifty percent of what conventional pad application would require. The foam collapses on contact with the fabric surface, releasing the chemistry to distribute across the fiber, while the dramatically reduced water carrier means the dryer has far less moisture to remove before the fabric reaches target residual moisture content.
02 / Foam Generation and Application Head Design
Foam quality is the single largest determinant of finish quality and consistency, and it is controlled by three interacting variables — foam density, bubble size distribution, and foam stability over the time between generation and application. Foam that is too light collapses before it reaches the fabric, delivering uneven chemistry distribution; foam that is too dense behaves closer to a conventional liquid bath and loses much of the water-saving advantage. The application head — typically a horizontal slot or a series of nozzles spanning the fabric width — needs to distribute foam evenly across the full width to avoid streak defects, and head design has evolved significantly to address early-generation uneven distribution problems that limited foam adoption in its first commercial applications.
| Foam Parameter | What It Controls | Risk If Out of Range |
|---|---|---|
| Foam Density | Chemical concentration delivered per unit fabric area | Too light collapses early; too dense loses water-saving benefit |
| Bubble Size | Uniformity of chemistry distribution across fabric surface | Uneven bubble size produces patchy finish coverage |
| Foam Stability | Time window foam holds its structure before application | Premature collapse before reaching the fabric surface |
| Application Head Pressure | Consistency of foam delivery across fabric width | Streak defects from uneven cross-width distribution |
03 / Quality Equivalence — Does Foam Finishing Match Pad Application Results?
The question every finishing manager asks before converting is whether foam-applied finish performs as well as conventionally padded finish on standard fastness and functional performance tests. For most softener, water repellent, and antistatic finishes, properly optimized foam application produces equivalent or better distribution uniformity than pad application, because foam's low viscosity and even cell structure can penetrate fabric structure more consistently than a liquid bath under mechanical squeeze pressure. Flame retardant and heavier add-on finishes require more careful foam density optimization to hit the same total chemical add-on target within the reduced liquid volume, which is where foam finishing projects most commonly need pilot-scale trial runs before full production conversion.
04 / Where Foam Finishing Delivers the Fastest Payback
Not every finishing line sees equal return from a foam conversion, and identifying the highest-value application point within a facility's finish portfolio speeds up justifying the capital investment considerably.
05 / Monitoring a Foam Finishing Line With iFactory
Sustaining the water and energy savings foam finishing offers depends on catching foam density and distribution drift before it produces a finish quality issue, since operators cannot visually assess chemical add-on the way they could observe a conventional wet fabric coming off a pad.
06 / Environmental Compliance and Buyer Reporting Value
Beyond direct utility savings, foam finishing conversions increasingly factor into buyer sustainability scorecards and regulatory water-use reporting, particularly for facilities supplying apparel brands with published water-reduction targets across their supply chain. Documented water and effluent reduction from a foam finishing conversion can be reported as a measurable, verifiable improvement rather than a general sustainability claim, which carries more weight in buyer audits than qualitative statements about efficiency initiatives. Facilities in regions with tightening water allocation regulations or rising effluent treatment compliance costs also gain a secondary benefit — reduced exposure to future regulatory cost increases tied to water consumption volume, which is difficult to quantify precisely but is increasingly factored into capital planning by finishing operations in water-stressed regions. Tracking and reporting these metrics consistently, alongside chemical add-on and quality data, turns a foam finishing conversion into a documented compliance asset rather than only an internal cost-saving measure.
07 / Conclusion — A Dual Water and Energy Win With a Real Optimization Curve
Foam finishing is one of the rare finishing technology conversions that reduces both water consumption and drying energy simultaneously, though realizing the full fifty to seventy percent water reduction consistently requires getting foam density, bubble uniformity, and application head calibration right for each specific finish chemistry. Book a demo to see a savings model built around your finish portfolio and current pad application baseline.
Frequently Asked Questions — Foam Finishing Technology
In most cases, yes — foam finishing is typically installed as a foam generator and application head positioned ahead of the existing dryer, replacing or supplementing the conventional pad section rather than requiring a complete finishing range replacement. The existing dryer, fabric transport system, and downstream equipment generally remain in use, which keeps retrofit capital investment considerably lower than a full line replacement. The main equipment addition is the foam generation unit itself along with the precision application head, and integration work typically focuses on matching line speed and foam output rate to existing fabric throughput rather than redesigning the full finishing sequence.
Lightweight and medium-weight woven and knit fabrics generally see the strongest results from foam finishing, achieving the highest percentage wet pickup reduction and most consistent chemistry distribution. Heavier fabrics and dense constructions can still be foam-finished successfully but typically require higher foam density to achieve adequate penetration through the fabric structure, which narrows the water-saving margin somewhat compared to lighter goods. Highly textured or pile fabrics need application head adjustments to ensure foam reaches the base fabric structure rather than depositing primarily on surface fiber, and these fabric types often benefit from a pilot trial before full production conversion to confirm chemistry penetration meets target specifications.
Foam density is typically measured as the weight of a fixed foam volume compared to the weight of the same volume of the base liquor, expressed as a density ratio or blow ratio. Production foam generators control density through the ratio of air to liquor fed into the foam generation head, along with agitation speed, and modern systems allow this ratio to be set and monitored continuously rather than checked periodically by manual sampling. Because density directly determines both chemical concentration and water savings, continuous density monitoring integrated with the finishing line control system is the most reliable way to hold consistent quality across a full production shift rather than relying on start-of-shift verification alone, a capability covered further in iFactory's support documentation.
Payback periods vary considerably based on production volume, local water and energy costs, and the specific finish chemistry being applied, but facilities running high-volume standard finishes such as softeners typically see payback within twelve to twenty-four months when water, effluent, and drying energy savings are combined. Facilities in regions with elevated energy costs or water scarcity pressures often see faster payback given the compounding value of both utility reductions. A facility-specific model comparing current pad application utility consumption against projected foam finishing consumption at actual production volume gives a far more reliable payback estimate than generic industry benchmarks.
Most standard finish chemistries — softeners, water repellents, and antistatic agents — can be applied via foam with the same active chemical formulation used in pad application, adjusted primarily in concentration to account for the reduced liquid carrier volume rather than requiring a fundamentally different chemistry. Some finish types, particularly those relying on specific surfactant systems that interact with foaming agents, may need minor formulation adjustment to maintain foam stability without compromising finish performance. Chemical suppliers experienced in foam application typically provide formulation guidance for this transition, and pilot-scale trials before full conversion are the standard way to confirm a given chemistry performs as expected in foam form. Book a demo to discuss chemistry compatibility for your specific finish portfolio.