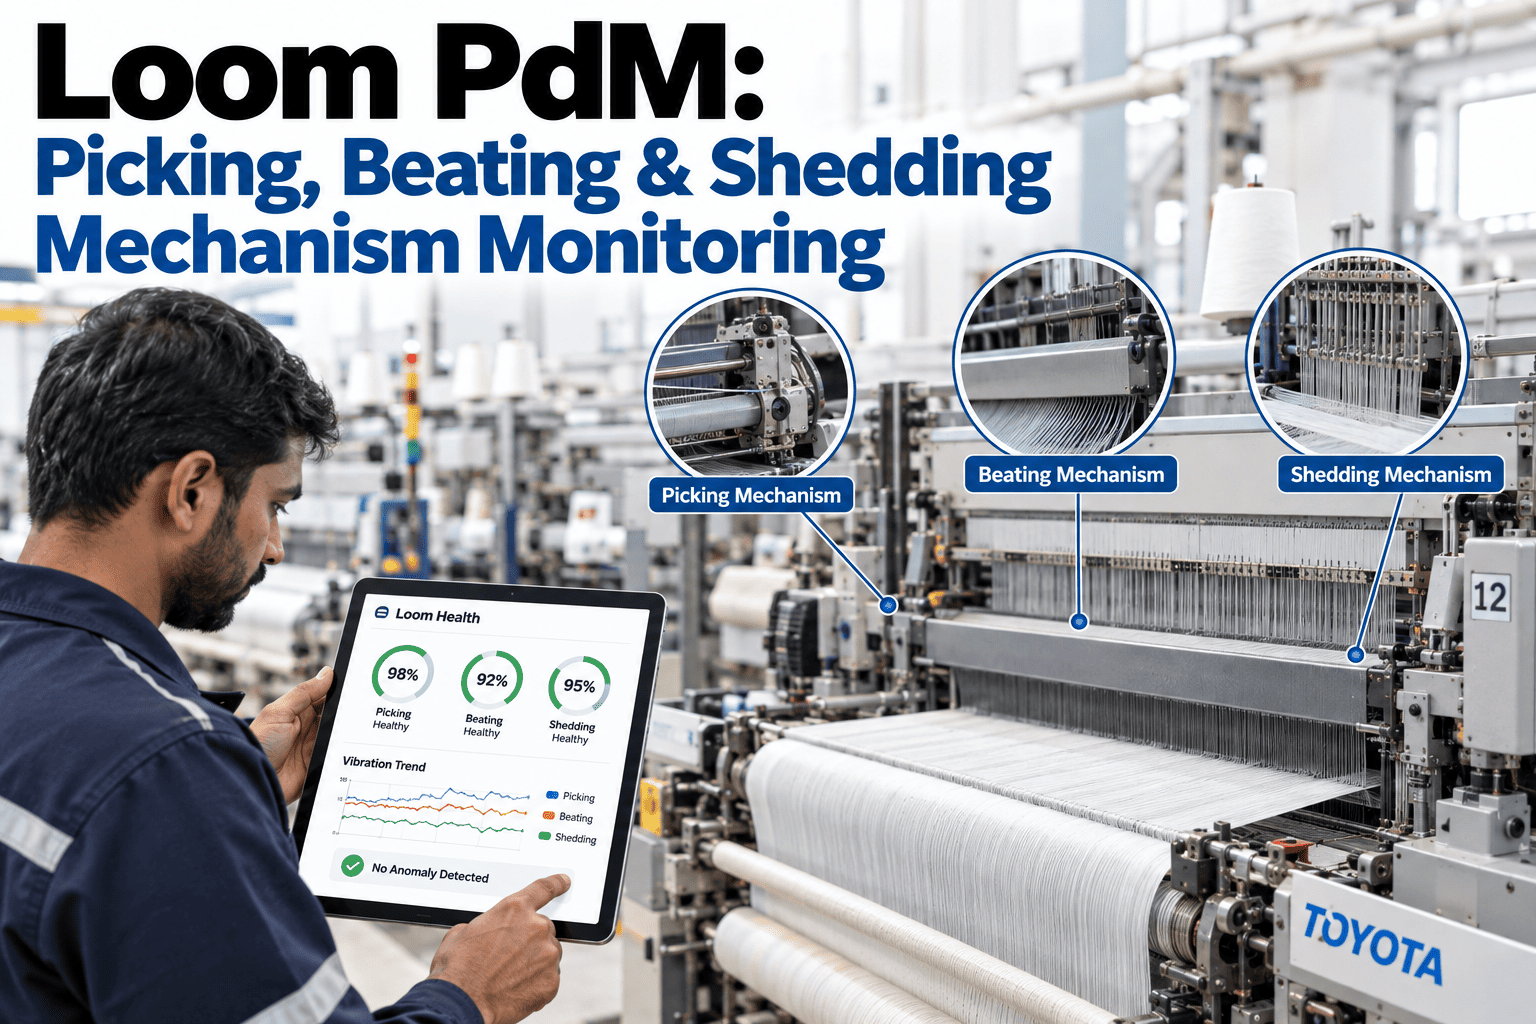
A loom running at full speed makes thousands of mechanical interactions every minute — the picking mechanism hurling the shuttle or projectile across the shed, the beating mechanism driving the reed forward to pack each weft thread into the fell of the cloth, and the shedding mechanism raising and lowering warp yarns in a precise, repeating rhythm. When any one of these three systems starts to drift out of tolerance, the fabric shows it first as a quality defect and only later as a breakdown. Weaving mills that want to catch that drift before it becomes a stoppage can Book a Demo to see how condition monitoring is applied to loom mechanisms in practice.
Why Loom Failures Are Rarely Sudden
A loom stoppage on the shop floor looks like a single event — the machine simply stops, an alarm sounds, and a technician is called. In reality, the mechanical wear that caused the stoppage was almost always building for days or weeks beforehand, showing up first as a subtle change in vibration signature, a small shift in mechanism timing, or a slight increase in the torque needed to drive the beat-up. Traditional maintenance schedules miss this window because they are based on calendar intervals rather than actual condition, meaning a mechanism can be inspected and cleared one week and fail catastrophically the next simply because wear does not follow a fixed calendar. Predictive maintenance closes this gap by watching the mechanism itself rather than the calendar, catching the drift in the weeks before it becomes a stoppage.
The Picking Mechanism: Timing and Impact Under the Microscope
The picking mechanism is responsible for launching the shuttle, projectile, or rapier carrier across the shed at high speed, and it is one of the most mechanically stressed systems on the loom because it converts rotational motion into a sharp, repeated impulse thousands of times per hour. Picking cam wear, worn picker shoes, loose picking bowls, and degraded leather or synthetic buffers all change the acceleration profile of the pick in ways that are difficult to see visually but show up clearly in vibration and timing data. A picking system that has drifted out of tolerance produces uneven pick velocity, which translates directly into weft insertion defects, broken picks, and — if left unaddressed — a catastrophic mechanical failure that can damage the shuttle guide, the reed, or the picking stick itself.
Vibration Signature Tracking
Accelerometers mounted near the picking cam and picker box capture the acceleration profile of every pick cycle, flagging deviations in amplitude or frequency that indicate cam wear, bearing degradation, or loosening fasteners well before a technician would notice by ear or by touch.
Pick Timing Drift
Sensors correlated against the main shaft position track exactly when each pick launches relative to shed opening, catching the gradual timing drift that occurs as picking cam surfaces wear and clearances open up over months of continuous running.
Impact Force Trending
Repeated impact loading on picker shoes and buffers is tracked over time, with a rising force trend serving as an early indicator that cushioning components have hardened or worn thin and need replacement before they transmit excess shock to the picking stick.
The Beating Mechanism: Where Fabric Quality and Machine Health Meet
The beating mechanism drives the reed forward on every pick to pack the newly inserted weft thread against the fell of the cloth, and the consistency of this motion determines fabric pick density, cover, and overall uniformity. A worn sley sword bushing, a degraded crank bearing, or a loosening reed cap changes the beat-up force and timing in ways that first appear as subtle fabric density variation before they progress to audible mechanical noise and eventually to component failure. Because beating happens on every single pick — tens of thousands of times per shift on a modern high-speed loom — even a small amount of excess play in the mechanism compounds into measurable fabric quality drift long before it becomes a maintenance emergency.
| Beating Mechanism Symptom | Likely Root Cause | Typical Detection Method |
|---|---|---|
| Rising vibration amplitude at beat-up frequency | Crank or sley sword bearing wear | Accelerometer trend analysis |
| Inconsistent pick density across fabric width | Reed cap loosening or sley alignment drift | Fabric inspection correlated with vibration data |
| Increased motor current draw at beat-up phase | Excess friction from degraded lubrication or bushing wear | Motor current signature analysis |
| Audible knocking at low speed | Loose fasteners or advanced bearing failure | Acoustic monitoring and manual inspection |
The Shedding Mechanism: Precision Timing Under Constant Load
Shedding — the raising and lowering of warp yarns to form the path for the weft — is arguably the most timing-sensitive mechanical system on the loom, whether it is driven by tappet, dobby, or jacquard mechanisms. Any drift in shed timing relative to pick insertion increases the risk of warp yarn abrasion, broken ends, and shuttle or projectile interference, and because the shedding mechanism operates continuously through the entire run, wear tends to accumulate gradually across cams, levers, and heald frame linkages. Dobby and jacquard systems add electromechanical components — solenoids, hooks, and read heads — that introduce their own failure modes on top of the pure mechanical wear seen in simpler tappet systems, making shedding monitoring a blend of mechanical vibration analysis and electrical signal tracking.
Shed Timing Correlation
Encoder data on the main shaft is correlated with heald frame position sensors to verify that shed opening and closing stay within the tolerance window required for clean shuttle or projectile passage across the full width of the loom.
Cam and Lever Wear Trending
Vibration signatures specific to tappet cam contact and lever linkages are tracked over weeks of running, distinguishing normal break-in wear from the accelerating wear pattern that precedes a mechanical failure.
Dobby and Jacquard Health
Solenoid response time and hook selection consistency are monitored electronically on dobby and jacquard systems, catching electromechanical degradation that would otherwise only surface as an intermittent, hard-to-diagnose pattern defect.
Building a Sensor Deployment Plan Across the Three Mechanisms
Deploying condition monitoring across an entire weaving shed does not require instrumenting every loom identically on day one. The most effective rollouts start with a criticality assessment — identifying which looms run the highest-margin fabric, which have the worst historical breakdown record, and which mechanisms have caused the most downtime — and instrument that subset first to prove the value of the approach before expanding fleet-wide. A phased plan also gives the maintenance team time to build familiarity with reading vibration trends and timing data, which is a different skill set than the reactive troubleshooting most loom technicians have historically relied on.
Criticality Ranking
Rank looms by production value, historical breakdown frequency, and fabric criticality to identify the highest-priority subset for initial sensor deployment.
Baseline Data Collection
Capture several weeks of vibration, timing, and current data on newly instrumented looms while they are running normally to establish the healthy baseline that later readings are compared against.
Threshold and Alert Configuration
Set deviation thresholds for each mechanism based on the baseline data, tuning alert sensitivity to minimize false positives while still catching genuine early-stage wear signals.
Maintenance Response Integration
Connect condition alerts directly into the maintenance work order process so a flagged mechanism generates a scheduled inspection task rather than sitting unread in a monitoring dashboard.
Fleet-Wide Expansion
Extend instrumentation to the remaining loom fleet once the initial deployment has demonstrated reliable early detection and the maintenance team has built confidence interpreting the data.
From Alert to Action: Making Predictive Data Usable on the Floor
Condition monitoring data only creates value when it changes what a maintenance team actually does, and mills sometimes struggle in the early months of a rollout because vibration dashboards accumulate readings that nobody translates into a scheduled task. The most successful deployments treat every alert as the start of a defined workflow — a flagged mechanism triggers a specific inspection checklist matched to the failure mode most associated with that alert pattern, and the technician's findings are logged back against the alert to build a feedback loop that improves threshold accuracy over time. This closed loop is what separates predictive maintenance that actually reduces downtime from a monitoring system that simply generates more data for someone to ignore.
Calculating the Return on a Loom Condition Monitoring Investment
Mill leadership evaluating a predictive maintenance rollout on their loom fleet typically wants a clear answer to a simple question: does the cost of sensors, integration, and the monitoring platform pay for itself faster than the downtime and secondary damage it prevents? The honest answer depends heavily on the mill's current breakdown profile, but the math tends to favor early adoption for any shed running a meaningful number of high-speed looms. A single unplanned picking mechanism failure that damages a shuttle guide or reed can cost more in repair parts and lost production hours than a full year of sensor subscription fees for that loom, and that comparison alone is usually enough to justify a pilot deployment on the highest-value subset of the fleet.
The less obvious but equally important return comes from labor efficiency rather than avoided catastrophic failure. Maintenance technicians in a reactive environment spend a disproportionate share of their shift walking the floor listening for unusual noises, checking looms that are running fine, and responding to false alarms raised by operators who are not trained to distinguish normal mechanical sound from early wear. Condition monitoring redirects that labor toward the specific looms and mechanisms that actually need attention, and mills consistently report that their existing maintenance headcount can cover a larger loom fleet once alerts — rather than blind walk-throughs — drive the daily inspection routine. This labor reallocation effect often matters more to the long-term maintenance budget than the avoided cost of any single breakdown.
Connecting Mechanism Data to the Broader Weaving Shed
Picking, beating, and shedding condition data delivers the most value when it does not live in isolation from the rest of the mill's production and quality systems. Correlating a rising vibration trend on a specific loom's beating mechanism against that loom's fabric inspection results, for example, often reveals a connection between mechanical wear and a specific quality defect pattern days or weeks before an inspector would otherwise flag it as a recurring issue. Similarly, linking mechanism alerts to the loom's production schedule lets planners route a flagged machine into a maintenance window during a planned style change rather than pulling it out of a production run mid-shift, minimizing the disruption caused by the intervention itself.
This kind of integration is also what makes predictive maintenance data useful beyond the maintenance department. Production planners gain visibility into which looms are approaching a maintenance window and can plan style changes accordingly. Quality teams gain a mechanical explanation for defect patterns that would otherwise be investigated purely through fabric inspection. And mill management gains a fleet-wide view of mechanical health that supports longer-term decisions about loom replacement, rebuild scheduling, and capital planning — decisions that are difficult to make well when the only available information is a maintenance log full of after-the-fact repair records.
Frequently Asked Questions: Loom Predictive Maintenance
Which loom mechanism should a mill instrument first if budget only allows one?
Most mills get the fastest return by starting with the beating mechanism, because its wear directly and visibly affects fabric quality in addition to causing mechanical downtime, making the business case easier to demonstrate to plant leadership. Picking mechanism monitoring is a close second priority for mills running shuttle or rapier looms with a history of picking-related breakdowns, since a picking failure often causes more collateral damage to surrounding components than a beating or shedding issue. Mills can Book a Demo to review their own breakdown history and get a recommendation matched to their specific loom fleet.
Do older looms without electronic controls support this kind of monitoring?
Yes — vibration and acoustic sensors can be retrofitted onto purely mechanical looms without requiring any integration with the loom's own control system, since accelerometers and current clamps attach externally and communicate independently through their own monitoring network. Timing correlation is somewhat more limited on older tappet-driven looms without an accessible shaft encoder position, but even standalone vibration trending on picking and beating mechanisms delivers meaningful early warning value on legacy equipment.
How much false-alarm noise should a mill expect in the first weeks of deployment?
False alarm rates are typically higher in the first two to three weeks while baseline thresholds are still being tuned against actual running conditions, and mills should expect to adjust sensitivity settings during this period rather than treating the initial configuration as final. Involving experienced loom technicians in reviewing early alerts helps distinguish genuine early-stage wear from normal run-to-run variation, and this collaborative tuning process is what brings the false-alarm rate down to a manageable level within the first month of operation.
Can this data help with spare parts planning as well as breakdown prevention?
Condition monitoring data builds a much more accurate picture of actual component wear rates than calendar-based replacement schedules, which lets maintenance planners shift from stocking parts based on rough estimates to stocking based on observed degradation trends across the specific mechanisms most prone to failure. Over time this reduces both emergency parts procurement and excess inventory tied up in components that were being replaced too early under a conservative fixed schedule. Contact iFactory Support for guidance on connecting condition data to spare parts forecasting.
What skills does the maintenance team need to interpret vibration and timing data effectively?
Technicians do not need formal vibration analysis certification to use the system day to day, since modern condition monitoring platforms translate raw sensor data into plain-language alerts tied to specific mechanisms and likely failure modes rather than requiring manual interpretation of frequency spectra. That said, having at least one team member develop deeper vibration analysis skills over time strengthens the mill's ability to diagnose unusual or ambiguous alert patterns and to refine thresholds as the loom fleet ages and wear characteristics shift.
Common Pitfalls That Slow Down a Loom PdM Rollout
Even well-resourced weaving mills run into predictable friction points when they first deploy mechanism-level condition monitoring, and knowing these pitfalls in advance saves months of trial and error. The most common mistake is instrumenting too many looms at once before the maintenance team has developed confidence reading the data, which produces a flood of alerts that gets triaged inconsistently and quickly erodes trust in the system. A second common issue is treating sensor installation as a one-time project rather than an ongoing calibration discipline — accelerometers can loosen, cabling can be damaged during routine cleaning, and a sensor reporting flat or erratic data for weeks without anyone noticing defeats the entire purpose of the deployment.
Alert Fatigue From Over-Deployment
Instrumenting the full loom fleet before thresholds are tuned floods technicians with alerts they cannot triage effectively, teaching the team to ignore notifications rather than act on them.
Unmonitored Sensor Health
Sensors that go offline or report degraded signal quality need their own monitoring layer, since a silent sensor creates a false sense of security that is often worse than having no sensor at all.
Disconnected Maintenance Response
Alerts that do not automatically generate a work order or inspection task tend to sit unread in a dashboard, especially during busy production periods when technicians are focused on active jobs.