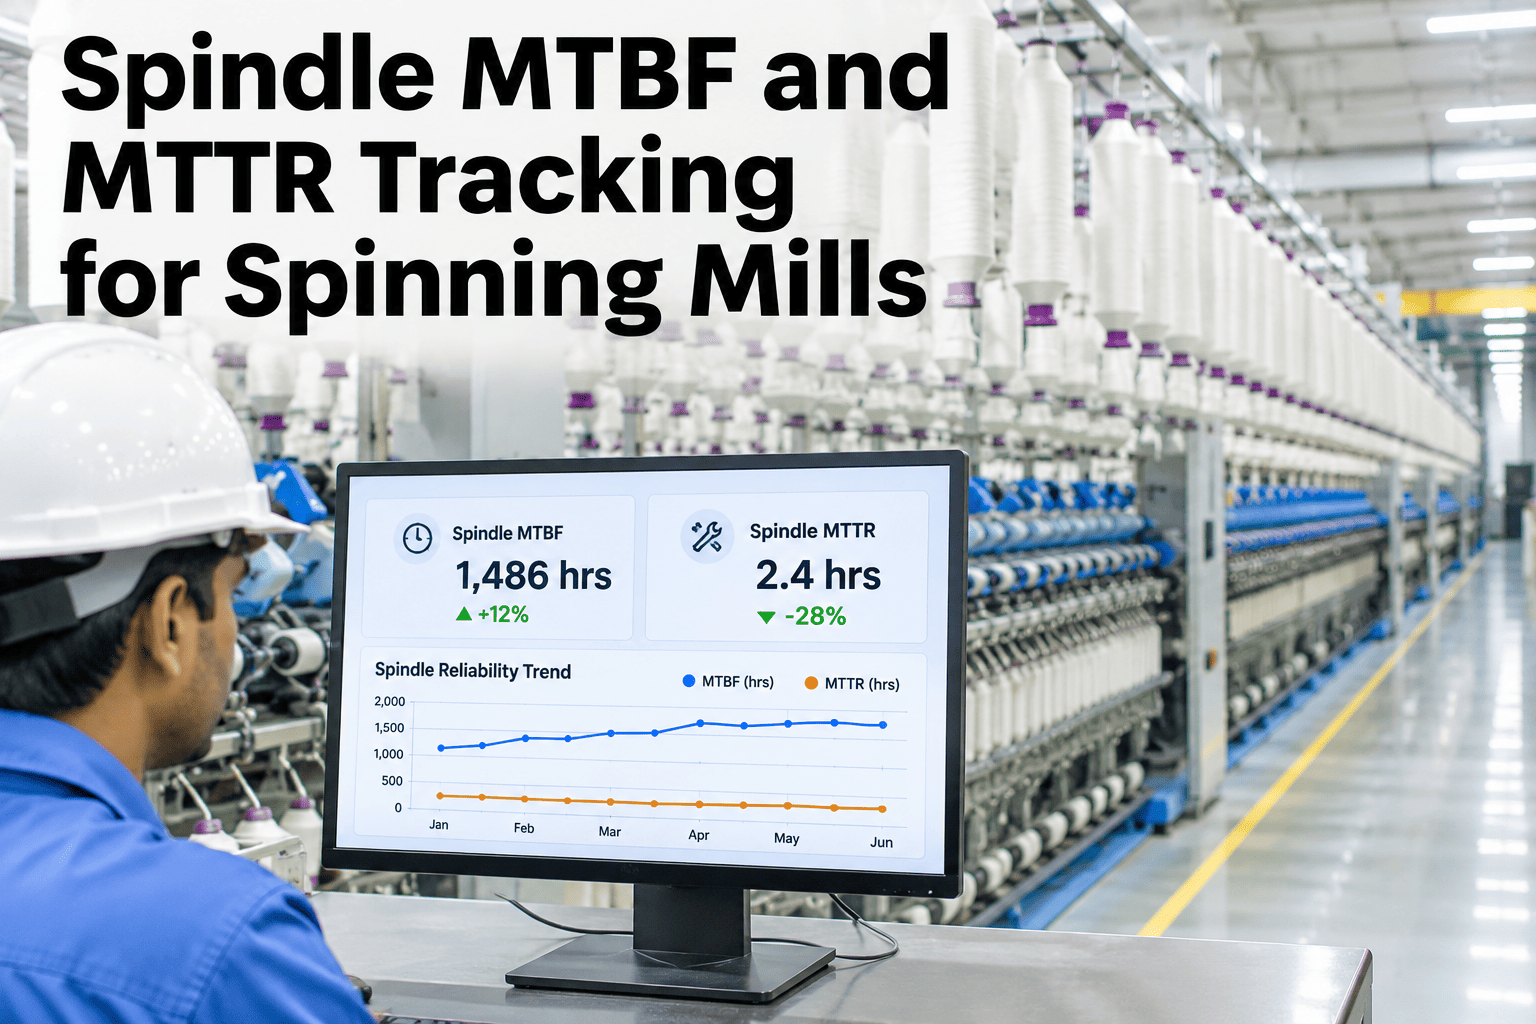
Most spinning mills can estimate how often spindles fail and roughly how long repairs run — but almost none measure either number precisely, per frame, over time. That gap turns maintenance spend into guesswork and lets the least reliable frames quietly absorb the same resources as the best performers on the floor. This checklist turns a raw failure log into frame-level MTBF, MTTR and repeat-failure KPIs your team can actually act on, and you can book a working session to build it against your own fleet data.
The Spindle MTBF & MTTR Tracking Checklist — Eight Practices That Turn a Failure Log Into Reliability KPIs
Work through eight data-collection and analysis practices per ring frame. Each one adds a layer of reliability information — together they produce the KPI set that drives maintenance investment decisions, not just failure records.
MTBF and MTTR Defined for Spinning Spindles
Mean Time Between Failures and Mean Time To Repair are the two foundational reliability KPIs for any repairable asset. For spinning spindles they are worked out at the frame level — averaged across the spindle positions on each ring frame — and then tracked over time so a trend is visible rather than a single snapshot. A checklist is only useful once both numbers mean the same thing to everyone reading them, so the two definitions below are the anchor for every practice that follows.
The Eight-Practice Spindle MTBF & MTTR Checklist
Reliable tracking for a spinning mill rests on consistent data collection across eight practices, grouped into three stages — capture, calculate, and review. Tick each item as it is live in your maintenance workflow; the readiness meter in the hero moves with you. Teams that want the data structure configured against their existing CMMS can walk through it with our team before committing a frame-numbering convention.
Reading the Signals — What Each KPI Movement Means
Ticking every box produces four signals worth watching. Each one points at a different kind of problem, and knowing which is which stops the team from treating a parts bottleneck as a reliability fault, or a one-off failure as a trend. The cards below are the quick read a shift lead can use before the monthly review turns them into actions.
Turn Your Failure Log Into a Reliability KPI Dashboard
iFactory AI calculates MTBF, MTTR, repeat-failure rate and reliability status per ring frame directly from your maintenance records — so your team sees which frames are the worst actors and can prove it, rather than argue it, and you can ask about failure-log integration for your current CMMS.
MTBF Benchmarks for Ring Spinning Frames
Published MTBF benchmarks for ring spinning spindles are limited, because performance varies widely with spindle type, speed, count range, lubrication programme and raw material. The ranges below are illustrative targets for mills running modern ring frames with active condition monitoring — a starting point for your own floor thresholds, not a specification. The matrix scrolls sideways on a phone; set your real floors once you have 90 days of your own events behind the numbers. Treat the first column as a bucket, not a label — a frame that runs faster, spins a finer count, or carries an older bolster set will sit at the lower end of its band, and that is normal rather than a fault. The point of a benchmark here is to decide where your own line between healthy and bad-actor should sit, then let your measured data move it.
Frequently Asked Questions
What is the minimum data needed to start MTBF and MTTR tracking?
The smallest starting set is a failure event log with a timestamp and a frame identifier, plus a repair-complete timestamp for each event. That alone produces frame-level MTBF and MTTR without spindle-position resolution — enough to rank frames and spot the worst actors. Adding spindle position, failure type and technician deepens the analysis later without redoing the earlier work. You can review your current records in a session to gauge readiness, or book a build walkthrough if the log already exists.
How is MTBF calculated when a frame had only one failure in the period?
With a single failure event, MTBF equals the time from the start of the measurement window to that failure — a one-sided estimate that reads as more certain than it is. iFactory AI flags single-event MTBF values as low-confidence and widens the reporting window to 90 days to pull in more events where the history allows. To see how low-event-count frames are handled before you trust the number, book a demo of the reliability view or ask our team directly.
Can MTBF and MTTR data feed a maintenance budget planning process?
Yes — and this is where the KPIs earn their keep. MTBF by failure type, combined with repair cost per event, yields an expected annual maintenance cost per frame, which can be weighed against the cost of a planned spindle refurbishment or bearing upgrade that would lift MTBF. That comparison is the standard justification for reliability investment. To see the cost projection built from your own fleet's MTBF, book a planning session.
How does the system find bad-actor spindle positions within a frame?
When spindle-position data rides along with each failure event, iFactory AI computes position-level failure frequency and flags positions whose repeat failures cross the threshold. A position that has failed three times in 90 days while its neighbours on the same frame stayed stable is a bad-actor position — likely a ring, guide or bracket issue rather than a random bearing failure, and worth a targeted fix. You can see position-level flagging in a demo to judge the resolution it gives you.
How often should MTBF and MTTR be recalculated per frame?
The rolling windows recalculate continuously as new events arrive, so the dashboard is always current — but the figure teams act on is the monthly one, read in the maintenance performance meeting where the three horizons sit side by side. Daily dispatch leans on the live number to spot a frame sliding mid-month; strategic decisions wait for the monthly trend so a single bad event does not swing a capital case. To see the monthly reliability report structure before you adopt a cadence, book a walkthrough or ask how the review is run.
What happens to MTBF when a frame goes through a planned overhaul?
A planned overhaul resets the MTBF clock for that frame — the measurement window restarts from the overhaul-complete date. iFactory AI marks overhaul events in the failure history so pre- and post-overhaul MTBF can be compared, which is itself a measure of how well the overhaul worked. To see how overhaul events are recorded and their impact proven, book a walkthrough or ask about overhaul tracking.
Know Which Ring Frame Has the Worst Reliability — and Prove It
iFactory AI calculates MTBF, MTTR and repeat-failure rate per ring frame from your maintenance records — giving your reliability team the numbers to name bad actors, justify investment and track improvement. Book a session built around your own fleet data.