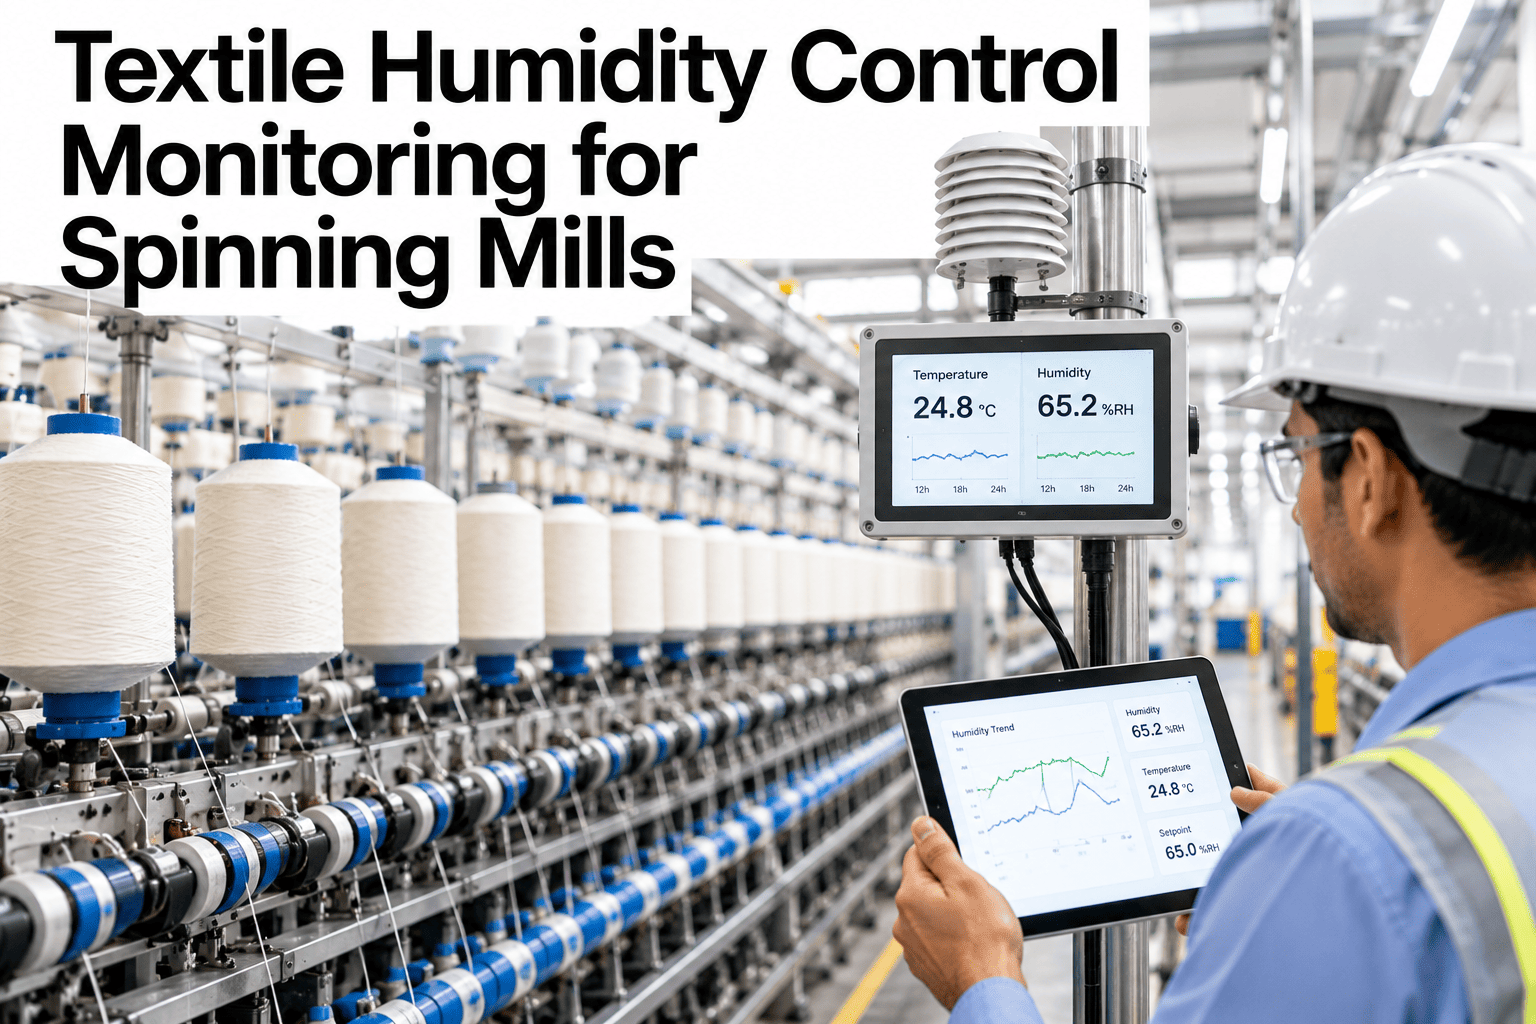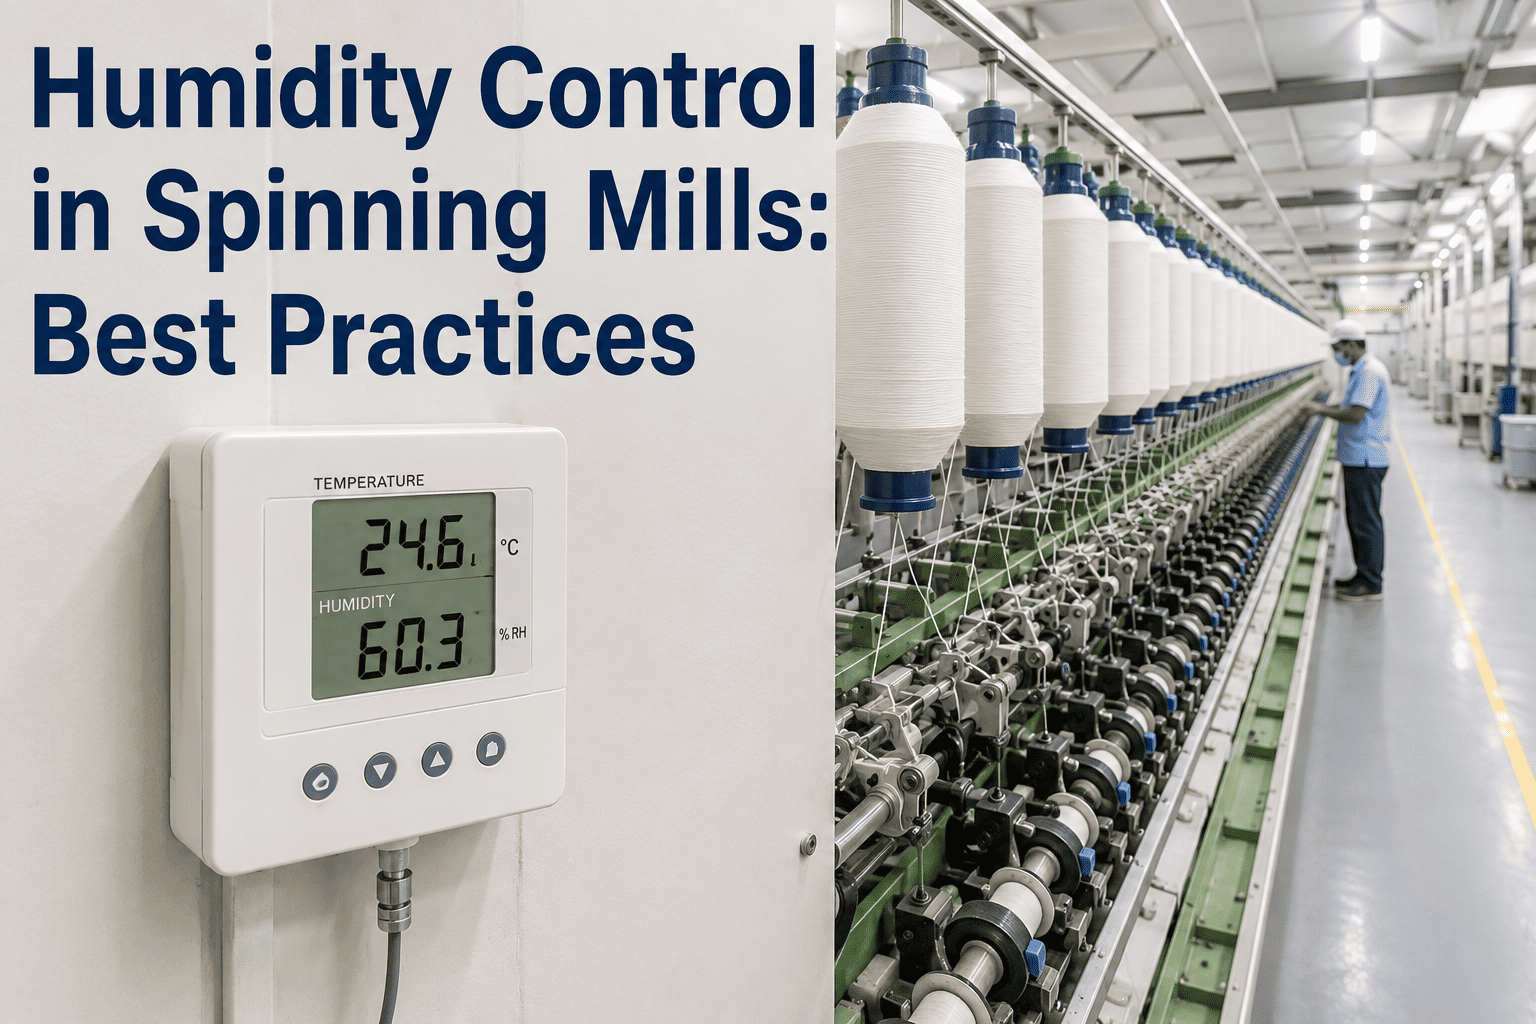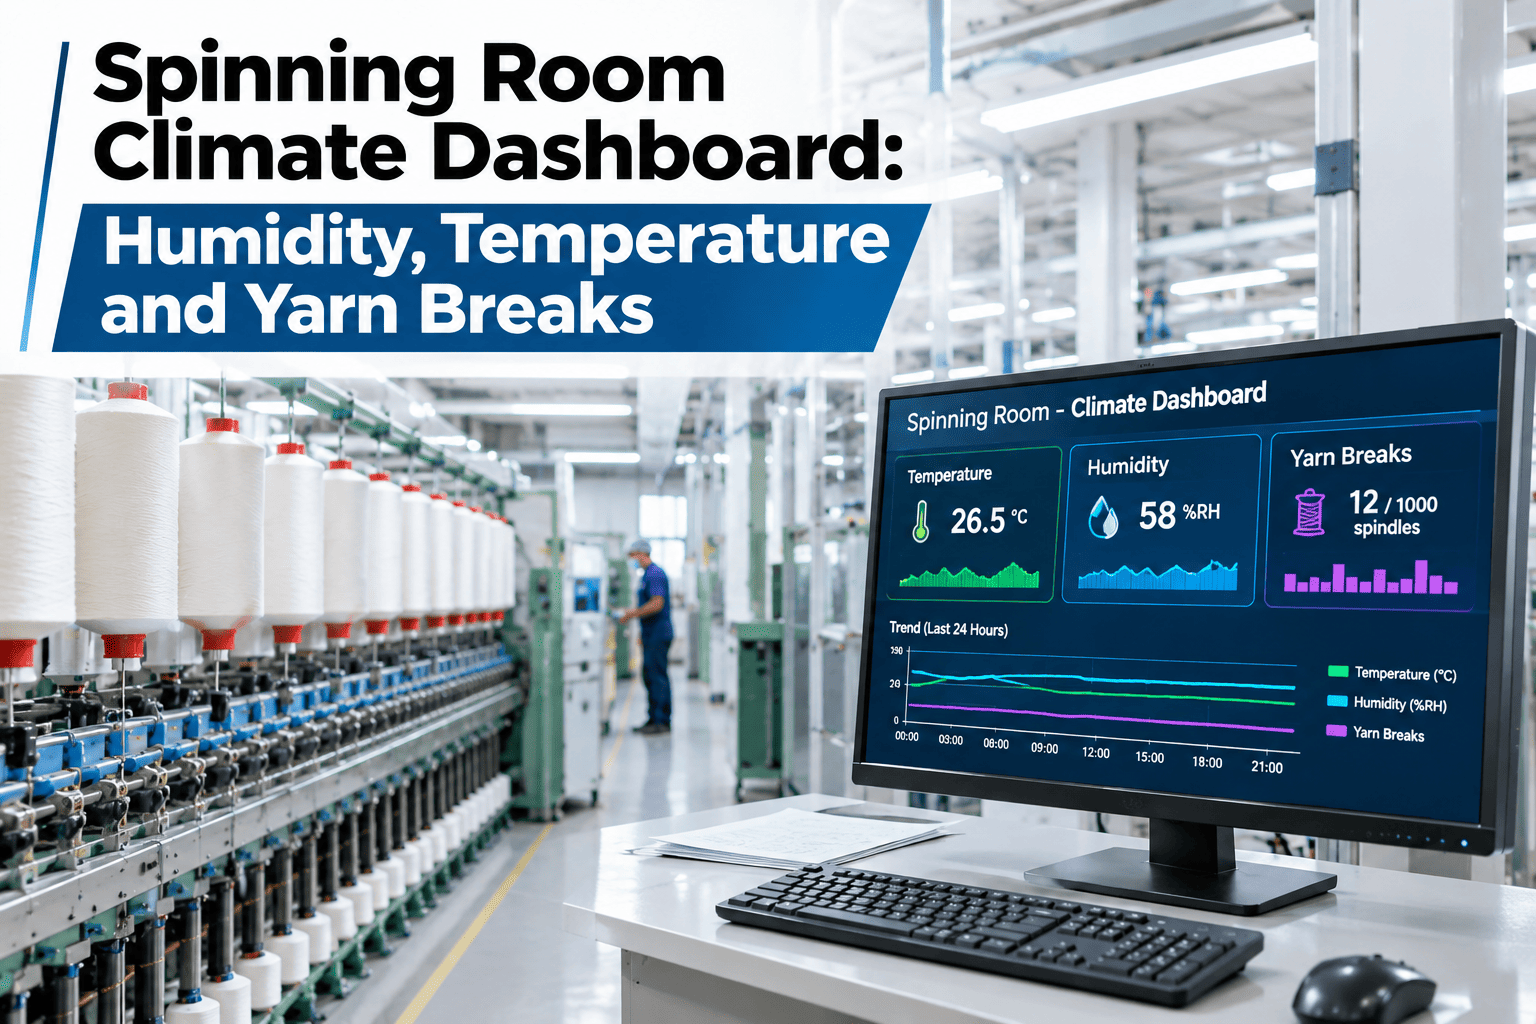
Yarn is hygroscopic, which means its behavior on the spinning floor shifts with humidity and temperature whether anyone is watching those numbers or not. A mill that tracks production output on one screen and climate readings on a completely separate system, if it tracks them at all, misses the connection between a humid afternoon and a spike in yarn breaks that looks otherwise unexplained. Centralizing humidity, temperature, breaks and alarms into one dashboard makes that connection visible instead of coincidental. Spinning mills that want their own climate data connected to production outcomes can review a climate dashboard against their own break history with iFactory AI.
Yarn Reacts to Humidity and Temperature Whether You're Watching or Not
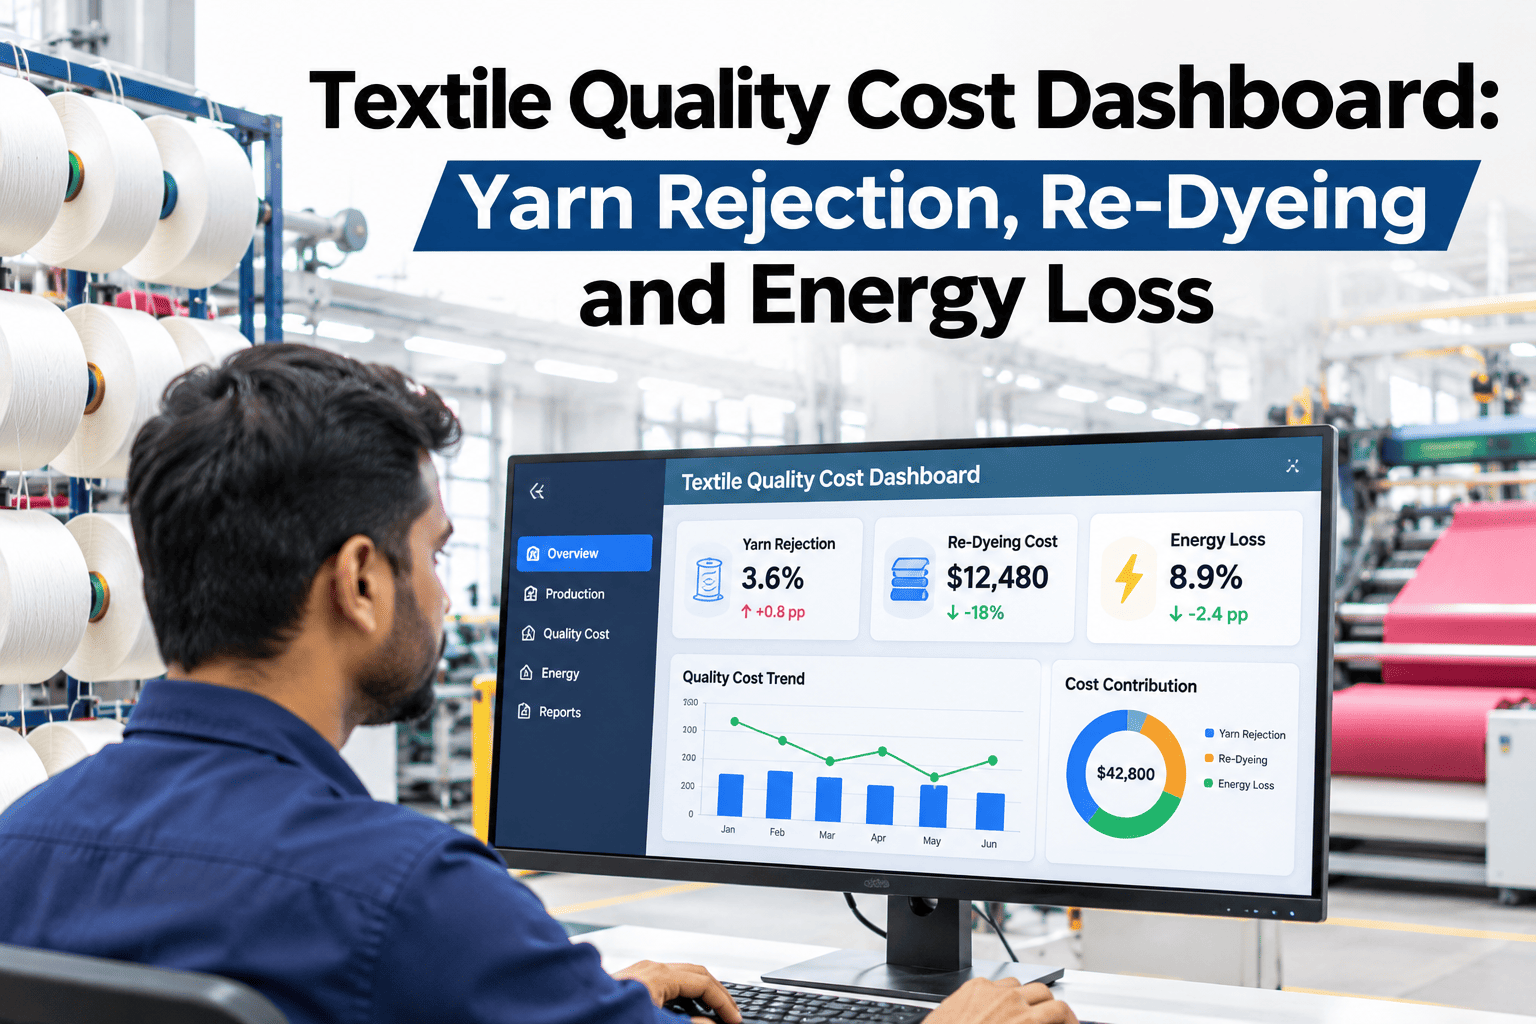
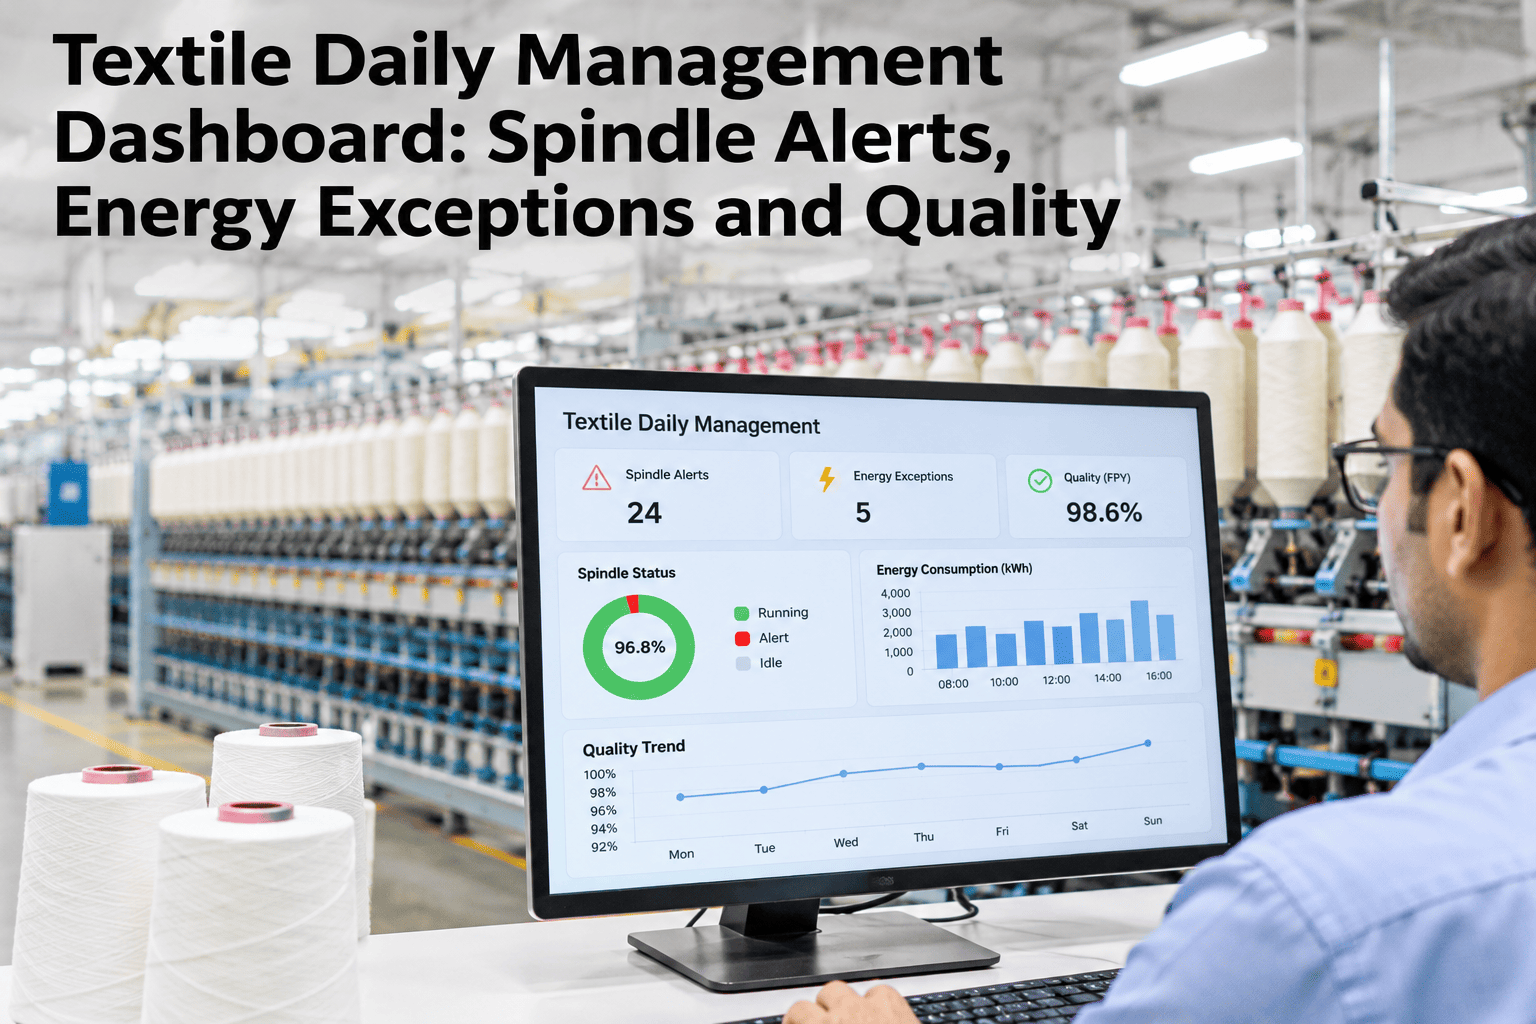
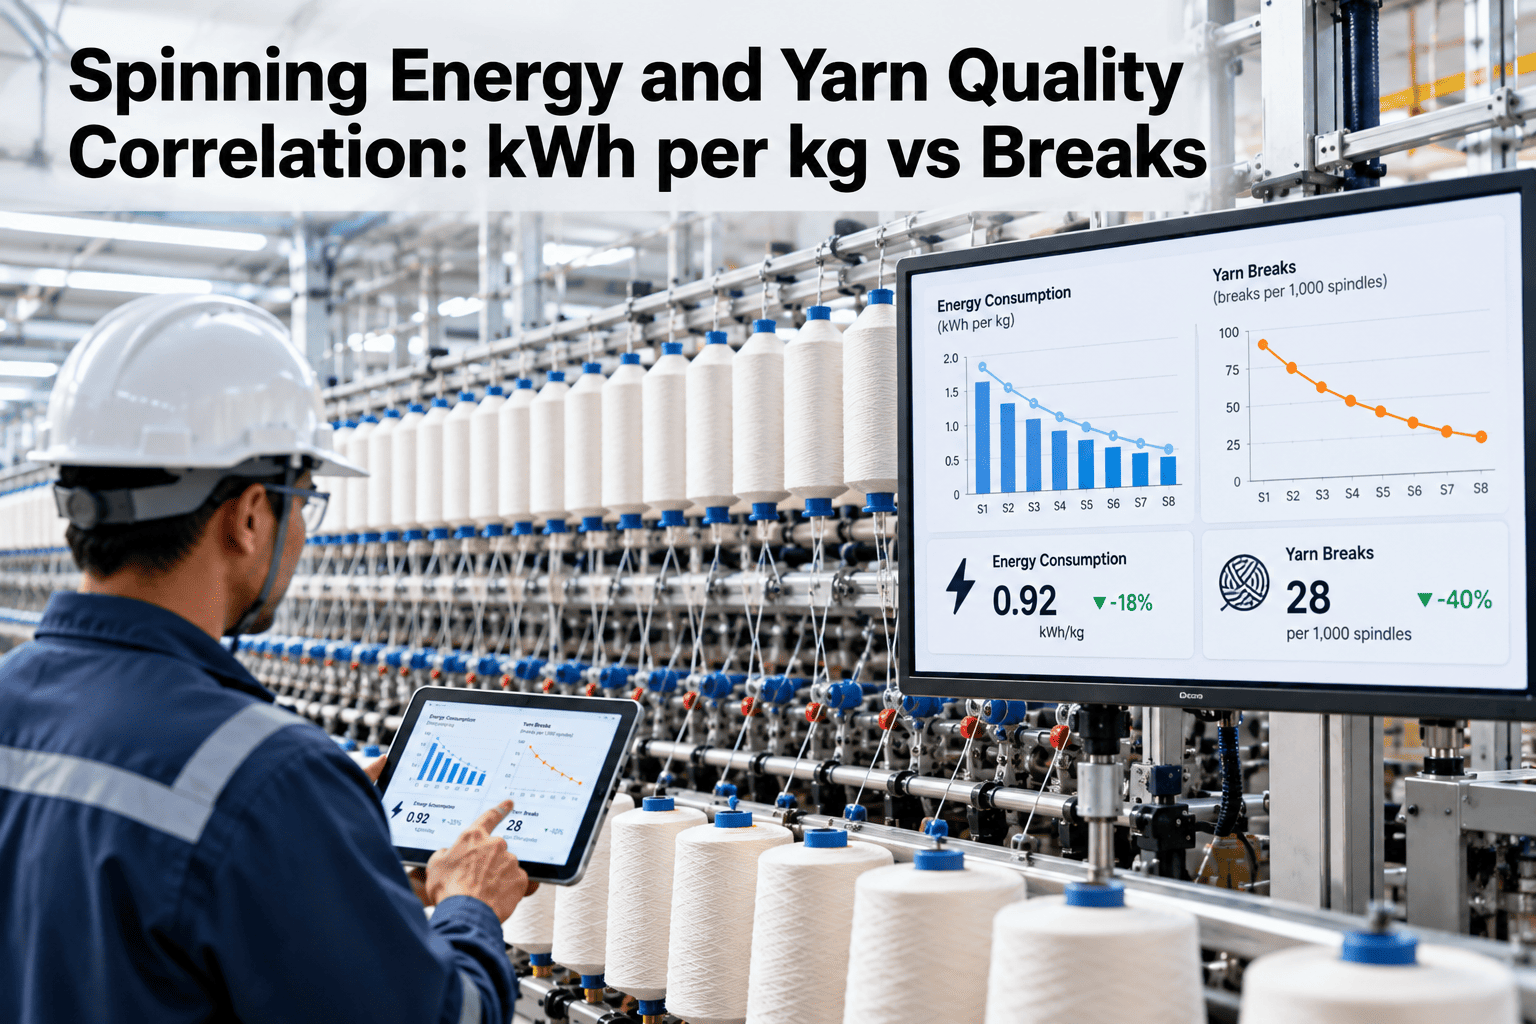
iFactory AI centralizes humidity, temperature, yarn breaks, output and alarms into one dashboard so environmental conditions affecting performance become visible, not coincidental.
Why Climate and Production Data Usually Live Apart
Humidity and temperature are often monitored by a building HVAC system, while production output and breaks are tracked by a completely separate production system. Nobody owns the connection between the two, so a pattern that would be obvious side by side stays invisible when the data sits in different places.
What a Centralized Dashboard Actually Connects
| Data source | What it adds to the picture |
|---|---|
| Humidity and temperature | The environmental condition at the moment of each reading |
| Yarn breaks | Production disruption that may correlate with climate shifts |
| Production output | Whether output dropped alongside any climate-related disruption |
| HVAC alarms | Whether a system fault explains an unusual climate reading |
See Whether Your Own Breaks Correlate With Climate Conditions
Share recent humidity, temperature and break data and a short session will show whether a pattern exists in your own mill.
A Composite Scenario: The Afternoon Spike Nobody Had Connected
A mill noticed break rates consistently climbed during afternoon hours on certain days but had never connected this to the HVAC system's own data, since the two were tracked on completely separate dashboards. Centralizing both showed the afternoon spikes correlated closely with a predictable humidity rise tied to a specific HVAC zone's cooling cycle, which had been drifting slightly out of its target range on warmer days. Adjusting that zone's control settings reduced the afternoon break spike noticeably — a connection iFactory AI's team can help uncover in your own mill's separate systems.
Why Alarms Belong on the Same Dashboard as Production Data
An HVAC alarm logged only in the building management system is easy to miss from a production standpoint, even though it may explain exactly why breaks spiked that afternoon. Showing alarms alongside production and break data means a production manager reviewing an unusual pattern can immediately check whether an HVAC fault was the cause, rather than treating it as an unexplained process issue.
Frequently Asked Questions
Connect the Climate Conditions That Are Already Affecting Your Yarn
iFactory AI centralizes humidity, temperature, breaks, output and alarms into one dashboard. Book a walkthrough with your own mill's data.