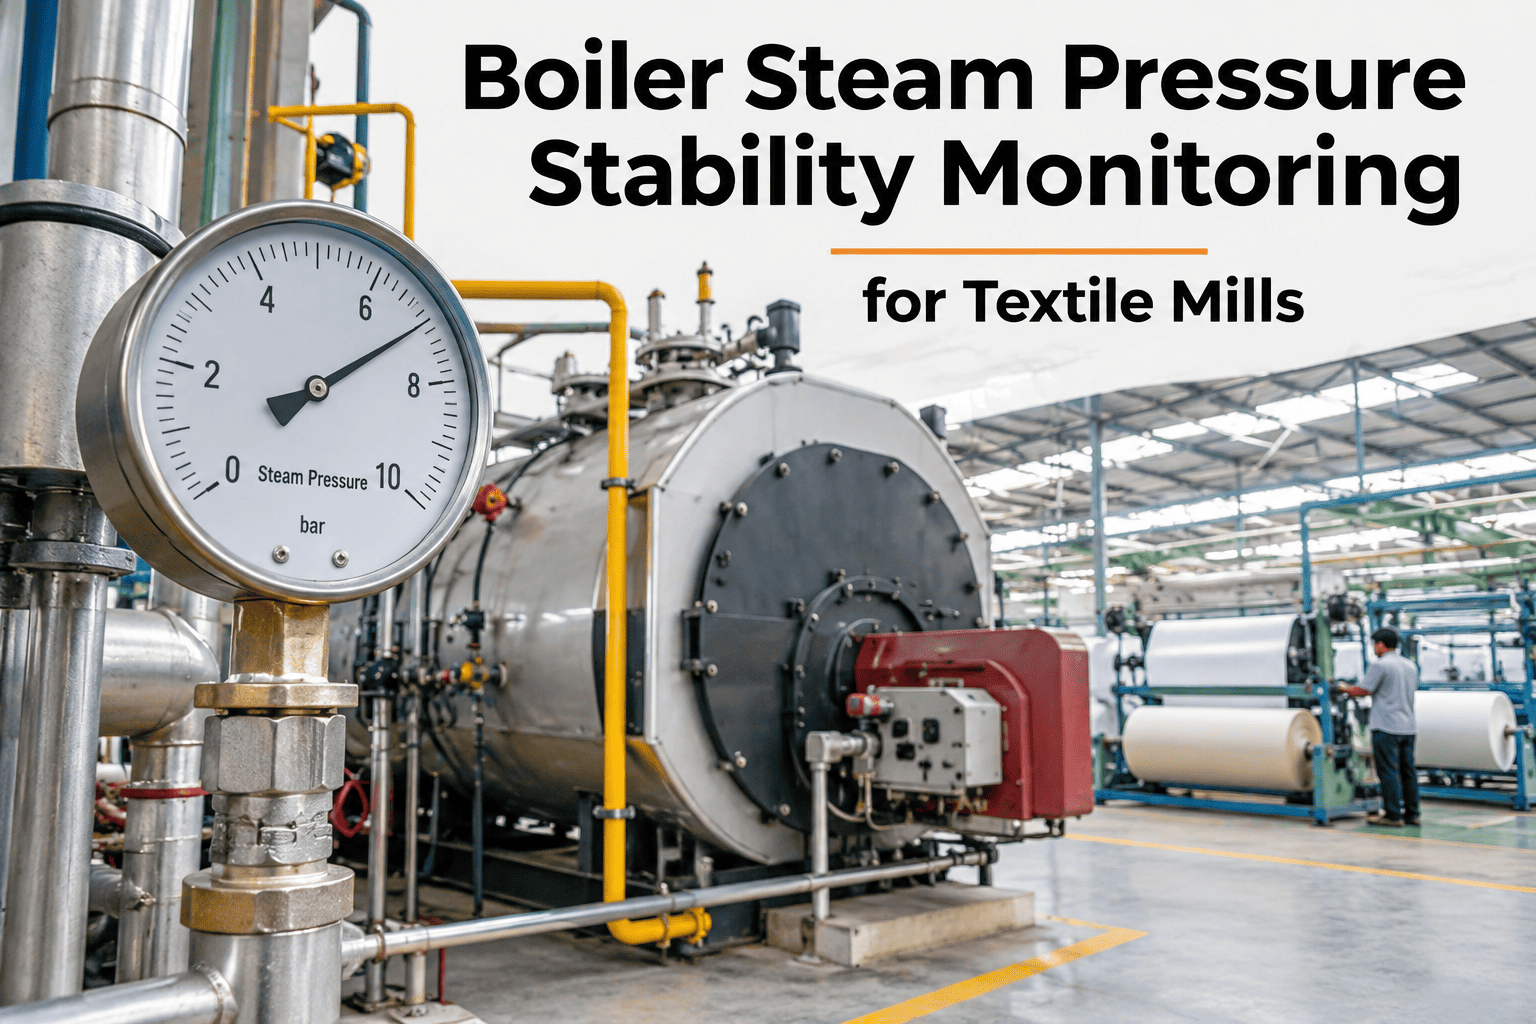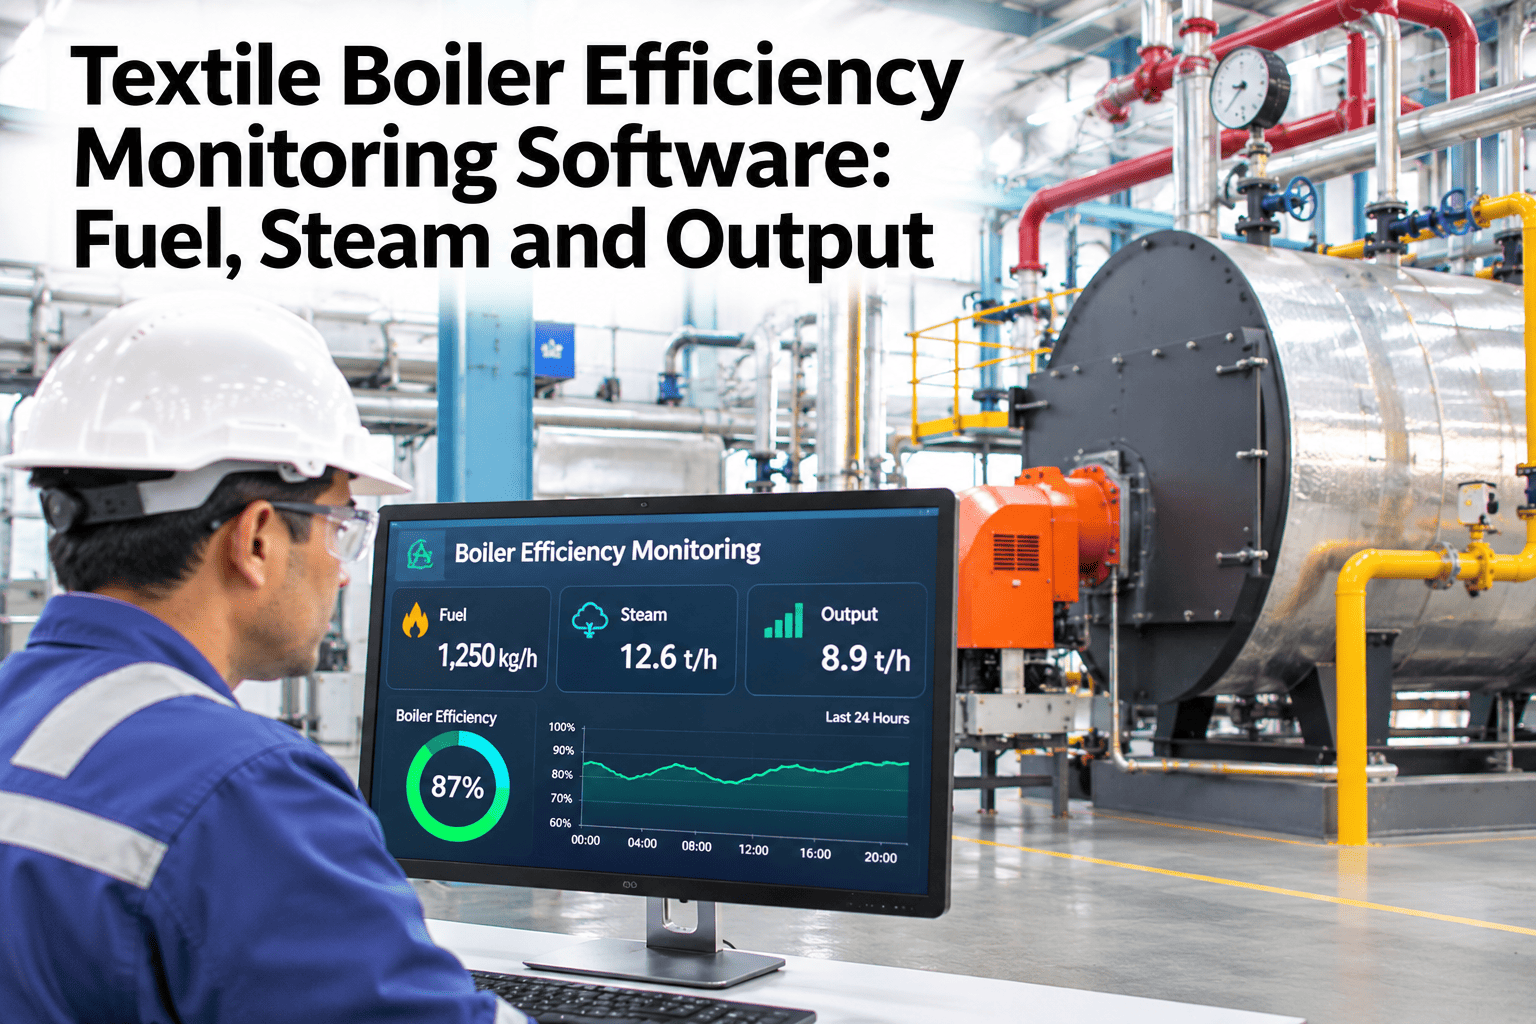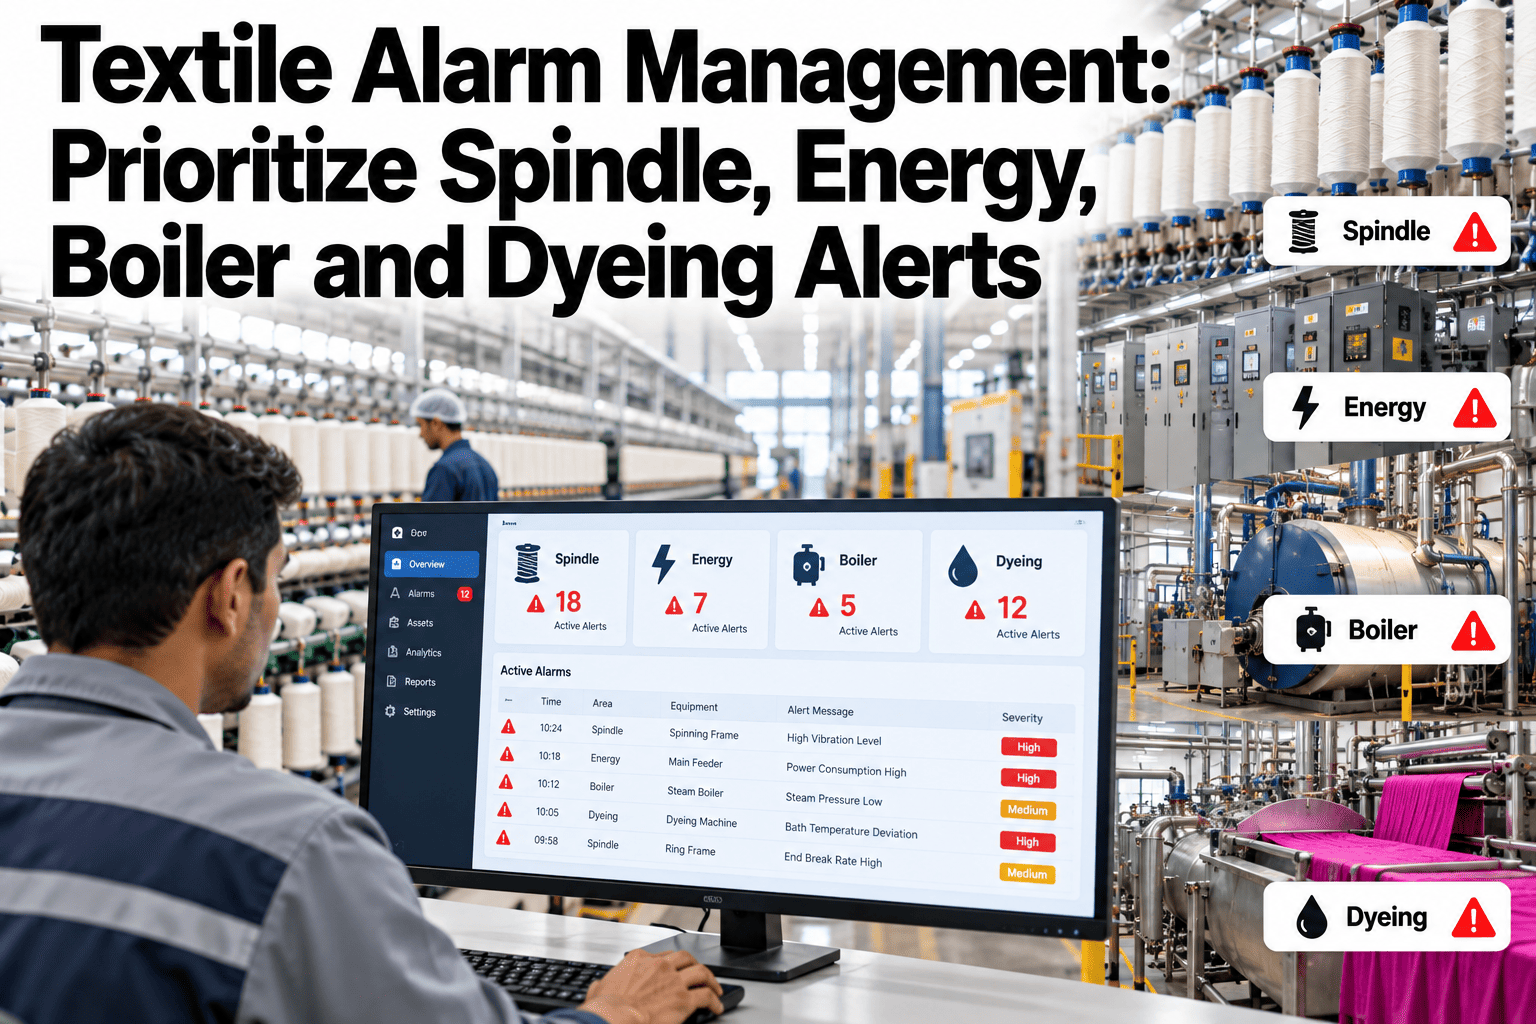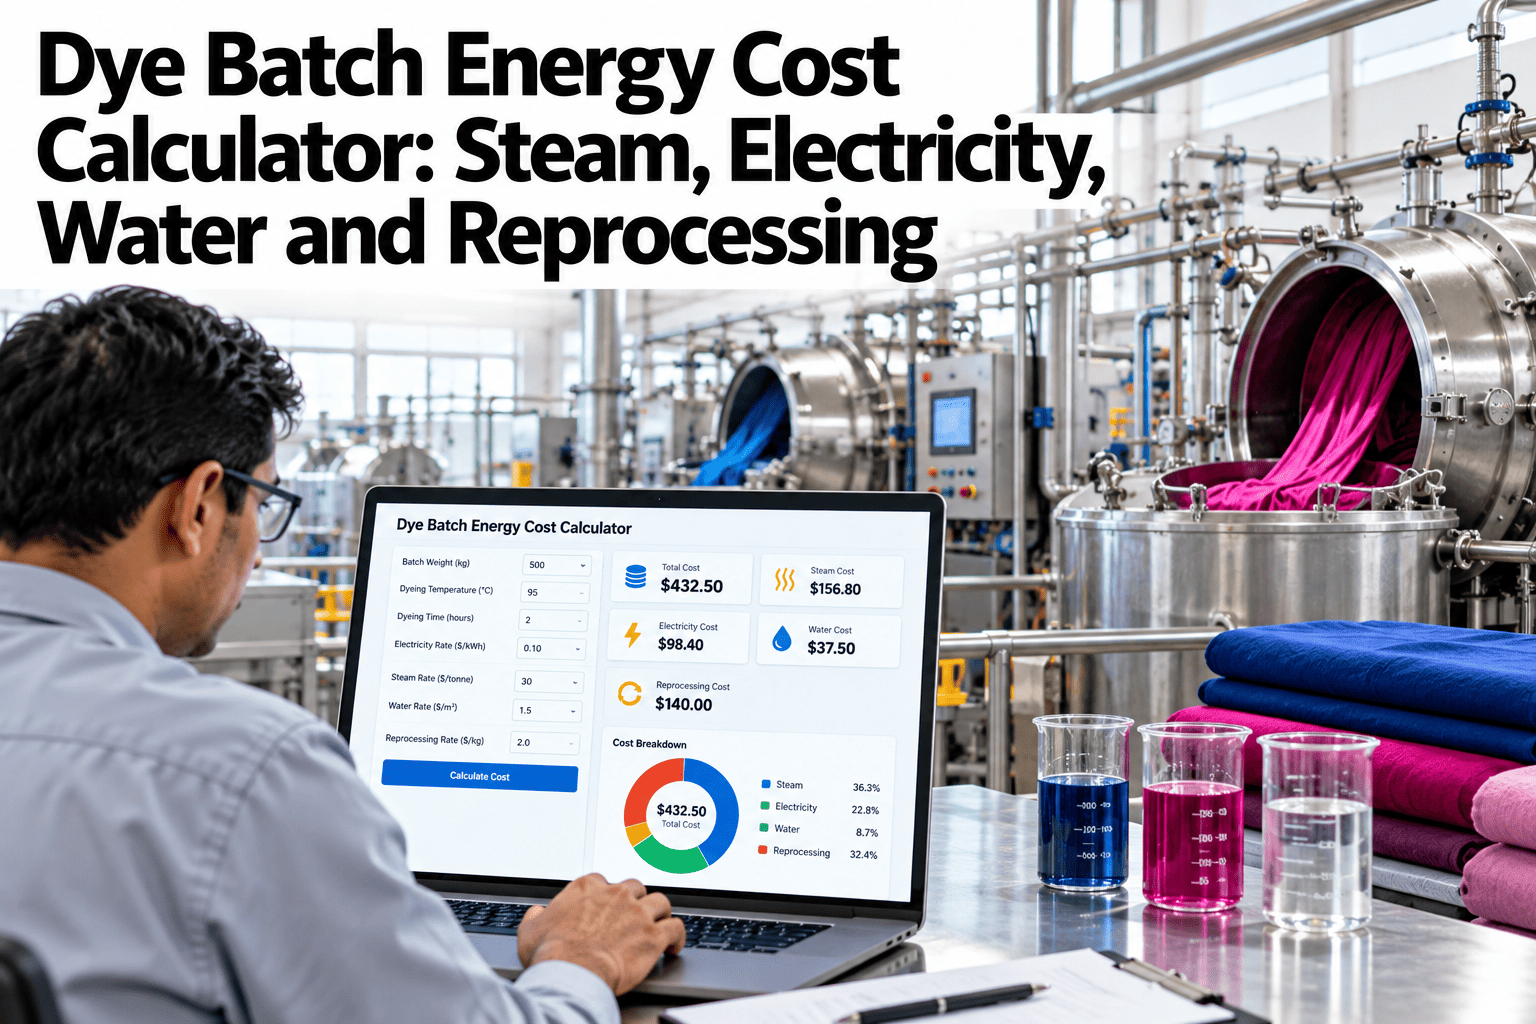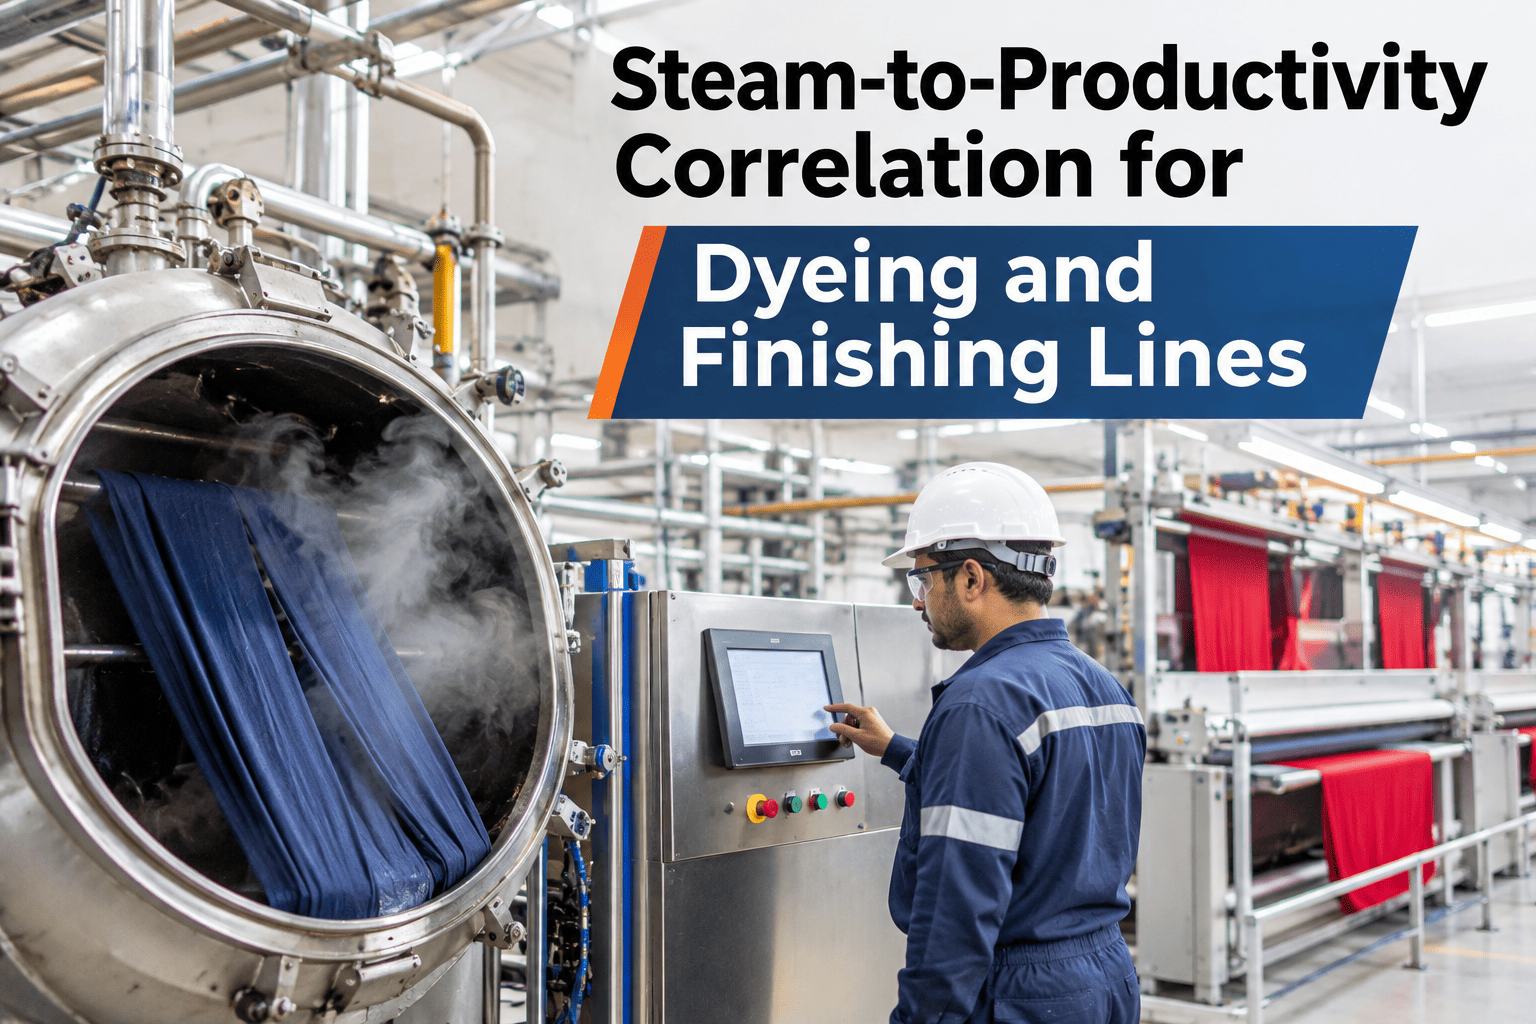
Steam consumption and fabric output move together in a dye house or finishing range, but they rarely move in the same ratio. When output rises 10% and steam rises 18%, someone is burning fuel that production never needed. When a reprocessing run adds 400 kg of fabric weight to the daily log but the steam meter already counted those kilograms once, the per-kg efficiency figure becomes meaningless. Connecting steam meter data to actual production records — batch count, confirmed output metres, quality pass rate, and reprocessing volume — is the only way to calculate a steam productivity figure that tells the truth. iFactory AI builds this correlation continuously from your plant data so finishing managers can see which lines, shifts, and product types are eroding their steam productivity.
Your Steam Meter and Your Output Counter Are Speaking Different Languages. Let's Connect Them.
iFactory AI correlates live steam consumption with actual fabric output, batch quality, and reprocessing volume — giving finishing and dyeing teams a steam productivity score that reflects reality, not averages.
What Is Steam-to-Productivity Correlation?
Steam-to-productivity correlation is the analysis of how steam consumption relates to confirmed productive output — expressed as kg steam per kg fabric, kg steam per metre, or GJ per tonne — after removing the steam consumed on reprocessing, idle periods, and distribution losses. It answers the question: of every kilogram of steam the boiler generated today, how many produced saleable fabric?
The industry benchmark for steam-to-fabric ratio in textile finishing is below 4.0 kg of steam per metre, according to 2026 iFactory Energy data. Plants consistently above this benchmark are losing steam to one or more of the four hidden drains: reprocessing, idle time, distribution losses, or over-programmed heating cycles.
Which Factors Drive Poor Steam Productivity in Dyeing and Finishing?
Poor steam productivity is rarely one problem — it is a combination of machine, process, and scheduling factors that individually seem small but together consume 20–35% of generated steam without producing saleable fabric.
Know What Share of Your Steam Is Doing Useful Work
iFactory AI separates productive steam from reprocessing, idle, and loss steam — and shows the split by machine, shift, and substrate. Book a 30-minute session to see your own steam data structured this way.
How to Measure Steam Productivity in a Working Dye House
The practical challenge is that steam meters measure flow, not intent. A meter cannot distinguish between steam used to produce a shade-pass batch and steam used on a re-dye of the same batch. The linkage has to be built in the data layer by joining steam flow timestamps to batch controller events, production records, and quality outcomes. iFactory AI performs this join automatically, using batch ID as the common key across the steam, production, and quality data systems.
Steam Productivity by Process Stage — What to Target First
Not all steam losses are equally recoverable. The table shows the typical contribution of each loss category to overall steam waste and the fastest-payback intervention for each.
| Loss category | Typical share of wasted steam | Detection method | Fastest intervention | Payback timeframe |
|---|---|---|---|---|
| Reprocessing & re-dye | 35–45% | Batch classification vs quality outcome | Root cause analysis on highest re-dye substrates | 2–6 months |
| Idle at temperature | 20–30% | Steam flow during batch gaps | Scheduling tightening, standby mode protocols | 1–3 months |
| Over-programmed hold cycles | 15–25% | Cycle stage steam vs quality linkage | Hold time reduction trials per substrate | 2–4 months |
| Distribution and trap losses | 10–20% | Steam trap survey + flow balance | Failed trap replacement | 6–18 months |
Reprocessing consistently dominates because every re-dye batch doubles the steam cost of that production unit with no additional output. A finishing manager who wants to quantify the steam cost of their current re-dye rate can see that calculation run on their own batch and quality data in a short session.
Where iFactory AI Fits
iFactory AI, an on-premise AI platform for textile manufacturing, connects steam meters, batch controllers, boiler data, and quality management records into a single analytics layer deployed on NVIDIA GPU servers inside your plant. The steam productivity module ingests data via OPC-UA, Modbus, or existing PLC integrations, classifies every steam event by production outcome, and delivers a daily steam productivity score with drill-down by machine, shift, substrate, and loss category.
Frequently Asked Questions
What is a good steam-to-fabric ratio target for dyeing and finishing?
The 2026 iFactory Energy benchmark sets a target of below 4.0 kg of steam per metre for finishing lines as an industry efficiency standard. For exhaust dyeing, targets vary by substrate: polyester typically reaches 3.5–4.5 kg steam per kg fabric, while cotton exhaust dyeing is higher at 5–8 kg per kg due to longer bath cycles and higher liquor ratios. The more actionable approach is to track your own net steam intensity trend rather than chasing a single absolute number, since machine type and substrate mix define your realistic target. Get a benchmark analysis for your specific machine types and substrates.
How is steam productivity different from boiler efficiency?
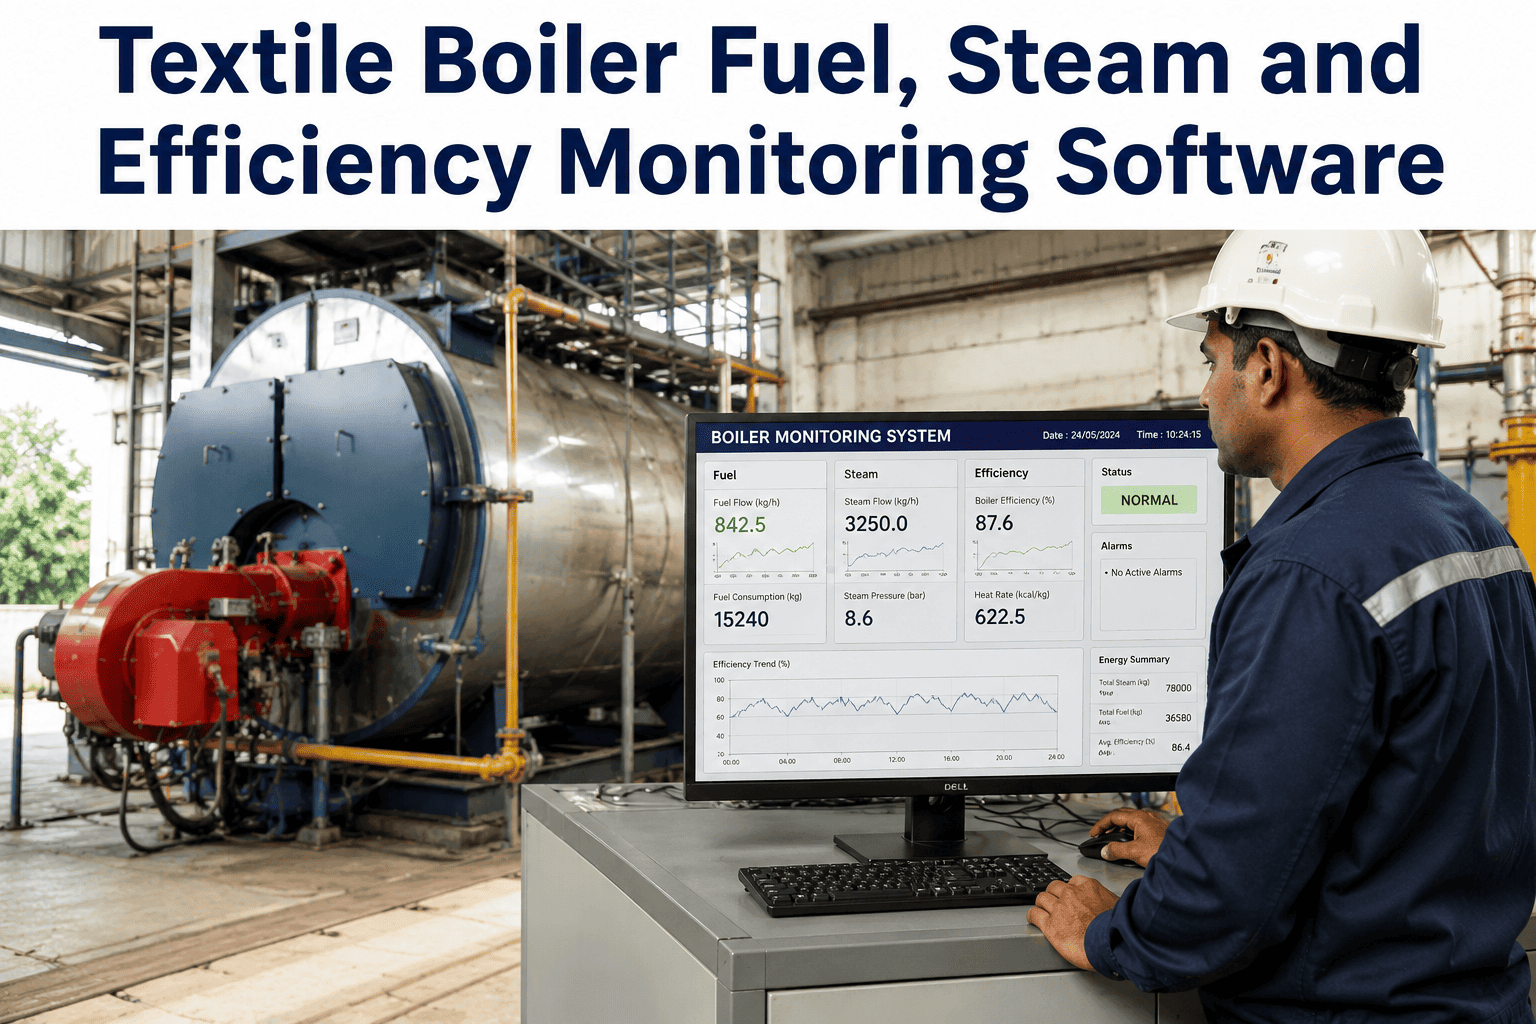
Boiler efficiency measures how well the boiler converts fuel into steam — typically 80–90% for a well-maintained system. Steam productivity measures how much of that steam produces confirmed fabric output. A plant can have a 90% efficient boiler and still waste 25% of its steam on idle time and reprocessing. Both metrics matter, but steam productivity is the one that reveals the production and scheduling decisions driving energy cost. Ask our team how boiler efficiency and steam productivity are tracked together.
Can steam productivity analysis identify which substrates are most expensive to process?
Yes — and this is one of the most commercially useful outputs of the analysis. By calculating net steam intensity for each substrate type, dyeing managers can see which products carry the highest steam cost per kg and whether that cost reflects the substrate's requirements or a process inefficiency that could be corrected. This information also supports more accurate product costing when steam is a significant production input. See a substrate-level steam cost breakdown run on sample data.
Does the analysis require a new steam meter installation?
Not necessarily. If your boiler system already has flow meters on the main steam headers, those readings combined with batch controller timestamps can provide sufficient data for a first-level steam productivity analysis. For higher resolution — per-machine rather than per-department — individual machine-level vortex or ultrasonic flow meters are added to the supply lines. iFactory AI specifies which metering points add the most analytical value before any sensor procurement, minimizing unnecessary capital. Ask our instrumentation team to review your existing meter coverage.
How is condensate recovery factored into steam productivity?
Condensate recovery reduces the boiler's thermal load — returning hot condensate at 70–90°C means less energy is needed to bring feedwater to steam temperature. iFactory AI's steam module tracks condensate return percentage alongside the steam productivity score, flagging drops in return rate as an alert because they increase the effective thermal cost of every kg of steam generated. Plants recovering 85–90% of condensate see meaningfully lower net steam intensity than those recovering 50–60%. Include condensate recovery in your steam productivity review.
More Than Half Your Steam Waste Has a Name. Let's Find It.
iFactory AI maps reprocessing, idle, and distribution steam separately from productive output — so your finishing team knows exactly where the fuel bill is going and what to fix first. Book a session to see the analysis on your plant data.