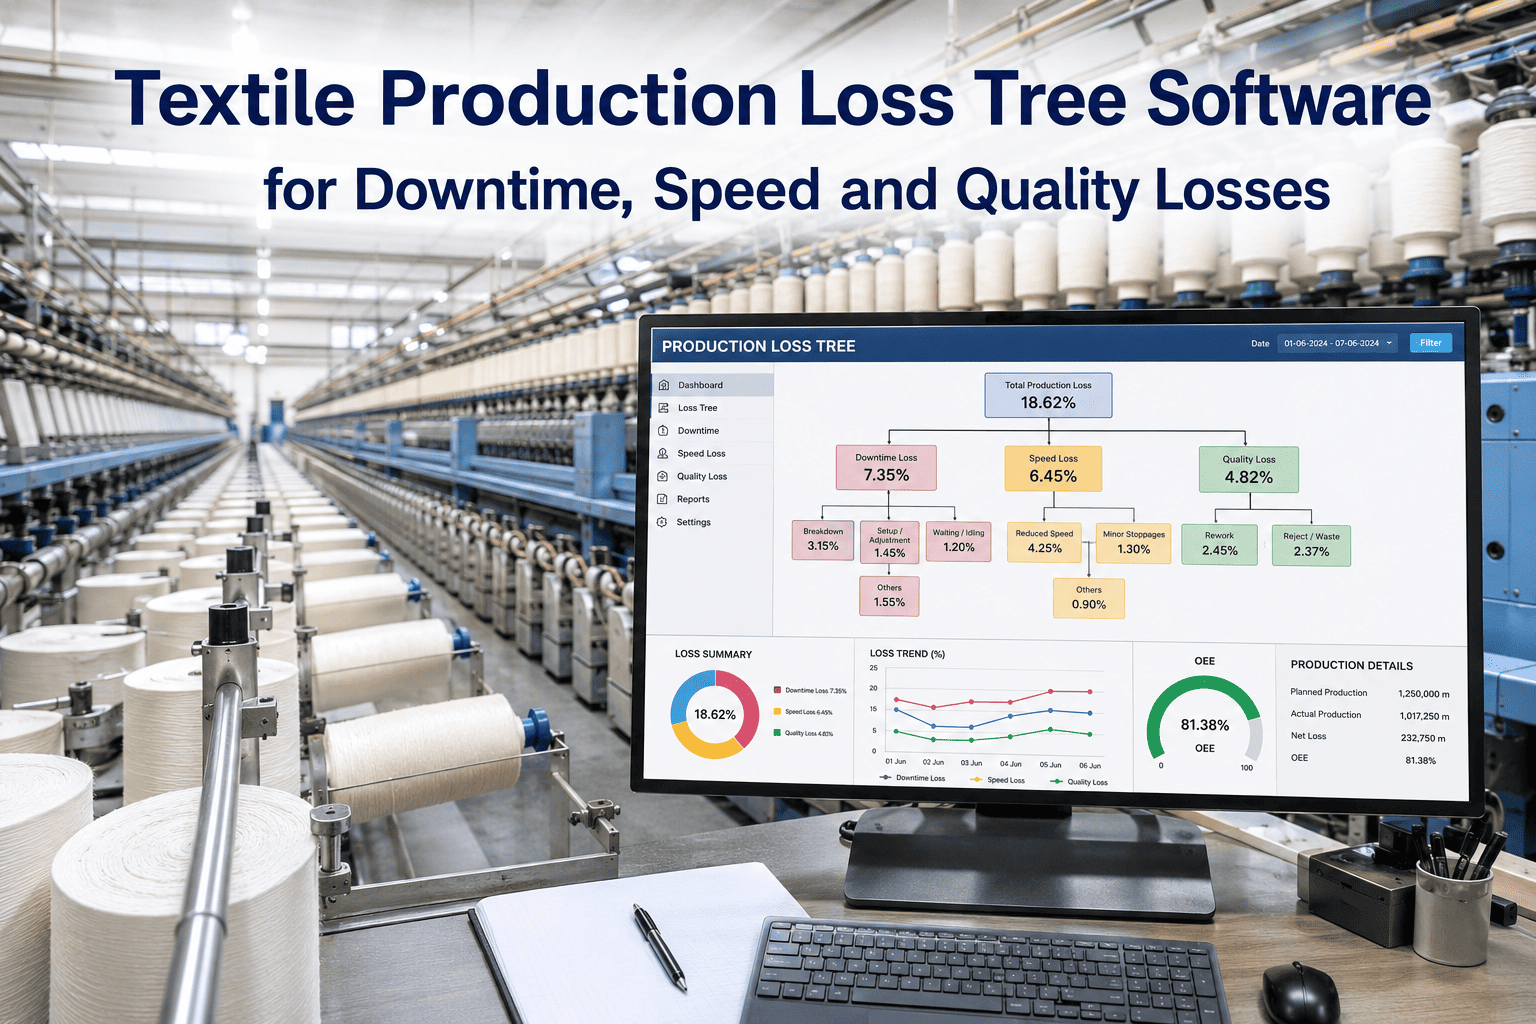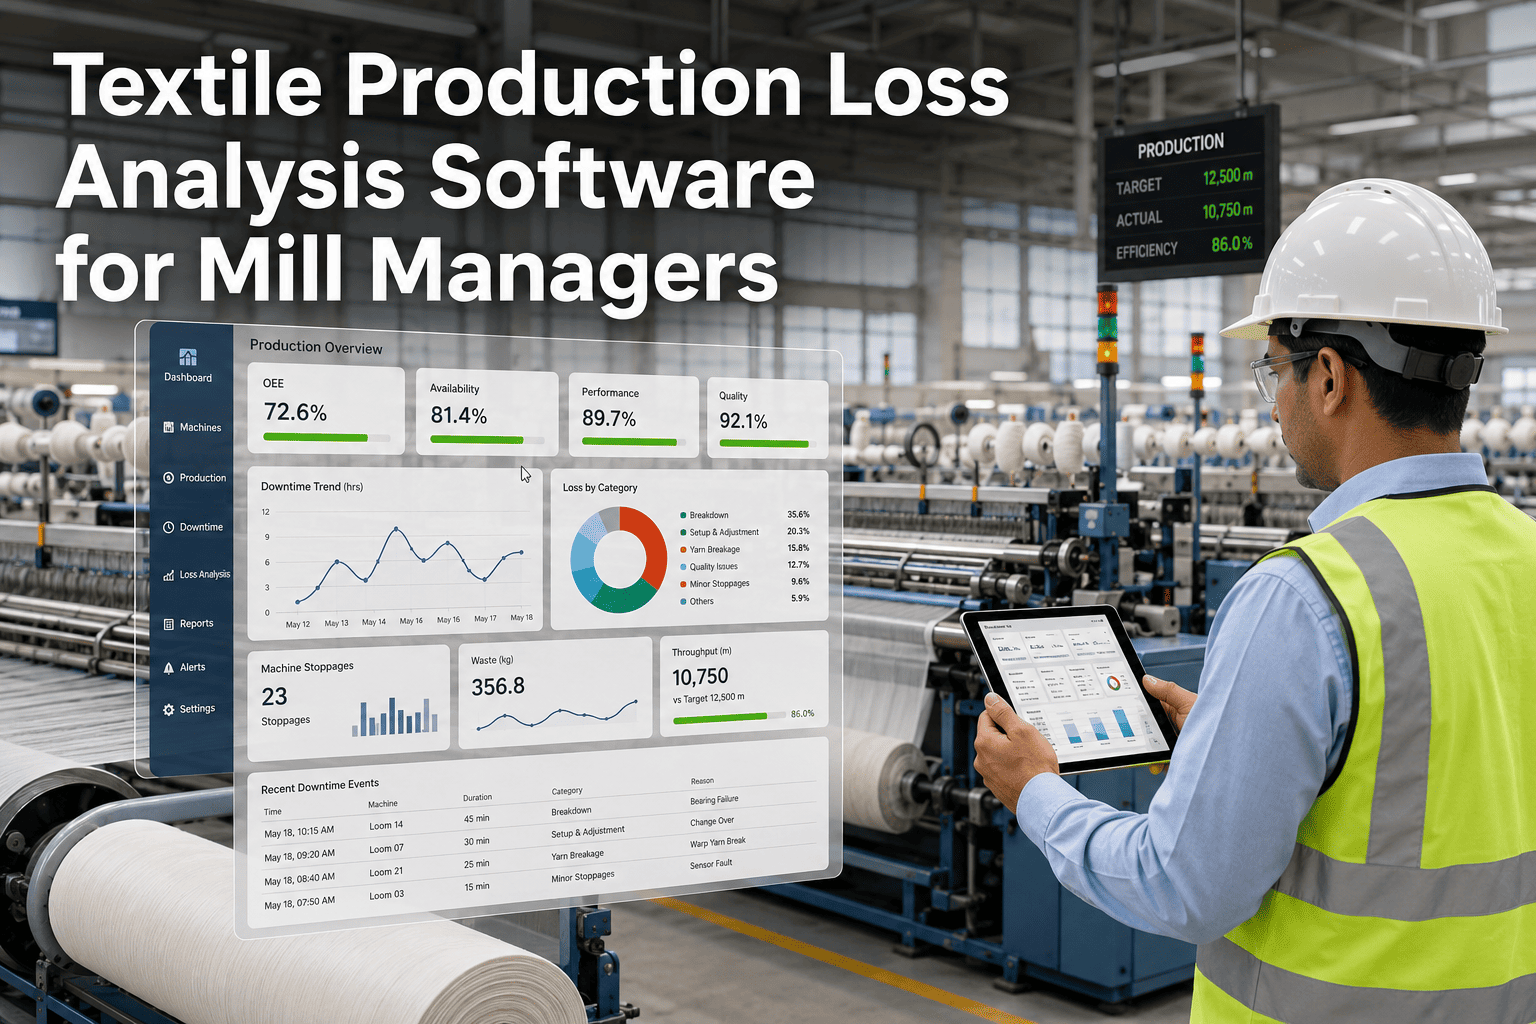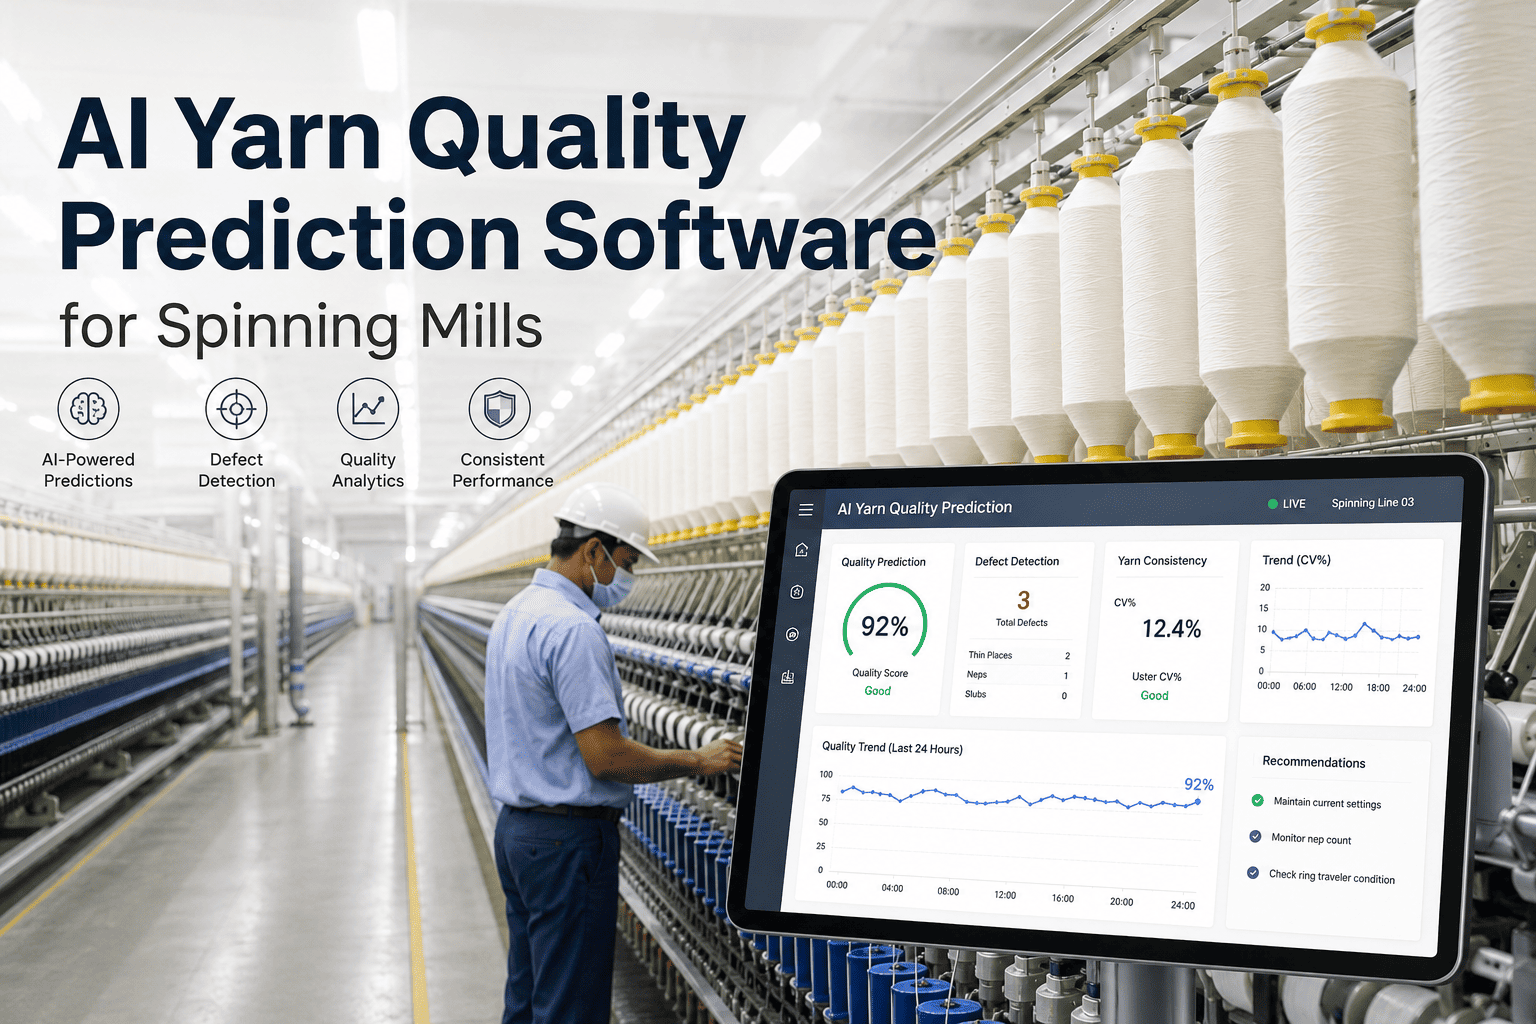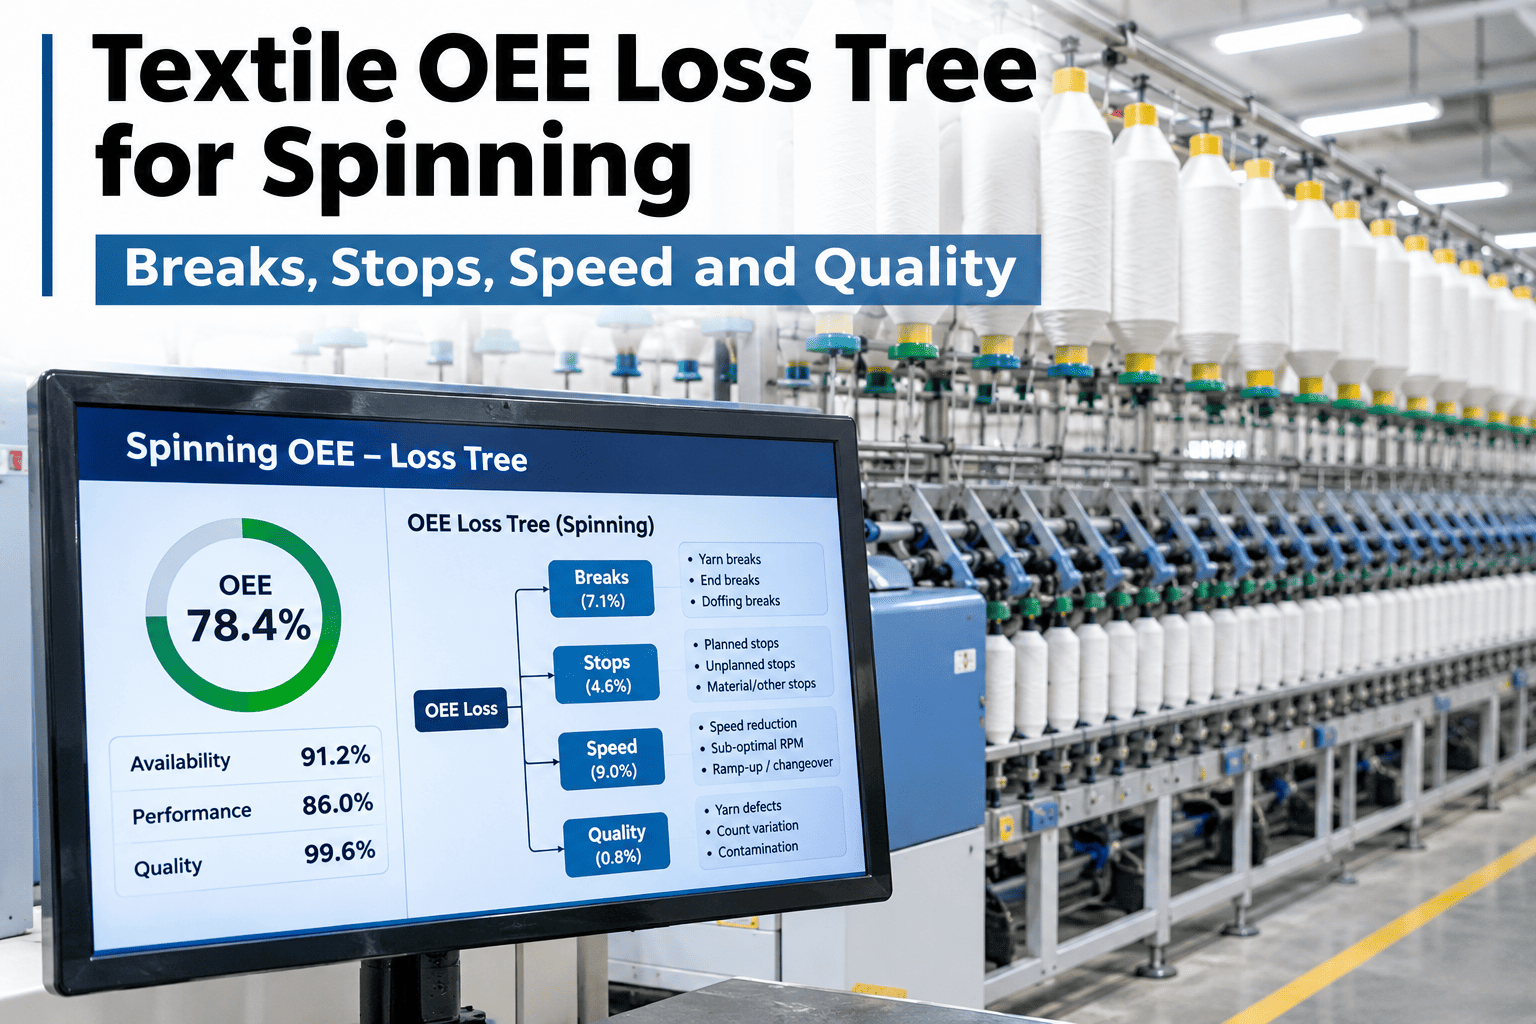
A spinning mill's OEE number on its own says only that output fell short of theoretical maximum, not why, and "why" is where every real improvement decision actually lives. A loss tree breaks that single number into yarn breaks, spindle stops, speed loss, changeovers, quality defects and microstops, so the biggest opportunity on a frame stops being a guess and becomes a specific, ranked number. iFactory AI, an on-premise AI platform for manufacturing, builds this breakdown directly from a mill's own spinning data, and production leaders can see their own spinning OEE broken into its real loss categories with our team.
One OEE Number, Six Loss Categories Behind It
A textile OEE loss tree for spinning splits the gap between actual and theoretical output into yarn breaks, spindle stops, speed loss, changeovers, quality defects and microstops.
Why "OEE Is 78 Percent" Tells You Almost Nothing to Act On
Two frames can both report 78 percent OEE for completely different reasons, one losing most of its gap to yarn breaks and the other to changeovers, and the fix for each is entirely different. A single blended OEE number treats both frames as the same problem, which means whatever improvement action follows is a guess dressed up as a data-driven decision.
Where Spinning OEE Actually Goes
Two Frames, Same OEE, Opposite Problems
Picture two ring frames both reporting 76 percent OEE for the month. On the first, the loss tree shows yarn breaks and spindle stops dominating the gap, pointing toward a traveler or ring condition issue worth a maintenance investigation. On the second, changeovers and speed loss dominate instead, pointing toward a scheduling and count-change efficiency problem that has nothing to do with the mechanical condition of the frame itself. A team looking only at the blended 76 percent would have treated both frames with the same generic improvement plan, likely helping one and doing almost nothing for the other.
Once the loss tree separated the two, each frame got the specific intervention its own data actually called for, which is the entire point of breaking a single number into its real categories.
From Theoretical Maximum to Actual Output
See Your Frame's Loss Tree Built From Real Data
Share a shift or two of your spinning data, and iFactory AI will show how your OEE gap splits across the six categories.
One OEE Number Against Six Visible Categories
Why Microstops Are the Branch Most Often Missed
A single microstop under a minute rarely gets logged by hand, because by the time an operator notices and reaches for a form, the spindle is already running again. Across hundreds of spindles over a shift, though, those short stops accumulate into a real loss category, often one of the largest once properly captured, which is exactly why a loss tree built from automated machine signals catches something a manual log almost always misses.
The Same Loss Tree, Read by Three Roles
What a Mill Needs Before the First Loss Tree Builds
Building a reliable loss tree needs machine-level stop and speed data, which most modern spinning frames already generate through their own control systems, plus a connected quality result for each run to attribute the final category correctly. A mill without that data flowing anywhere yet should expect the first project step to be connecting it, which is valuable groundwork regardless of how the loss tree analysis itself turns out.
What a Running Loss Tree Shows That One Shift Cannot
A single shift's loss tree tells you what happened that shift. A rolling view across weeks tells you whether a branch is genuinely a structural problem with a frame or a one-off caused by a specific lot of fiber or a particular operator's shift. That distinction matters enormously for where improvement effort goes, since a structural issue justifies a maintenance or equipment investment while a one-off calls for a narrower, cheaper fix.
Plants that track the loss tree over time, rather than treating each shift's breakdown as a standalone snapshot, are the ones that end up correctly separating the frames worth real capital attention from the frames that just had a bad week.
Mistakes That Weaken a Loss Tree Analysis
What a Production Engineer Would Check First
What Spinning Teams Ask About OEE Loss Trees
Stop Guessing at the OEE Gap
Book a session with iFactory AI to build a loss tree from your own spinning frame data.