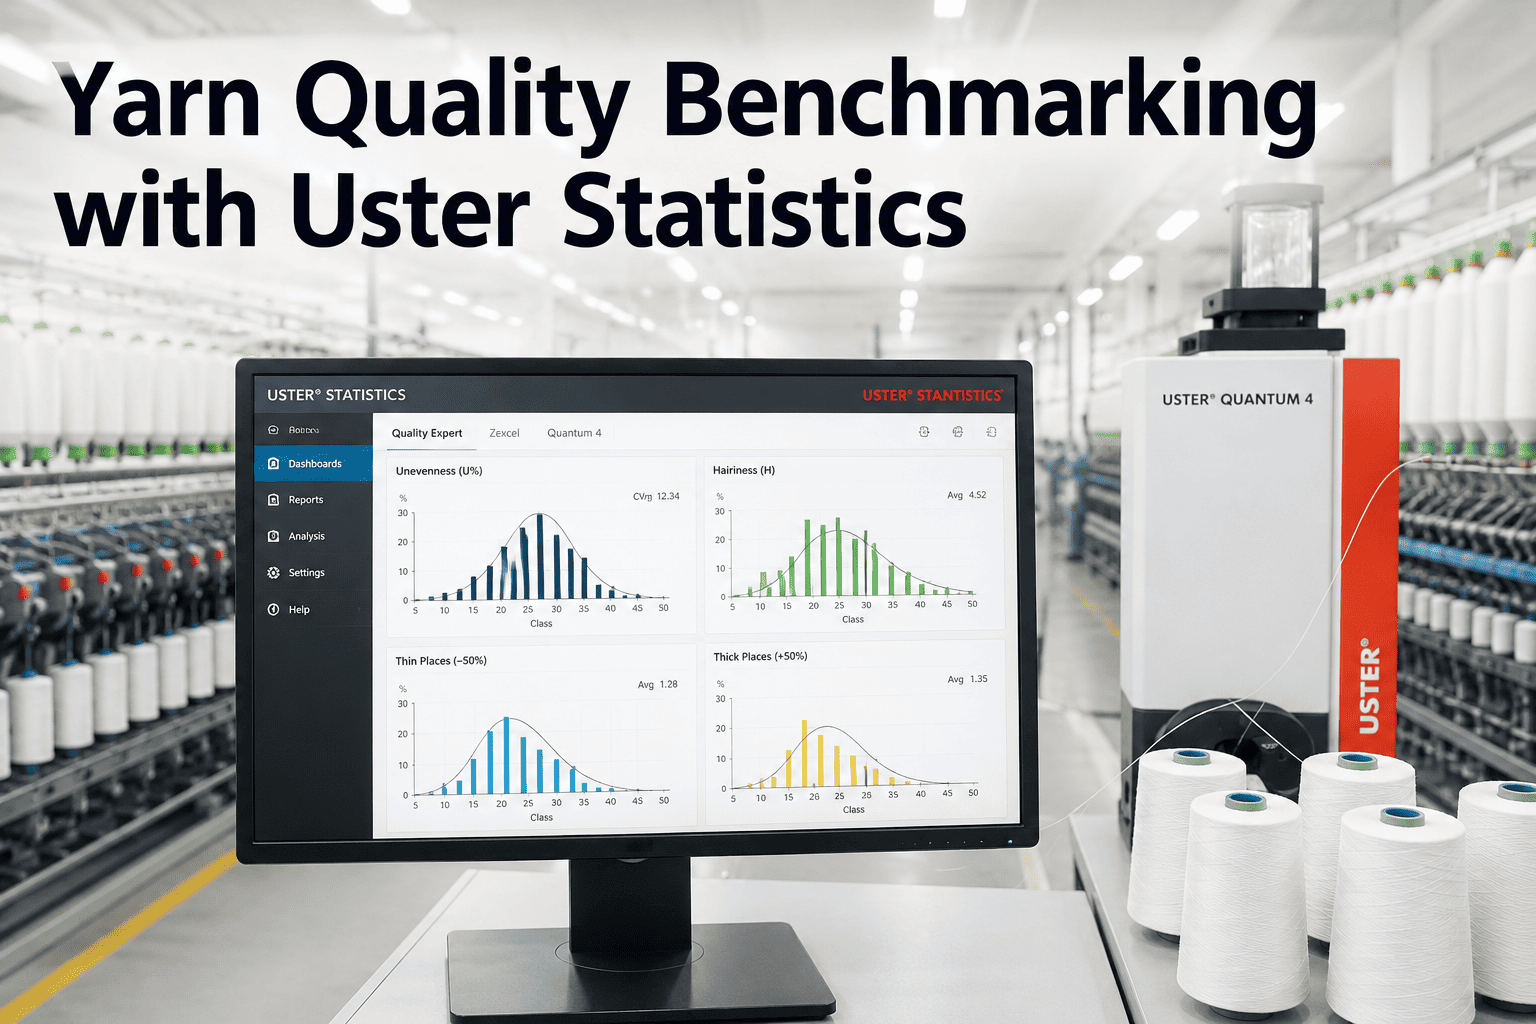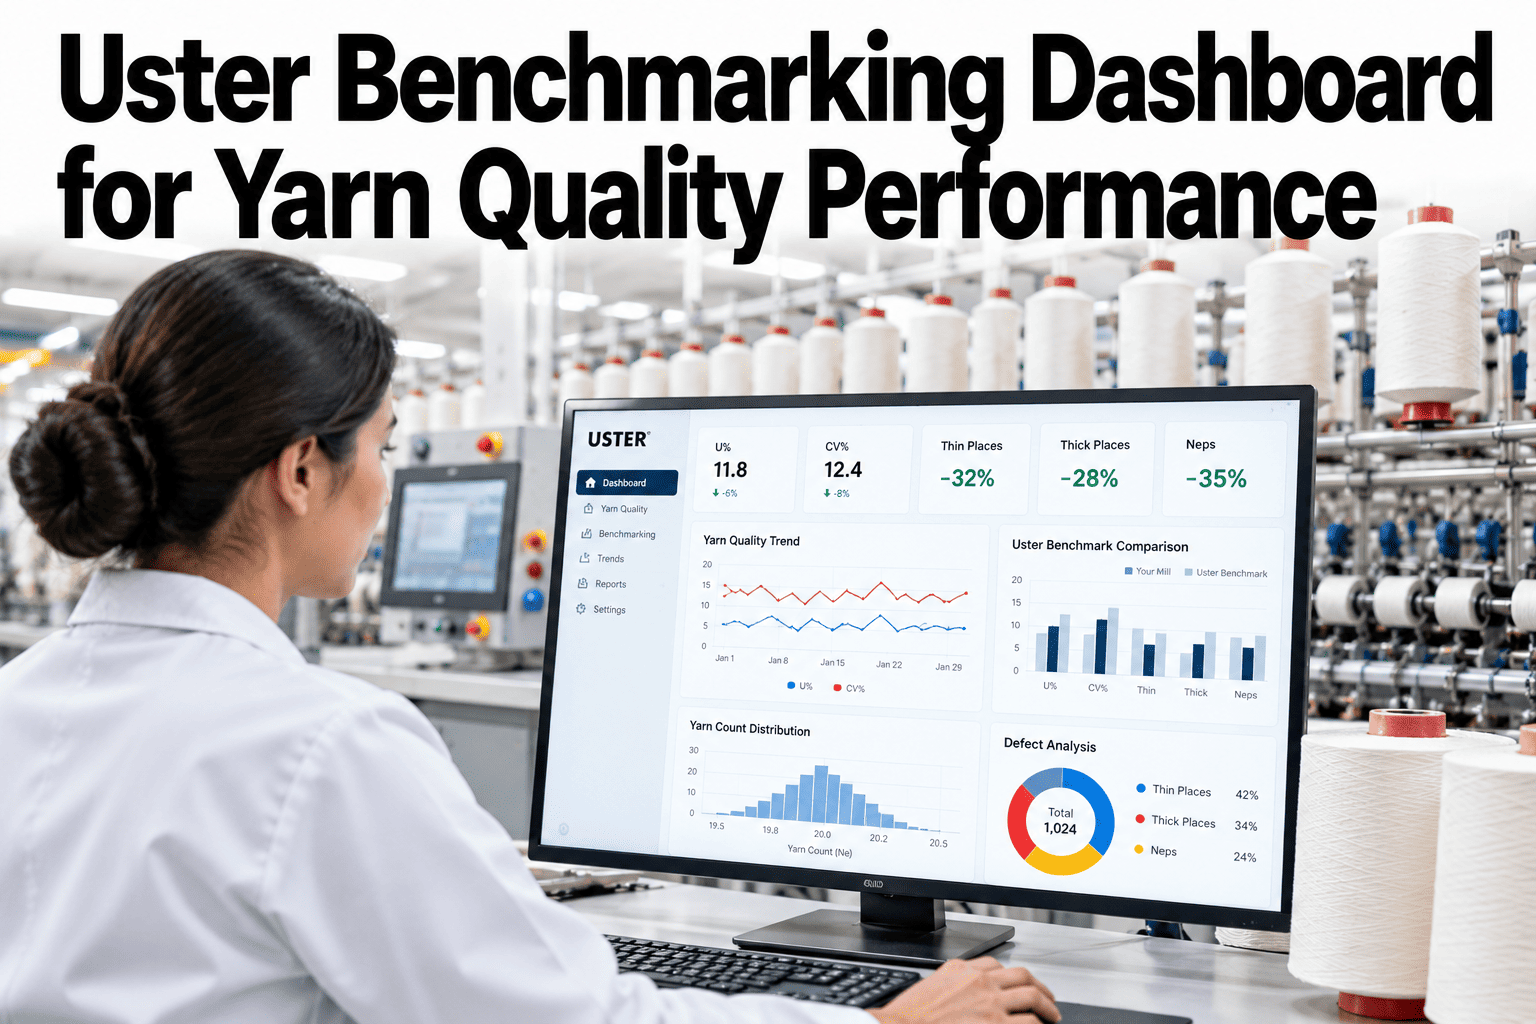
Knowing your yarn CV% is 13.8% means very little in isolation. Knowing it sits at the Uster Statistics 50th percentile for your count — while your closest competitor is at the 25th — is a commercial insight that informs investment decisions, customer positioning, and process improvement priorities. Uster Statistics benchmarking gives every test result a global context. iFactory AI builds the dashboard that makes this benchmarking continuous, count-specific, and connected to the production data that explains why the percentile sits where it does. See how your yarn quality benchmarks against Uster Statistics in iFactory AI.
Know Where You Stand — Against the World
Uster Statistics percentile benchmarking for every quality parameter, every count, updated every test cycle — so your quality team always knows the competitive position.
What Uster Statistics Benchmarking Actually Tells You
Uster publishes global yarn quality statistics periodically, covering hundreds of thousands of test results across yarn counts, fiber types, and spinning systems worldwide.
Uster Statistics percentiles are count-specific and spinning-system-specific — a ring-spun Ne 30 result is benchmarked against ring-spun Ne 30 global data, not an aggregate across all counts and systems.
Building the Benchmarking Dashboard
A useful benchmarking dashboard does more than display percentile numbers. It connects those numbers to the production context that produced them and the trend that shows whether the position is improving or deteriorating.
All active yarn counts displayed with current Uster Statistics percentile for each quality parameter. Parameters above target highlighted. Parameters at risk highlighted in a different signal. The single most important view for daily quality management decisions.
Rolling 12-week percentile trend per count per parameter. Improving percentile confirms improvement actions are working. Deteriorating percentile signals a drift that may not be visible in absolute numbers without the global context.
Internal quality targets displayed alongside the corresponding Uster percentile, showing whether the internal target is ambitious relative to global performance or is already comfortably within world-average. This comparison prevents targets from being set too easy for competitive counts.
Percentile position broken down by machine for the same count, showing which ring frames are producing at the 25th percentile and which are pulling the count average toward the 75th. The gap between best and worst machine is the improvement opportunity already inside the mill.
Customer quality limits overlaid on the Uster Statistics scale, showing not just whether the specification is being met but whether the production quality position relative to global data provides adequate margin above the customer's minimum requirement.
Every production lot benchmarked at shipment against Uster Statistics, providing the quality team with an objective quality certificate that goes beyond the absolute test values and shows the global competitive position of that specific lot.
Quality Parameters to Benchmark and Their Significance
Not all Uster Tester parameters carry equal weight in customer applications. Benchmarking priority should reflect which parameters most directly affect the end-use requirements of your yarn markets.
| Quality Parameter | Primary Market Sensitivity | Uster Statistics Basis | Benchmark Target (Typical) |
|---|---|---|---|
| CV% (Evenness) | Woven fabrics, barriness sensitivity | Count, fiber type, spinning system | 25th percentile for quality markets |
| Thin places (−50%) | Weaving efficiency, end break rate | Count, spinning system | 25th–50th percentile |
| Thick places (+50%) | Fabric appearance, winding efficiency | Count, spinning system | 25th–50th percentile |
| Neps (+200%) | Dyed fabric appearance, specks | Count, fiber type | 25th percentile for premium dyed |
| Hairiness (H) | Knitted fabric pilling, weaving | Count, spinning system | 25th percentile for knitting |
| Tenacity (cN/tex) | Knitting and high-speed weaving efficiency | Count, fiber type, spinning system | 25th–50th percentile |
Build the Benchmarking Dashboard Your Quality Team Will Actually Use
iFactory AI delivers continuous Uster Statistics benchmarking for every count, every parameter, every production lot — with the machine and material context that explains where you sit and how to move up. Book a session to see it on your own data.
Frequently Asked Questions
How often is Uster Statistics updated, and how does iFactory AI handle the update?
Uster Technologies publishes updated Statistics periodically as new global test data accumulates. iFactory AI updates the Uster Statistics reference data when new editions are released, so benchmarking comparisons are always based on the current published dataset. Historical trend lines adjust automatically so percentile movement reflects genuine quality improvement rather than a statistics edition change. Ask support about the current Uster Statistics edition in use.
Can the benchmarking dashboard be used to set internal quality targets?
Yes. The Uster Statistics percentile scale is the most widely used reference for setting internal yarn quality targets in spinning mills. iFactory AI allows internal targets to be set as percentile positions rather than absolute values, so the target automatically adjusts when the count or count range changes — a 25th percentile target for CV% on Ne 30 and Ne 60 produces different absolute numbers but the same competitive position standard. Walk through target-setting using Uster percentiles in a demo.
Does benchmarking cover open-end rotor spinning as well as ring spinning?
Yes. Uster Statistics includes separate percentile data for ring spinning, rotor spinning, and air-jet spinning, and iFactory AI applies the correct reference for each spinning system and count combination. Benchmarking ring-spun and rotor-spun yarn against the same reference would produce meaningless comparisons — the systems have fundamentally different quality characteristics for the same count.
How can benchmarking percentiles be used when presenting yarn quality to customers?
Uster Statistics percentile certificates are an established quality communication tool in the global yarn trade — buyers in export markets recognize a 25th percentile CV% result as a meaningful quality claim independent of any supplier's own internal scale. iFactory AI generates lot-level benchmarking reports that can accompany shipment documentation, providing buyers with a standardized quality reference they can compare across multiple suppliers on the same basis. See the lot benchmarking report format in a live session.
What is the most important single percentile to track for overall mill quality performance?
CV% evenness is the most comprehensive single indicator because it captures mass variation across the full yarn length and correlates with both downstream processing performance and fabric appearance. It is also the parameter most widely referenced in customer specifications. However, nep percentile is the fastest-moving quality signal and the one most directly linked to customer claims in dyed fabric applications — mills producing for premium piece-dye markets often monitor nep percentile as the primary operational quality alert.
Know Your Quality Position. Improve It Systematically.
iFactory AI delivers Uster Statistics benchmarking for every count and parameter, connected to the machine and material data that explains where you stand. Book a walkthrough to see your real percentile position.