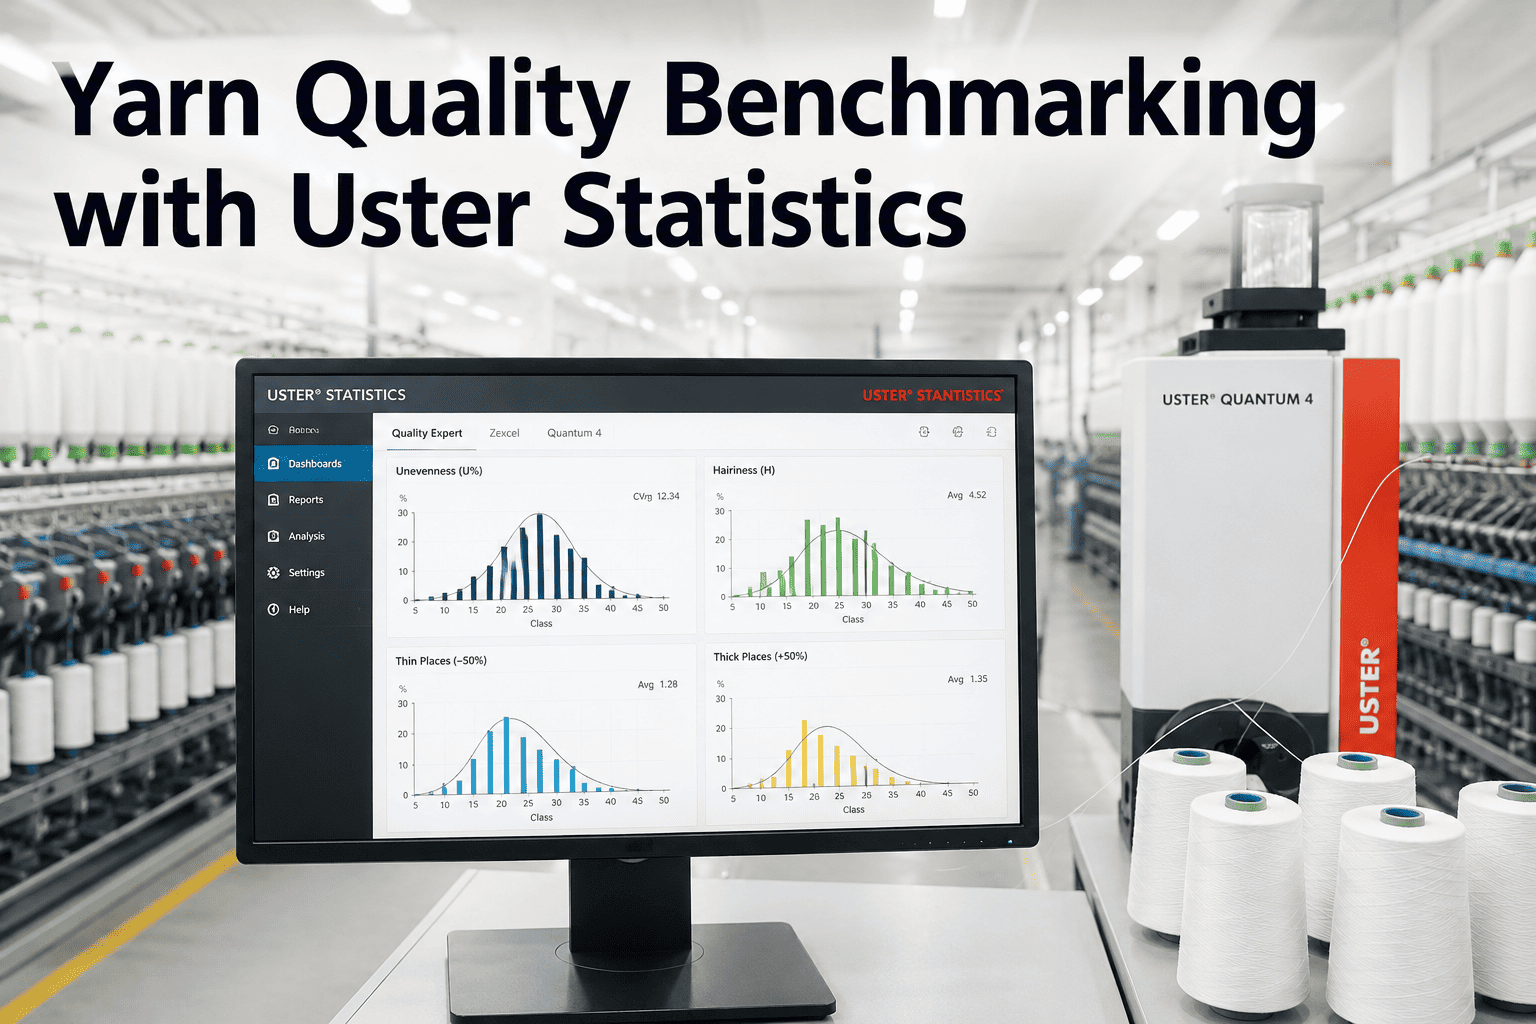
A yarn quality report full of numbers is not the same thing as a yarn quality report full of answers. A CVm% of 14.2 means nothing on its own — it only becomes useful the moment it is placed against the Uster Statistics percentile curve for that count and application, because that placement is what tells a mill whether it is shipping premium yarn, average yarn, or yarn that will draw quality complaints from a downstream customer. Get a walkthrough of automated percentile benchmarking with Book a Demo.
Yarn Quality Benchmarking with Uster Statistics
A structured way to read CVm%, imperfections, hairiness, and tensile results against the Uster Statistics percentile framework — and turn test data into a decision instead of a filed report.
What Each Uster Percentile Band Actually Means
Uster Statistics rank a tested yarn parameter against a global population of mills producing the same count and fiber type. The percentile is not a pass or fail grade — it is a competitive position, and different positions carry different commercial consequences depending on the end use.
Top-tier quality. Suitable for fine knitwear, premium apparel, and customers with the tightest specification tolerances.
Strong commercial quality. Comfortably meets most export specifications with margin for normal process variation.
The statistical average. Acceptable for general-purpose fabric but offers no buffer against buyer complaints on sensitive orders.
Below-average quality. Typically limited to coarser fabric constructions where surface uniformity matters less.
Quality position that invites rejection risk on most contracts and signals a process issue needing root-cause investigation.
Benchmark Every Lot Automatically, Not Just the Ones You Test
See how continuous quality tracking places live production data against Uster percentile bands in real time.
Test Parameters and What a Poor Percentile Actually Signals
CVm% (Mass Variation)
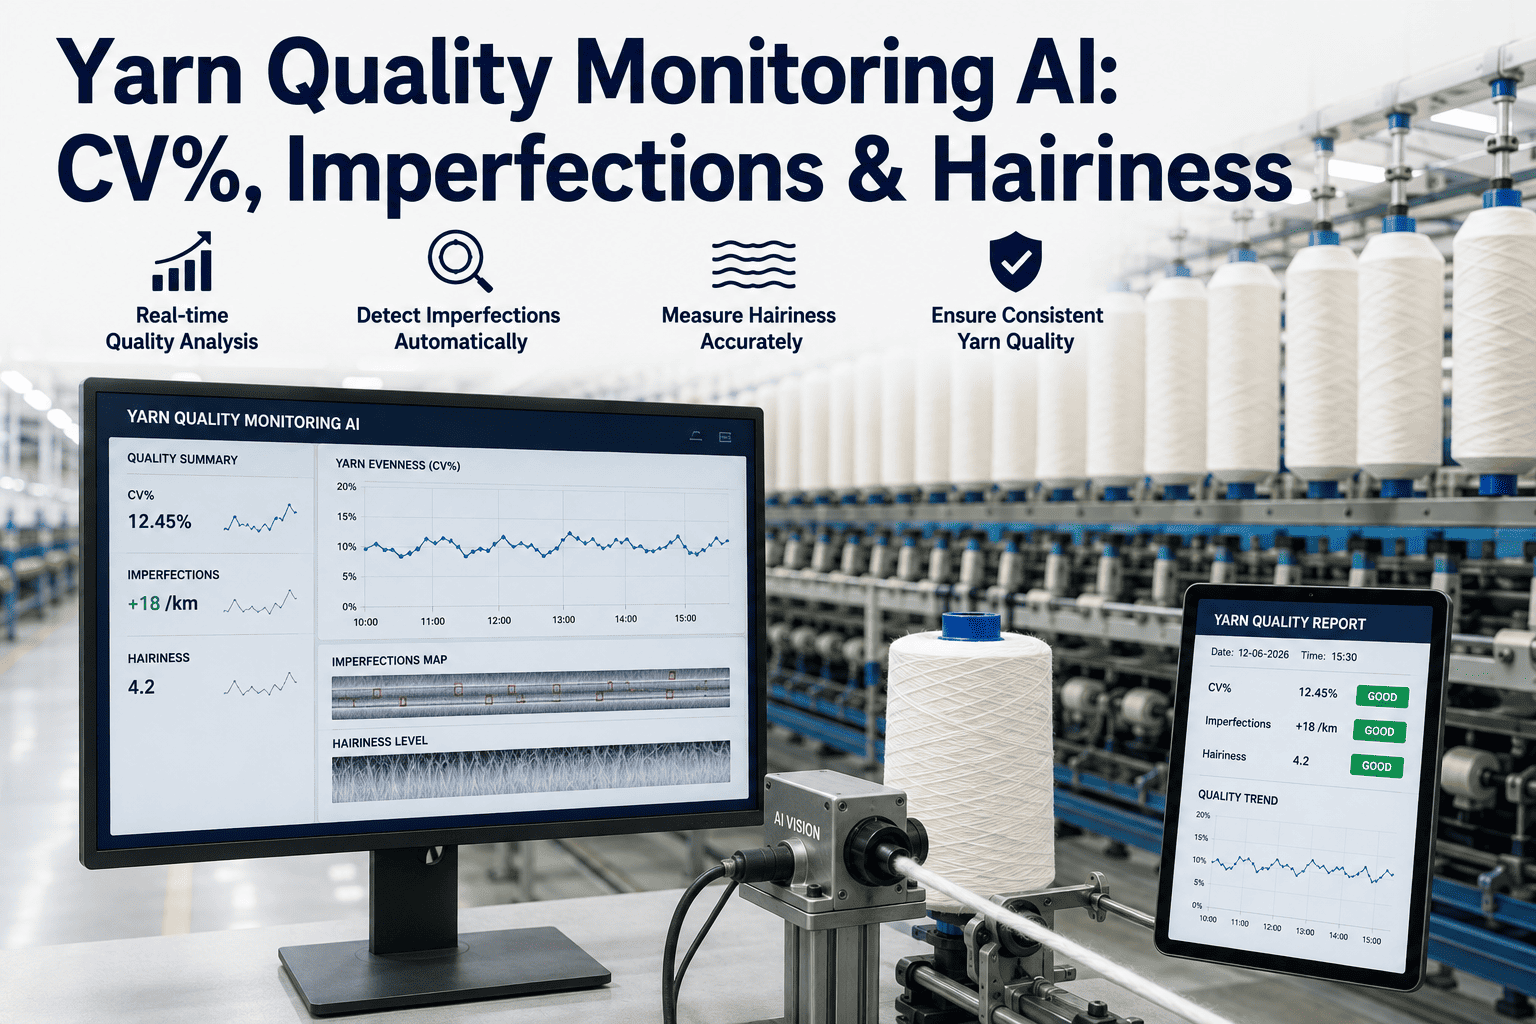
Measures evenness of yarn mass along its length. A poor percentile here usually traces back to drafting roller wear or inconsistent fiber blending upstream of spinning.
Imperfections (Thin, Thick, Neps)
Counts localized defects per kilometer. Rising imperfection counts often point to traveller wear, spindle speed mismatches, or contaminated raw material.
Hairiness Index
Reflects protruding fiber ends on the yarn surface. Excess hairiness affects downstream weaving efficiency and fabric appearance, and often ties back to traveller or ring condition.
Tenacity and Elongation
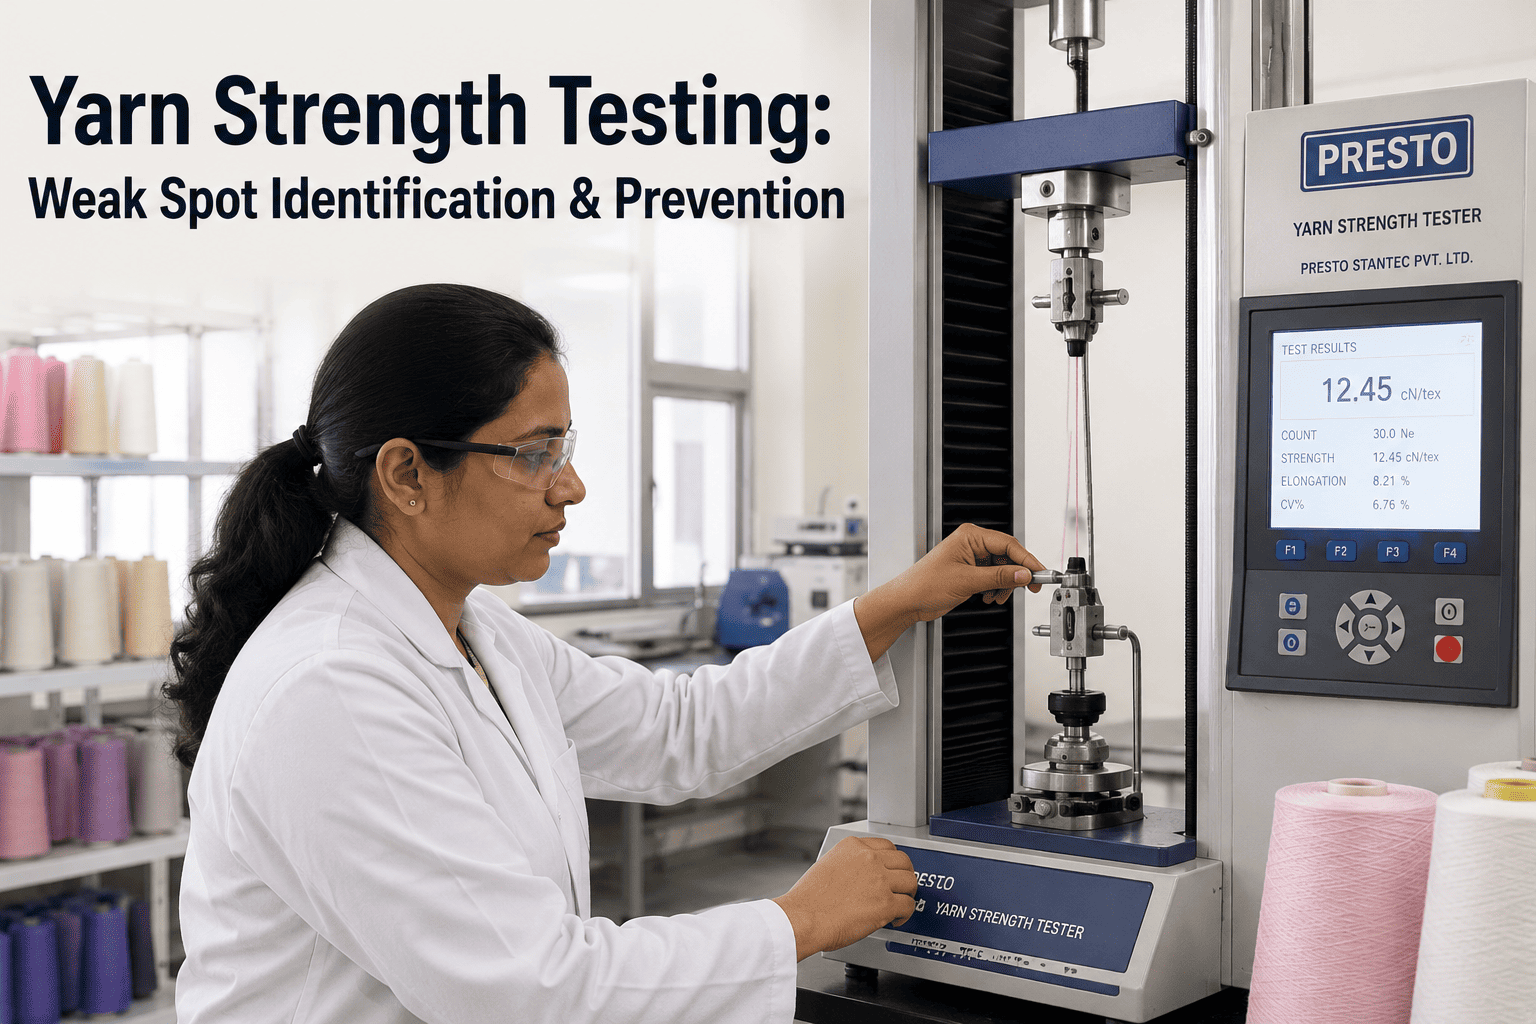
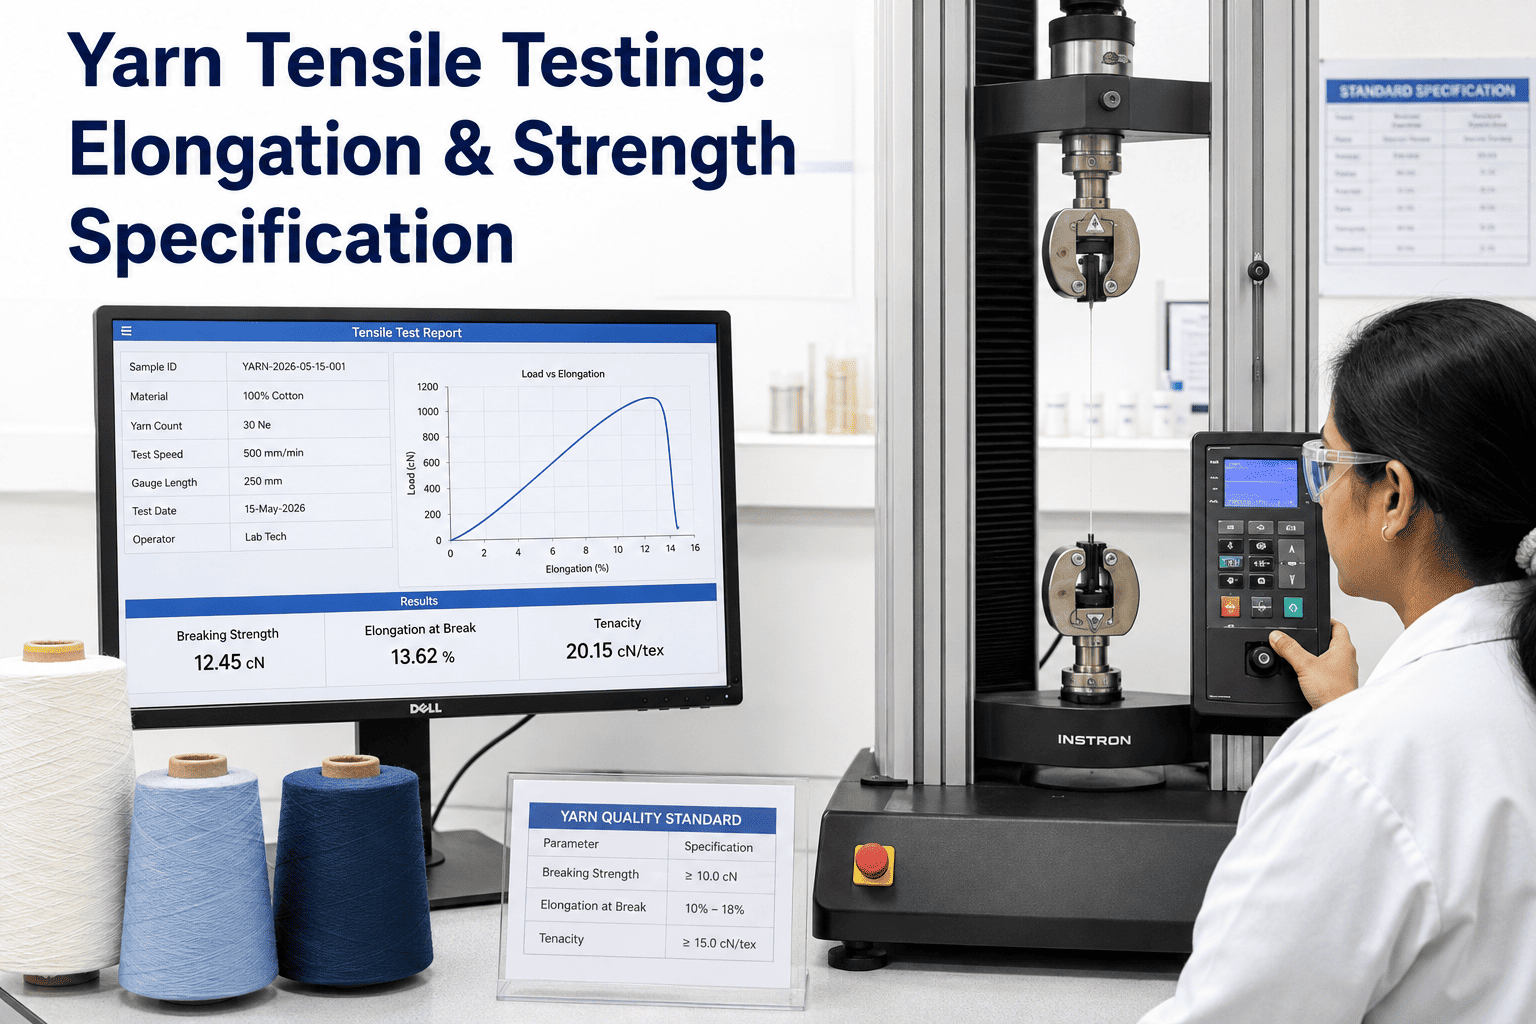
Measures strength and stretch before break. Poor tensile percentile typically reflects fiber quality, twist multiplier, or blend ratio rather than a single machine setting.
Common Classimat Fault Categories and Root Causes
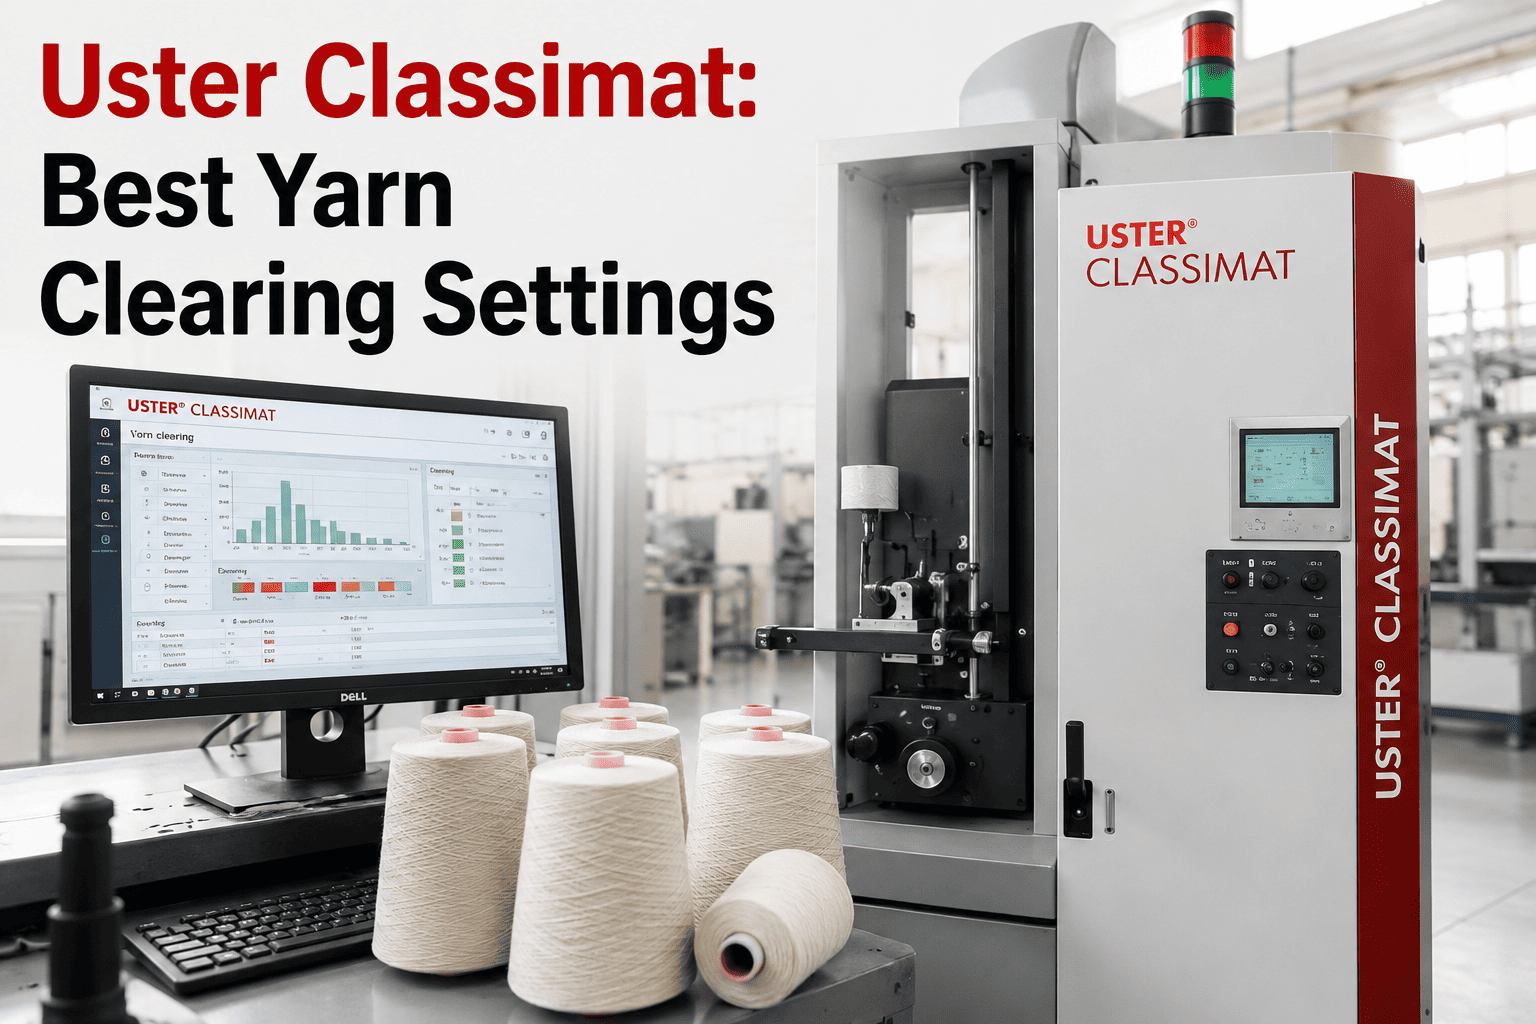
Classimat data groups faults by size and length, which makes the classification itself a diagnostic shortcut once a mill learns to read the pattern rather than just the count.
| Fault Class | Description | Typical Root Cause | Process to Investigate |
|---|---|---|---|
| Short Thick | Brief thick sections under 8 cm | Fiber fly or roller lapping | Drafting system, roller cleaning |
| Long Thick | Extended thick sections over 8 cm | Draft ratio error or doubling fault | Draw frame, roving frame |
| Thin Places | Sections with reduced mass | Fiber shortage or drafting wave | Carding, drafting rollers |
| Nep Clusters | Dense fiber entanglements | Fiber damage or trash content | Carding, blow room |
How to Choose a Target Percentile for Your Product Mix
Chasing the 5% percentile on every count is rarely the right commercial decision — it usually means running the frame slower and spending more on fiber than the product's selling price justifies. The right target depends on where the yarn is going next.
Premium knitwear and fine-count export orders typically require a 25% percentile or better across all four core parameters.
General woven apparel fabric usually performs acceptably at the 50% percentile, provided hairiness stays controlled for weaving efficiency.
Industrial and coarse-count yarns can often run at the 75% percentile without commercial consequence, freeing capacity for higher-value counts.
Any parameter drifting toward the 95% percentile on a product previously running at 50% or better signals a process fault, not normal variation.
Frequently Asked Questions
Q: How often should yarn be tested against Uster Statistics to catch drift early?
Most mills sample test once or twice per shift per machine, which means a gradual quality drift can run for many hours of production before the next scheduled test catches it. By the time a percentile shift shows up on the periodic report, a mill may have already produced and packed several lots at the lower quality level. Continuous inline monitoring closes this gap by tracking quality-relevant signals on every spindle position throughout the shift rather than on a sampled subset. Ask about continuous quality tracking with Book a Demo.
Q: Why do two mills producing the same count show different Uster percentiles?
Uster Statistics compare against a global population, but the specific fiber quality, machine condition, and process settings at each mill produce genuinely different outcomes even at the same nominal count. A mill running newer machinery with tighter roller settings and better-maintained travellers will consistently outperform one running older equipment on the same count, regardless of how skilled either operating team is. This is why percentile tracking is most useful as a trend over time within one facility rather than a single snapshot compared across facilities.
Q: What is the difference between CVm% and the Classimat fault count?
CVm% measures continuous mass variation along the entire yarn length, capturing gradual unevenness that never produces a discrete visible fault. Classimat counts discrete localized events — specific thick places, thin places, and neps — that a downstream customer would actually see or feel as an isolated defect. A yarn can have excellent CVm% and still carry a problematic Classimat fault rate if the process produces occasional severe events on an otherwise even background, which is why both parameters need separate benchmarking.
Q: Can hairiness be reduced without changing twist multiplier?
Yes, in most cases. Hairiness responds strongly to traveller condition, ring condition, and spindle speed, all of which can be adjusted independently of twist multiplier. A worn or incorrectly weighted traveller is frequently the largest single contributor to rising hairiness on an otherwise stable process, and replacing it typically produces a faster, cheaper improvement than adjusting twist settings that would also affect strength and elongation. Reach out through Support Contact to review hairiness trends for your spinning positions.
Q: How should a mill respond when a lot tests below its usual percentile?
The first step is confirming whether the shift is isolated to one machine or spindle position or reflects a broader process change, since the corrective action differs significantly between the two. An isolated position points toward a mechanical fault on that specific spindle, while a broad shift across many positions usually points toward a raw material or environmental change such as humidity or a fiber lot changeover. Tracing the pattern before adjusting settings prevents chasing the wrong variable and losing additional production time.
Stop Waiting for the Next Sample to Find Out Where You Stand
See live Uster percentile tracking running against your own spinning data, updated continuously through the shift.