A winding room supervisor at a ring-spinning mill pulls last night's clearer report and finds the same story again — efficiency down two points on three machines, and nobody can say whether it is the clearing curve, the raw cotton lot, or a drafting fault upstream. The Classimat report sitting in the quality office has the answer, but it is printed once a shift and read by one person. Ninety percent of the mill never sees the fault classes driving their downtime. Book a demo to see live Classimat fault data connected across your spinning and winding floor.
Uster Classimat Yarn Fault Classification — Reading the Fault Chart and Setting the Clearing Curve That Actually Works
Classimat divides seldom-occurring yarn faults into standard classes by cross-section and length. Getting the clearing curve right means understanding exactly which classes are objectionable for your yarn count and end use, not applying a factory-default setting across every article.
Imperfections Are Frequent. Faults Are Rare. The Classimat System Exists for the Rare Ones
Every spun yarn carries variation. Thin places, thick places, and neps that occur at high frequency are imperfections, tracked continuously on the Uster Evenness Tester and reported per thousand metres. Faults are a different animal entirely — seldom-occurring, larger deviations of a hundred percent or more in cross-section over a length of one millimetre or longer, the kind that shows up as a visible defect in the finished fabric and triggers a customer claim months after the yarn shipped.
The Classimat exists to catch that second category. Because faults occur rarely, they cannot be represented meaningfully as an average — a mill needs the actual count, sorted into standard classes, so a clearer can be set to remove only the faults that matter and leave winding efficiency intact.
This distinction matters commercially as much as technically. A yarn lot can carry an excellent evenness result and still generate customer complaints if its fault-class distribution is poor, because the evenness figure averages out exactly the rare, severe deviations a fabric inspector will spot on the roll. Treating Classimat data as a secondary check rather than a core acceptance criterion is one of the most common gaps between a spinner's internal quality sign-off and a buyer's actual experience of the yarn.
From 16 Classes to Full Outlier Detection — How Classimat Generations Expanded the Fault Chart
Reading the 23-Class Fault Chart — Short Thick, Long Thick, and Long Thin
The core Classimat chart groups faults by cross-sectional increase and length into three families. Short thick faults span classes A through D, split further by severity into A1–A4, B1–B4, C1–C4 and D1–D4 — sixteen classes in total measuring faults from +100% up to +400% cross-section over lengths from 1mm to 8mm. Long thick faults occupy classes E, F and G, covering faults of lower cross-section increase but extended length, up to 80cm and beyond. Long thin faults sit in classes H and I, representing sustained drops in yarn mass that weaken the yarn far more than an equivalent thick fault.
Why the Classimat Report Sitting in the Quality Office Is Not the Same as a Fault-Class Signal the Floor Can Act On
Most mills already own the data this article describes — the clearer generates a full fault-class breakdown every shift. The gap is distribution, not measurement. A printed report reviewed once a day by one quality engineer means a rising trend in long-thin faults on machine 14 goes unnoticed for two shifts, by which point the winding room has already run through several doffs at a clearing curve that no longer matches what the yarn is actually producing.
Connecting Classimat output through OPC-UA or a direct database link into a live dashboard changes that lag entirely. A supervisor sees fault-class counts trending by machine and article in real time, gets flagged the moment a class crosses its objectionable threshold, and can trace a spike back to a specific doff, shift, or raw material lot before it reaches the winding stage — not after a customer complaint arrives months later citing a fabric-stage defect nobody in the mill connected back to its source.
Every Article Needs Its Own Clearing Curve, Not the Factory Default
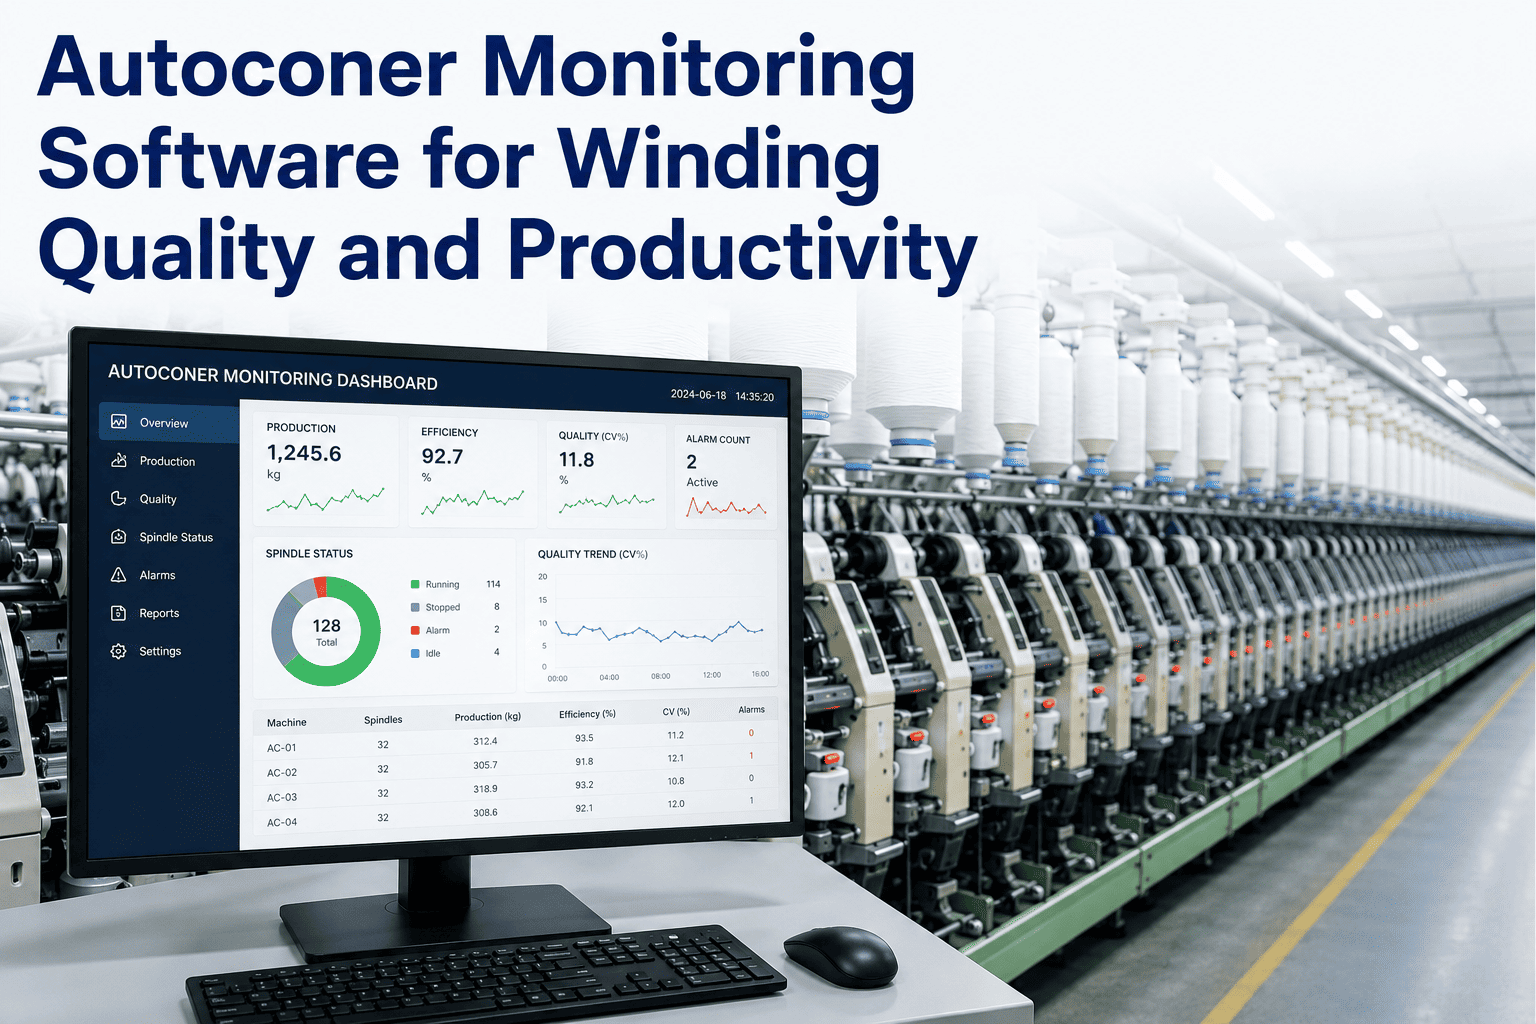
A dashboard pulling live Classimat data by machine, article, and shift shows exactly which fault classes are trending before they turn into a customer claim.
Setting the Clearing Curve — Balancing Fault Removal Against Winding Efficiency
A clearing curve is a plot of sensitivity against reference length, drawn on the winding clearer, that decides which faults get cut and rewound as a knot. Set the curve too tight and efficiency collapses under excessive cuts on faults nobody downstream would notice. Set it too loose and objectionable faults pass straight into the fabric. The right curve depends entirely on the end use — a fine circular-knit yarn tolerates almost nothing in the long-thin classes, while a coarse denim yarn can tolerate short thick faults that would be unacceptable in a fine poplin.
| End Use | Critical Classes | Typical Clearing Approach | Efficiency Priority |
|---|---|---|---|
| Fine Circular Knit | H2, I2, D3, D4 | Tight on long thin and heavy short thick | Medium |
| Woven Shirting | C3, C4, E, G | Moderate on both thick and thin families | Medium-High |
| Denim / Coarse Weave | E, G, H2, I2 only | Loose on short thick classes A–C | High |
| Sewing Thread | All long thick and long thin | Very tight across every class | Low |
What Each Fault Family Usually Means Upstream
Why Sampling Method and Conditioning Change the Fault Count You See
A Classimat result is only as reliable as the package selection feeding it. Testing a handful of packages pulled from the same spindle position on the same shift will consistently understate the true fault rate of a lot, because faults cluster by spindle condition, roller wear, and raw material batch rather than distributing evenly across every package produced. A representative sample draws packages across positions, shifts, and doff cycles so the fault-class count reflects the lot as a whole rather than the cleanest corner of it.
Conditioning matters just as much as sampling. Cotton yarn tested outside the standard atmosphere of 65% relative humidity and 20°C picks up moisture-driven variation in both mass and fault detection, since a capacitive sensor reads dielectric changes that shift with moisture content. Mills that skip conditioning and test straight off the winding machine typically see fault counts drift shift to shift for reasons that have nothing to do with actual yarn quality — and chase phantom process problems as a result. A fifteen-minute standard-atmosphere hold before testing removes that noise from the data entirely.
Turning Fault-Class Data Into a Shared Language With Weavers and Knitters
Yarn quality disputes between spinner and buyer usually happen because each side is judging quality against a different, unwritten standard. Classimat classification solves that by giving both parties an objective reference — a buyer can specify a maximum count per class per unit length rather than relying on a subjective inspection of a delivered lot, and a spinner can prove conformance with the same report used to set the clearing curve in the first place.
The more mature version of this agreement ties acceptance limits to the buyer's actual process rather than a generic industry table. A circular-knit customer running fine gauge machines cares intensely about long-thin classes and barely about short thick faults their machine tolerates easily; a denim weaver cares about the opposite. Spinners that segment their clearing curve and their buyer agreements by end use, instead of running one blanket specification across every customer, consistently see fewer claims and fewer unnecessary re-clears eating into winding efficiency.
Questions Spinning and Winding Teams Ask About Classimat Fault Classification
Turn the Classimat Report Into a Live Signal Your Whole Floor Can Act On
Connect spinning, winding, and quality data into one view, track fault-class trends by machine and article in real time, and set clearing curves based on evidence instead of a factory default.