Average yarn strength can look perfectly acceptable on a spec sheet while the yarn still breaks constantly on the loom or knitting machine, because an average hides the weak spots — the short segments along the yarn's length where strength drops well below the mean, often caused by a thin place, a slub, or a fiber inconsistency from spinning. A single weak spot every few hundred meters is invisible to a bulk average test but is exactly where the yarn will fail under the tension cycling of weaving or the repeated stress of knitting. Strength testing that only reports an average, without characterizing the distribution and the weak tail of that distribution, misses the detail that actually predicts breakage. Mills that want to see how weak-spot analysis on incoming yarn correlates with downstream breakage can book a demo to walk through the connection on real production data.
YARN QUALITY · STRENGTH TESTING
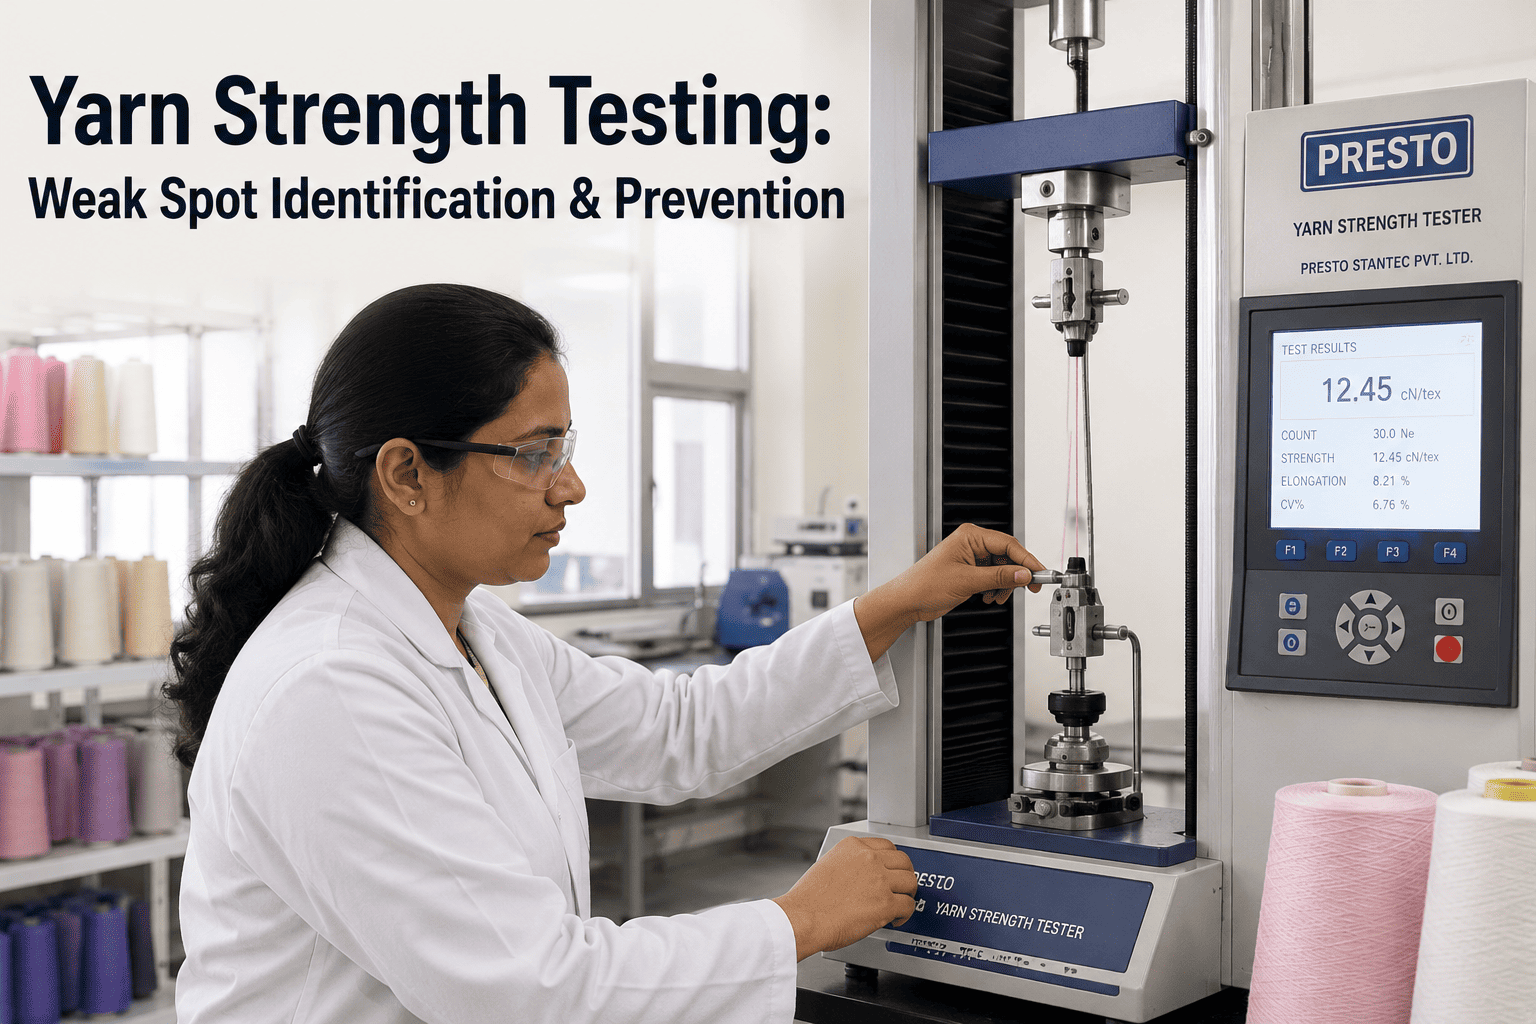
Yarn Strength Testing: Finding the Weak Spots Before They Find the Loom
Single yarn strength, lea strength, and weak-point analysis for fewer breaks in weaving and knitting.
Avg ≠ Safea passing average strength result can still hide breakage-causing weak spots
2 Testssingle yarn strength and lea strength answer different quality questions
30–50%of original yarn strength typically lost by the time it reaches loom take-up
Batch Levelweak spot patterns often trace back to a specific spinning batch or machine
Why an Average Strength Number Isn't Enough
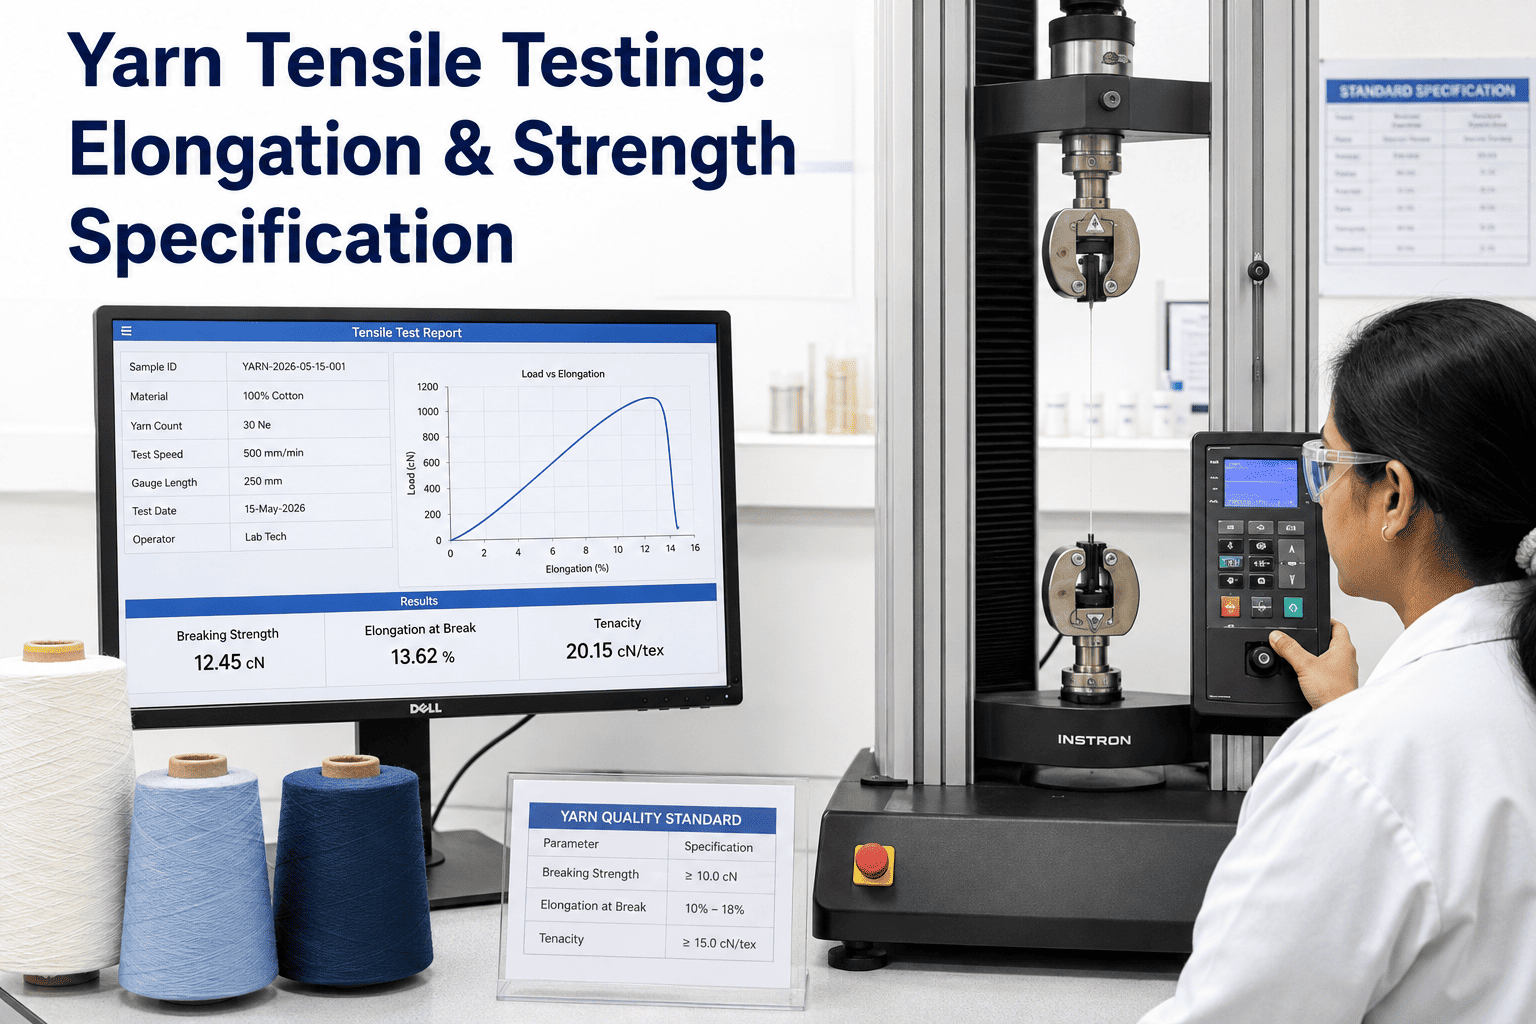
Two yarn lots can report the identical average tenacity and still perform completely differently on the loom, because one has a tight, consistent strength distribution while the other has occasional severe weak spots pulling the same average down from a higher baseline. Breakage is driven by the weakest points along the yarn's length, not by the average, which is why a complete strength testing approach looks at variability and outliers, not just the mean.
Single Yarn Strength TestingTests individual short lengths of yarn to failure, one at a time, building a distribution that shows both the average strength and the spread — including the weakest results in the sample. This is the test that reveals weak spots.
Lea Strength TestingTests a bundled skein — a "lea" — of many yarn strands together, producing a single combined strength figure. Faster and useful for bulk quality control, but it averages away the individual weak points a single yarn test would catch.
Mapping Weak Spots Along the Yarn's Length
Illustrating strength as a continuous map along a length of yarn — rather than a single number — makes clear why weak-spot testing matters: most of the length tests well within normal range, but a small number of short segments test far below it, and those segments are where breaks concentrate under load.
Illustrative Strength Map Along 500m of Yarn
Within normal strength rangeWeak spot — below breakage threshold
CORRELATE WEAK SPOTS WITH ACTUAL LOOM BREAKAGE
See Whether Your Incoming Yarn Testing Predicts Real Breakage
Connect strength test data by lot to downstream loom or knitting machine break rates and find out which suppliers or batches need attention.
Choosing the Right Test for the Question You're Asking
Neither test is universally "better" — each answers a different quality question, and a mature yarn quality program uses both, applying lea testing for fast bulk screening and single yarn testing when weak-spot investigation is genuinely needed.
| Question | Right Test | Why |
|---|
| Is this incoming lot roughly on-spec? | Lea Strength | Fast, low-cost bulk screening for gross quality issues |
| Why does this lot keep breaking on the loom? | Single Yarn Strength | Reveals weak spots a bulk average would hide |
| Is a specific spinning machine producing weak yarn? | Single Yarn Strength | Traces weak-spot frequency back to source equipment |
| Are we meeting contract strength specs? | Lea Strength | Matches the metric most textile contracts specify |
A Prevention Workflow: From Weak Spot to Root Cause
Finding weak spots is only useful if it leads somewhere — a testing program that identifies weak yarn but never traces it back to a cause just generates data without preventing the next batch from having the same problem.
1Sample and TestSingle yarn strength testing on a representative sample from each incoming lot or spinning batch.
2Flag Weak Spot FrequencyLots with weak spot frequency above the mill's tolerance threshold are flagged for investigation.
3Trace to SourceCross-reference flagged lots against spinning machine, shift, and raw material batch to find the pattern.
4Correct at SourceFeed findings back to spinning — drafting settings, roller maintenance, or raw material sourcing.
Setting Strength Thresholds by End Use
The acceptable strength and weak-spot tolerance for a yarn depends heavily on what it will be woven or knitted into and at what speed — a yarn destined for a high-speed air-jet loom needs a tighter tolerance than the same count destined for a slower, gentler knitting process, because the mechanical stress it will face differs significantly.
| End Use | Mechanical Stress Level | Weak-Spot Tolerance |
|---|
| High-Speed Air-Jet Weaving | High — rapid shed cycling and insertion forces | Tight — low tolerance for weak spots |
| Conventional Shuttle Weaving | Moderate | Moderate tolerance |
| Circular Knitting | Lower — gentler yarn path through needles | Wider tolerance generally acceptable |
| Warp Knitting | Moderate to high depending on gauge | Moderate to tight tolerance |
Frequently Asked
Yarn Strength Testing — Common Questions
What's the practical difference between single yarn strength and lea strength testing?
Single yarn strength testing pulls individual short lengths of one strand to failure, one at a time, which builds a distribution showing both the average and, critically, the weakest results in the sample — the weak spots that a bulk average would hide. Lea strength testing bundles many strands of yarn together into a skein and tests that bundle as a whole, producing one combined figure that is faster to run and useful for routine bulk screening, but it cannot reveal an individual weak point because the surrounding strong strands carry the load when one weak strand in the bundle would otherwise fail first. Both have a place — lea testing for fast routine checks, single yarn testing when weak-spot investigation is genuinely needed.
How do we know if our yarn's weak-spot frequency is actually a problem, or just normal variation?
Some strength variation along any yarn's length is normal and expected — no spinning process produces perfectly uniform yarn — so the useful benchmark is not zero weak spots but a tolerance threshold set against the mill's own historical breakage data. Tracking weak-spot frequency against actual downstream loom or knitting breakage over enough lots to see the correlation lets a mill calibrate its own acceptable threshold, rather than importing a generic industry number that may not reflect the specific equipment speeds and yarn counts in use. A lot with a weak-spot frequency similar to lots that have historically woven without excess breakage is probably fine; a lot with a frequency well above that pattern is worth investigating before it goes to the loom.
Can strength testing predict breakage before the yarn ever reaches the loom?
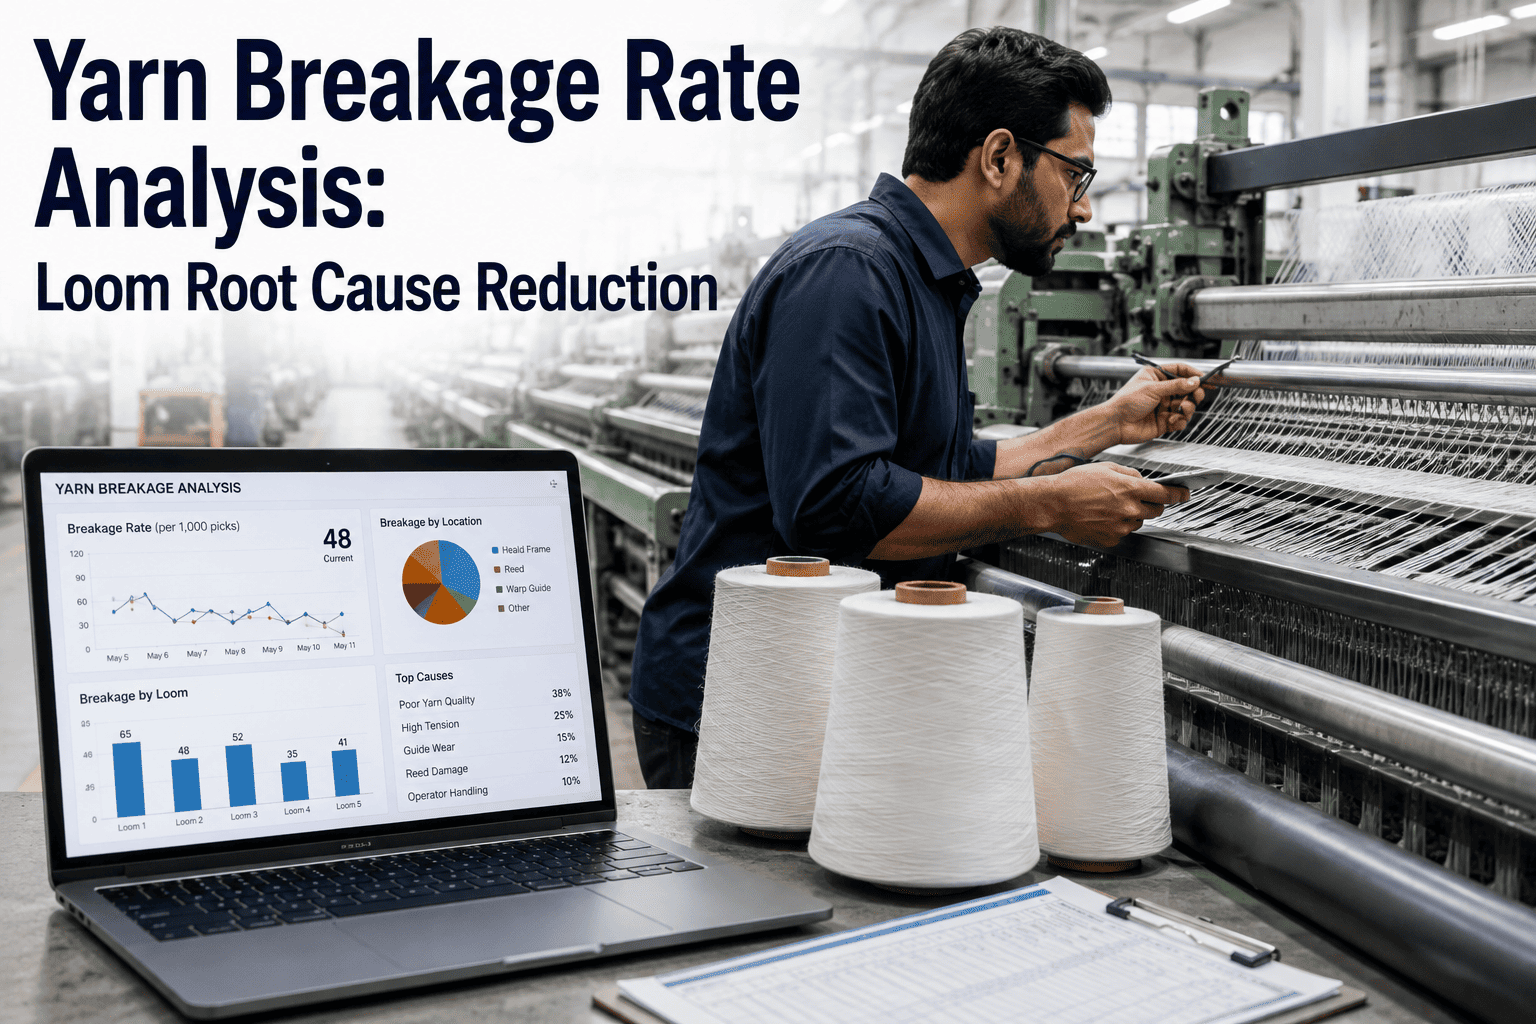
It can meaningfully reduce surprise, though it is a leading indicator rather than a perfect prediction, since yarn also loses strength during weaving itself through abrasion and size removal, and that additional loss compounds on top of whatever weak spots existed at the testing stage. A lot that tests with a high weak-spot frequency going into weaving is at meaningfully higher risk of breakage than a lot with a clean strength profile, even before accounting for weaving-stage stress, which is why incoming testing is worth doing even though it cannot catch every break that will eventually occur.
How often should incoming yarn be tested — every lot, or a sampling schedule?
Testing every incoming lot is the more thorough approach and is generally advisable for yarn feeding critical or high-speed processes, since a single bad lot on a high-speed air-jet loom can generate a disproportionate amount of downtime relative to the cost of the test. For lower-risk applications or suppliers with a long track record of consistent quality, a statistical sampling schedule — testing a defined percentage of lots rather than all of them — can balance testing cost against risk, provided the sampling rate is revisited if breakage patterns start trending upward on that supplier's yarn.
If weak spots are traced back to a specific spinning machine, what's the typical next step?
The investigation usually moves to the drafting system first, since inconsistent drafting is one of the most common sources of thin places and weak spots in ring-spun yarn, checking roller settings, apron condition, and drafting zone alignment against specification. Fiber-related causes — contamination, inconsistent blend ratios, or moisture content variation in the raw material feeding that machine — are the next most common source and are worth checking in parallel rather than only after ruling out the machine itself. Mills building this kind of traceability from spinning machine through to loom-side breakage can get a walkthrough of the setup through
support.
FIND THE WEAK SPOTS BEFORE THEY BREAK ON THE LOOM
Connect Yarn Strength Data to Real Breakage Outcomes
Weak-spot analysis, lot-level tracking, and traceability back to spinning source — see it against your own quality data.