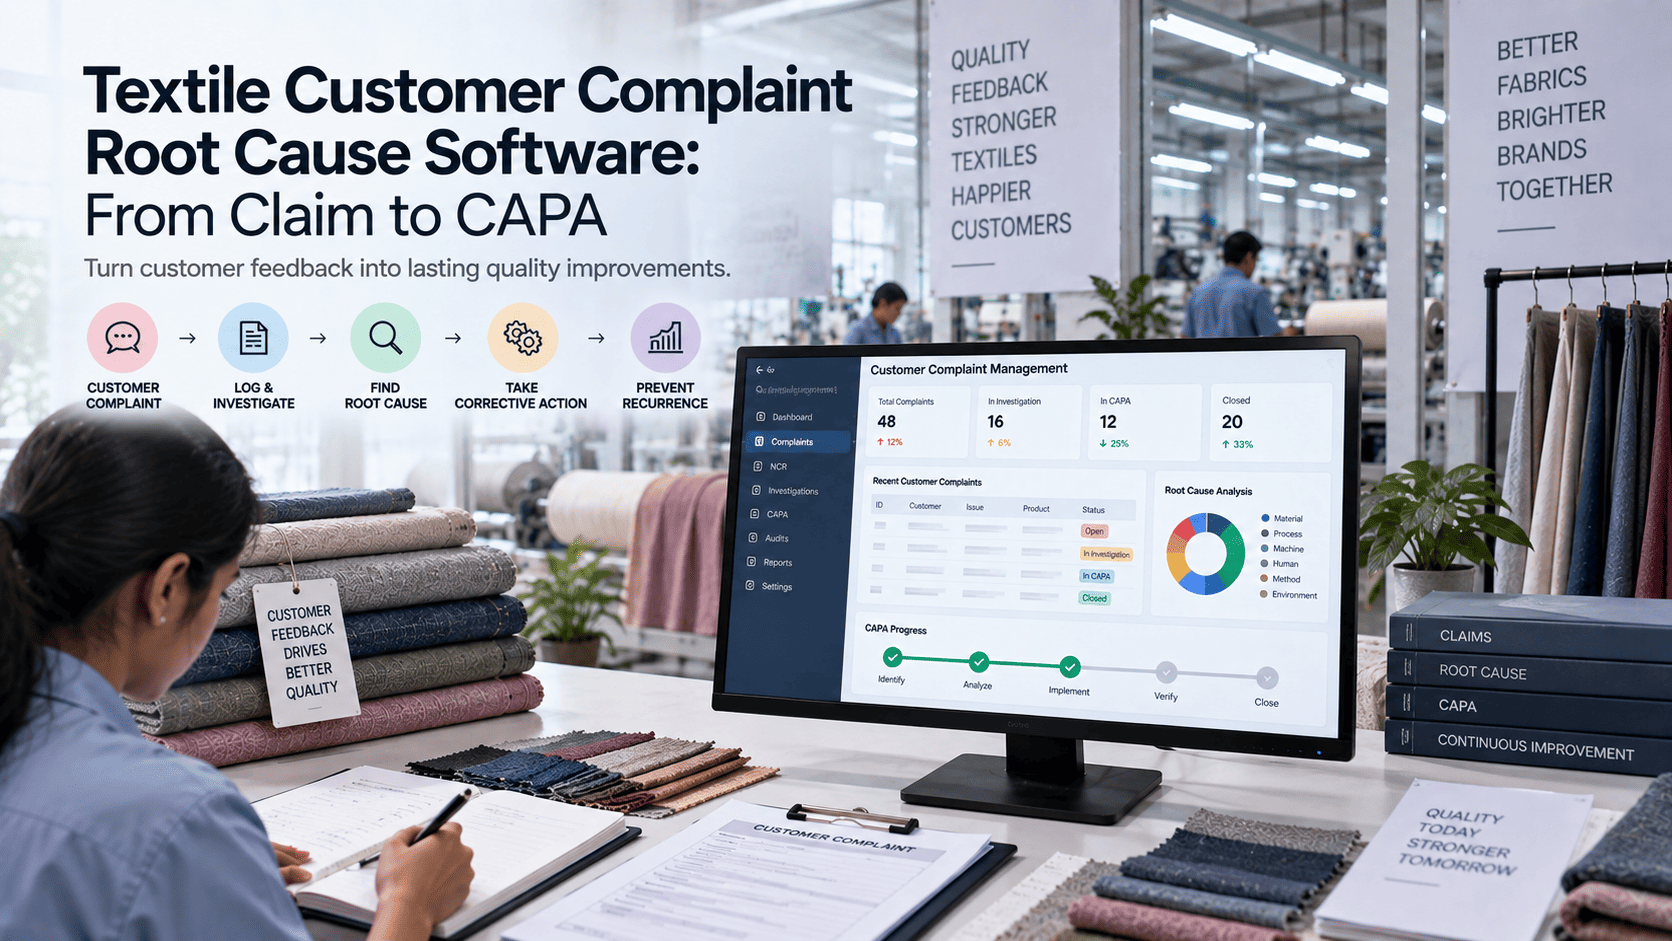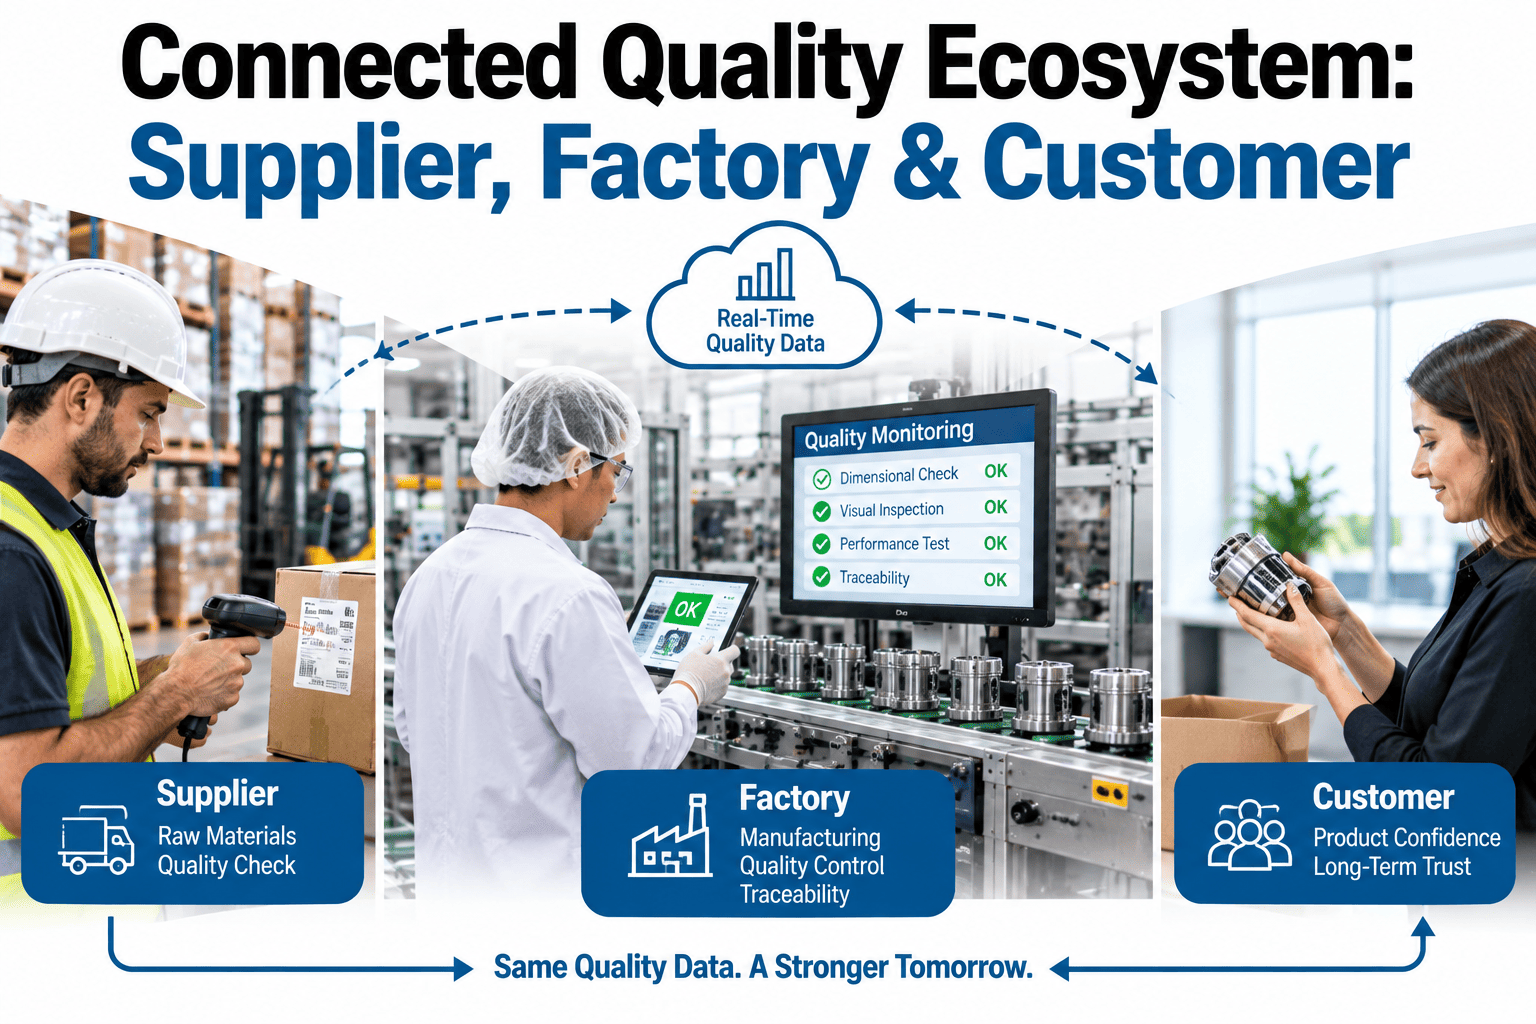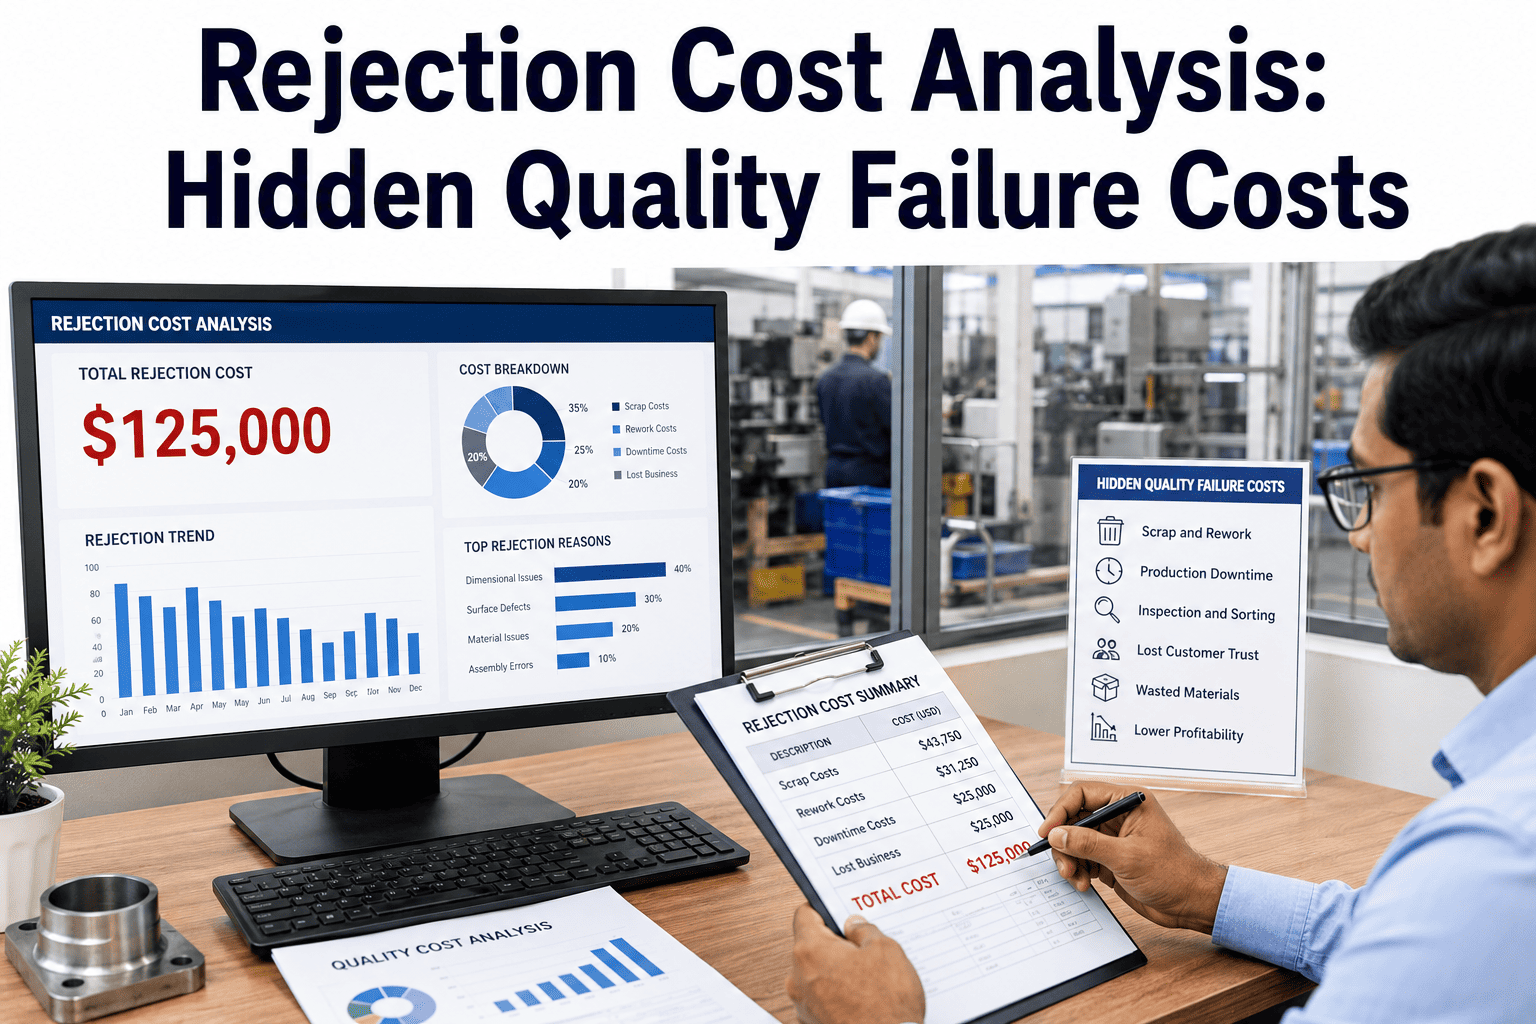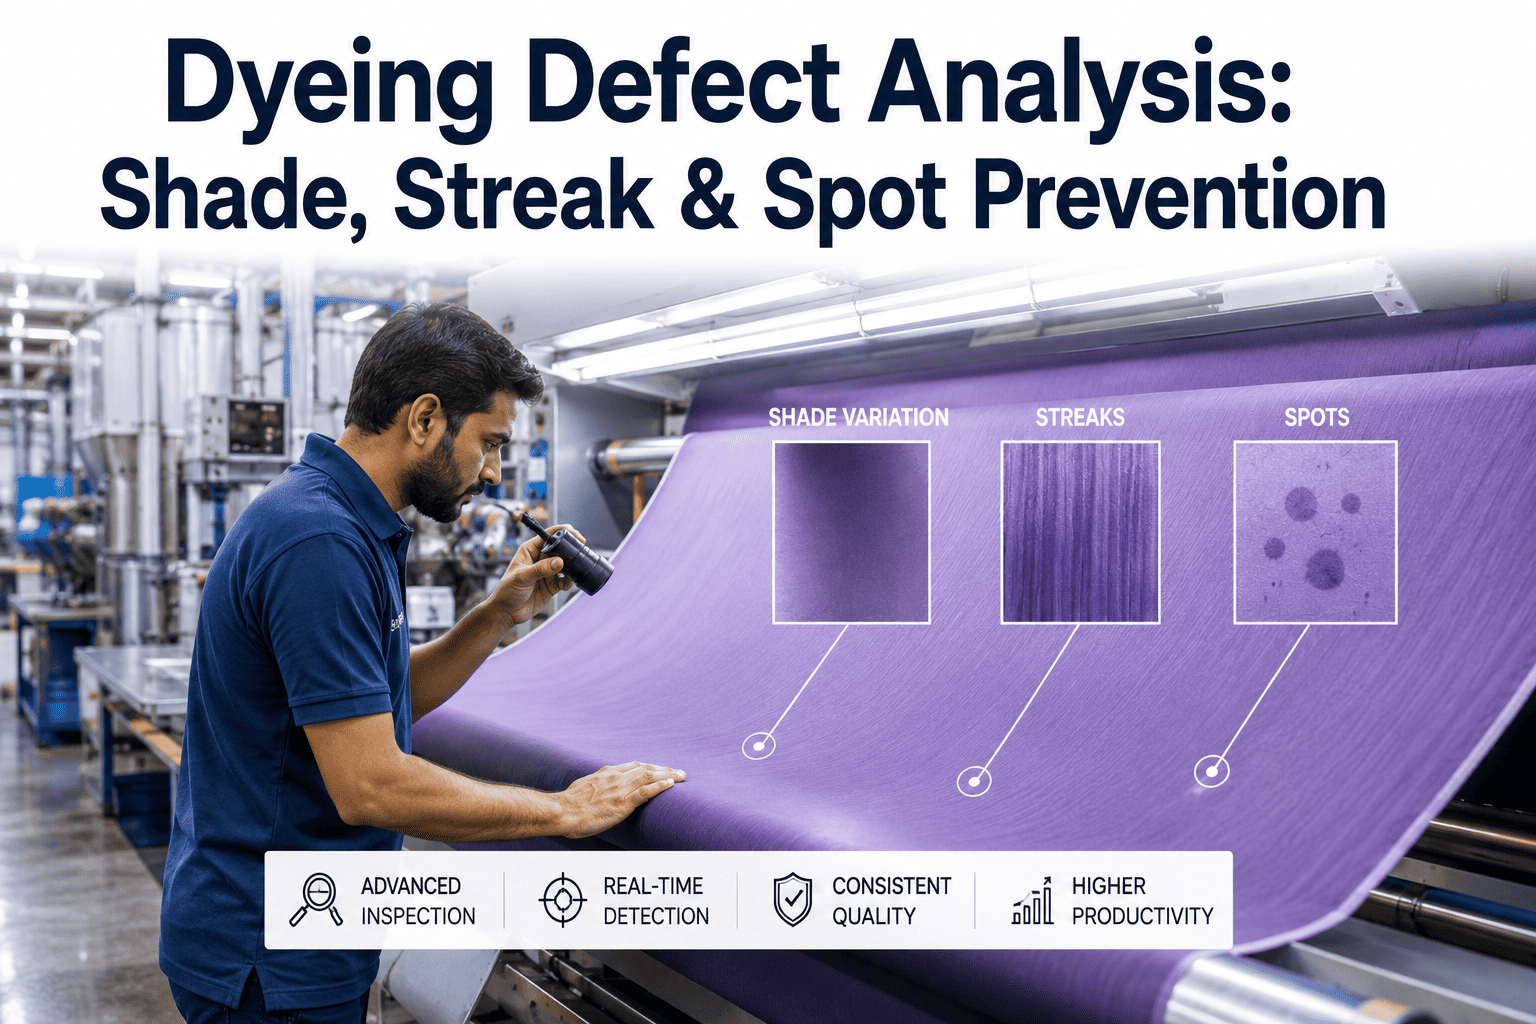
A customer complaint about fabric quality almost never arrives as an isolated event, even though it usually gets handled as one. A buyer flags a shade mismatch or a weaving flaw, someone issues a credit note or arranges a replacement shipment, and the file gets closed without anyone stepping back to ask whether this is the third complaint this quarter tracing back to the same loom, the same dye lot pattern, or the same finishing line. Treating each complaint as a standalone incident means the underlying process issue keeps producing the next complaint, and the next, while the business absorbs credit notes, replacement costs, and a slowly eroding relationship with a buyer who is quietly starting to shop other suppliers for their next order cycle. iFactory categorizes and trends customer complaints against the production data behind them, surfacing the recurring patterns a case-by-case response naturally misses, and you can book a demo to see how your own complaint history breaks down by root cause and by machine.
Most Complaint Processes Stop at Resolution, Not Prevention
A typical complaint workflow ends the moment the customer is satisfied. A prevention-focused workflow treats that same moment as the starting point for asking what produced the defect in the first place.
The two steps most complaint processes skip are exactly the two that determine whether the same issue shows up again next quarter, and skipping them is rarely a deliberate choice so much as a byproduct of measuring resolution speed instead of recurrence.
A Fast Resolution and a Prevented Recurrence Are Different Goals
Most quality teams are measured on how quickly a complaint gets resolved, which is a reasonable metric for customer satisfaction but a poor proxy for whether the underlying problem actually gets fixed. Resolving a complaint quickly usually means issuing a credit, arranging a replacement, or negotiating a partial acceptance, none of which require identifying why the defect occurred in the first place. Categorizing every complaint consistently by defect type, affected process stage, and probable cause turns a pile of individually resolved incidents into a dataset that can actually be analyzed for trends, which is the step that most operations skip entirely because nobody owns it as a distinct responsibility from the complaint response itself, and because the pressure to close tickets quickly rarely leaves room for the extra few minutes structured categorization actually takes to do properly.
See Which Defects Are Actually Driving Your Complaints
iFactory categorizes every complaint against defect type, process stage, and root cause, then trends them so recurring patterns surface before the fifth complaint instead of after it.
Where Fabric Complaints Actually Originate
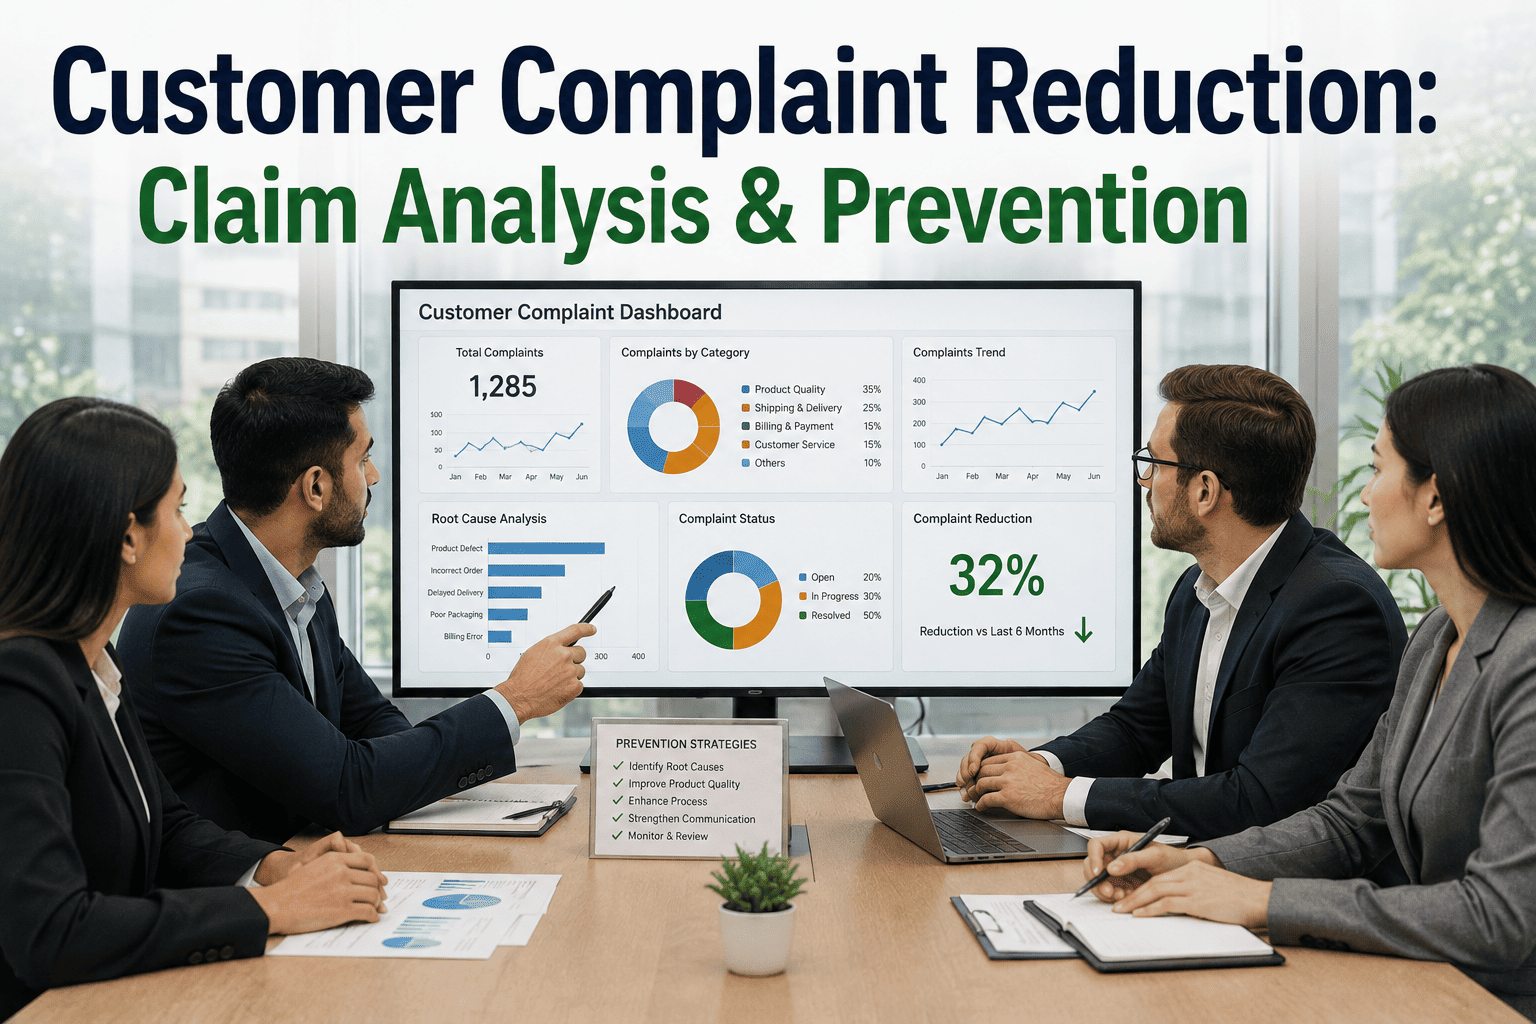
Across most textile operations, customer complaints cluster into a small number of recurring categories rather than presenting as an endless variety of unique problems, which is precisely why trending them by category is so effective at surfacing prevention opportunities that would otherwise stay hidden inside individually closed cases.
Approximate distribution based on common fabric complaint patterns across mixed-product textile operations; your own category mix is worth establishing directly from your complaint history.
The Question That Actually Prevents Recurrence
The single most valuable question a quality team can ask about a new complaint is not "how do we resolve this one" but "has this happened before, and if so, was the earlier cause ever actually fixed." Answering that question consistently requires complaints to be logged with enough structured detail to be compared against each other, which is exactly what an informal, notes-in-an-inbox complaint process usually cannot support. A structured trend view typically surfaces a small number of high-leverage patterns that would otherwise stay buried across dozens of individually closed tickets.
Not Every Complaint Is a Process Failure
Distinguishing a legitimate quality claim from a handling issue in transit, a misunderstanding of the agreed specification, or an unreasonable tolerance expectation matters both for accurate trending and for fair customer relationships. A validation step that checks the claim against the actual production and inspection record for that lot prevents two failure modes at once: conceding cost on claims that were never actually a production defect, and dismissing claims that genuinely were, either of which damages the relationship and distorts the trend data that later analysis depends on.
| Claim Type | Validation Check | Typical Outcome |
|---|---|---|
| Shade Mismatch | Compare against lab dip and inspection spectrophotometer reading | Confirmed or attributed to lighting or viewing conditions |
| Structural Flaw | Cross-check against inspection records for that specific roll | Confirmed as production defect or handling damage in transit |
| Dimensional Deviation | Compare against agreed specification and tolerance | Confirmed defect or specification misunderstanding clarified |
| Quantity Shortage | Reconcile against packing list and shipment documentation | Confirmed shortage or logistics discrepancy identified |
Prevention Data Is Also a Relationship Tool
Buyers who raise repeat complaints are not just evaluating whether an individual claim gets resolved fairly, they are quietly forming a judgment about whether the supplier actually learns from mistakes or simply pays them off one at a time. Being able to show a buyer that a specific complaint category has measurably declined since a corrective action was implemented does more for a long-term relationship than a fast credit note ever will, because it demonstrates the supplier is treating their complaint as a signal worth acting on rather than a cost to be absorbed and forgotten. This is particularly valuable during supplier review or requalification conversations, where buyers are increasingly asking for evidence of continuous improvement rather than just a clean recent track record.
The reverse is also true. A supplier that cannot show any pattern analysis behind repeated similar complaints signals, intentionally or not, that each complaint really is being treated as an isolated cost of doing business rather than information to be used. Over enough cycles, that perception alone can be enough for a buyer to start allocating volume elsewhere, independent of whether the underlying defect rate is actually improving or not, simply because the supplier cannot demonstrate the improvement in a way the buyer can see and verify.
Categorization Only Works If It Happens Every Time
The single biggest reason complaint trending fails in practice is not a lack of tooling, it is inconsistency at the point of intake. A complaint logged with full category, cause, and lot detail is useful data; one logged as a one-line note in an email thread is not, no matter how sophisticated the analysis layer built on top of it is. Building the habit of consistent, structured intake at the moment a complaint arrives, rather than trying to reconstruct that detail weeks later during a quarterly review, is what actually determines whether trend analysis produces anything actionable.
This is also where responsibility tends to fall through organizational cracks. Customer service teams are focused on resolving the immediate issue and keeping the buyer relationship intact, not on structured data entry, while quality teams may not see the complaint until it has already been resolved and details have been lost in translation. Assigning clear ownership for complete, structured intake, and making that intake step as low-friction as possible for whoever handles the first customer contact, closes a gap that otherwise undermines even a well-designed trending system.
Built for Teams That Own the Complaint-to-Prevention Loop
Questions Quality Teams Ask About Complaint Trending
Stop Resolving the Same Complaint Every Quarter
iFactory categorizes and trends customer complaints against production data so recurring issues surface early and get fixed at the source instead of resurfacing every quarter. Book a demo and bring your recent complaint history.