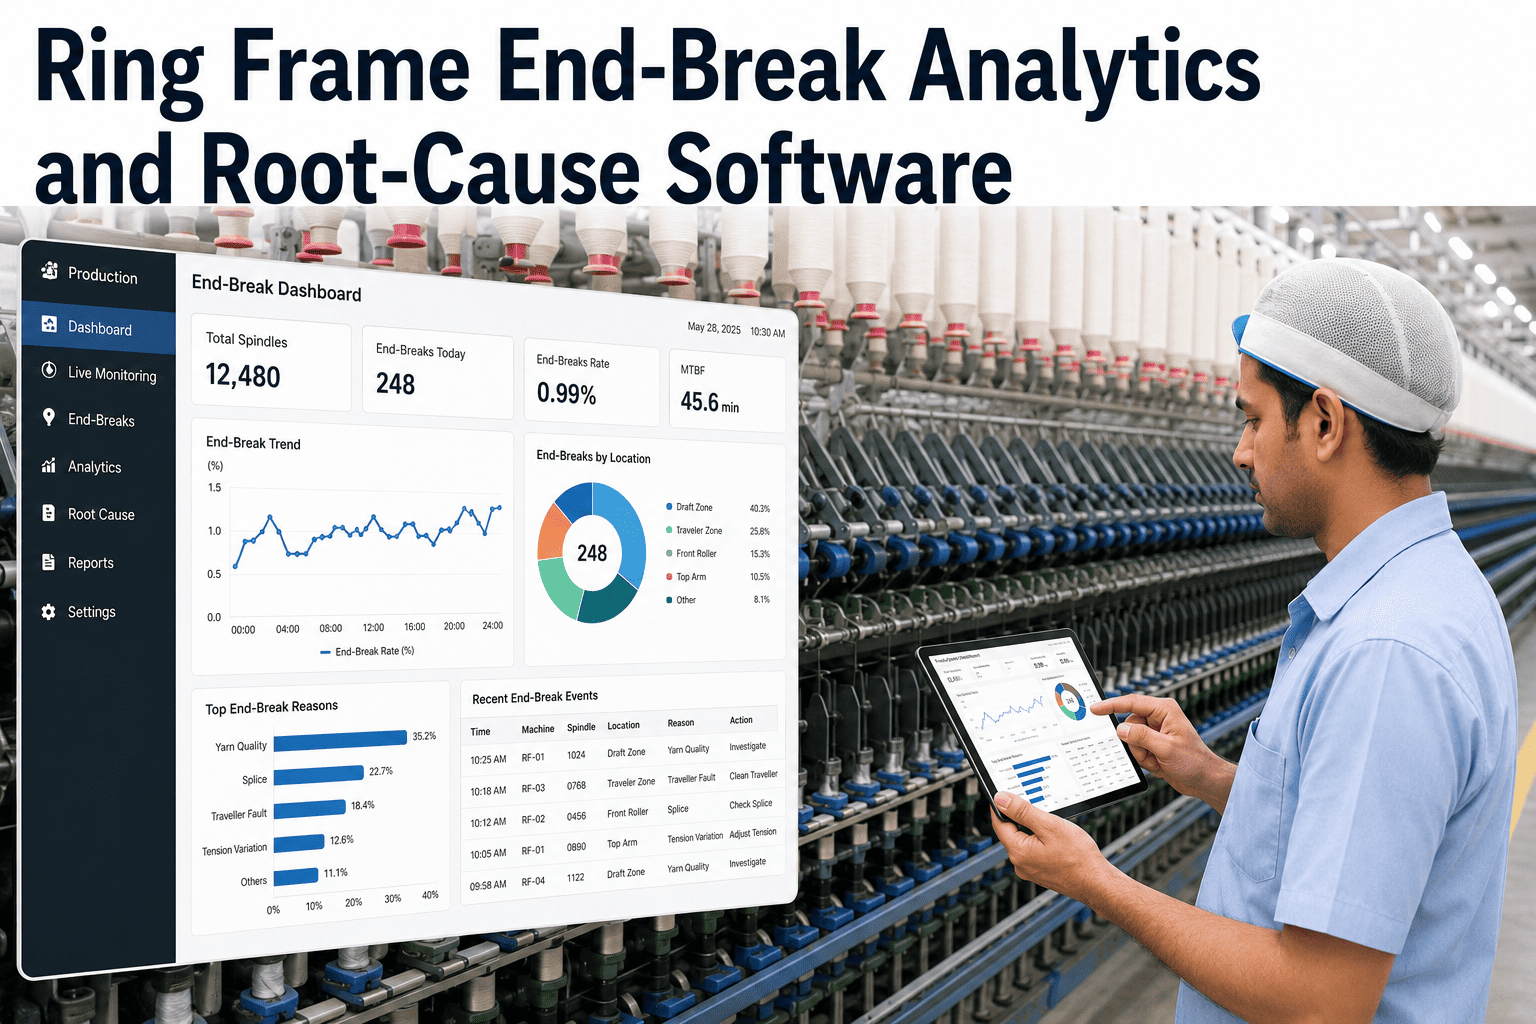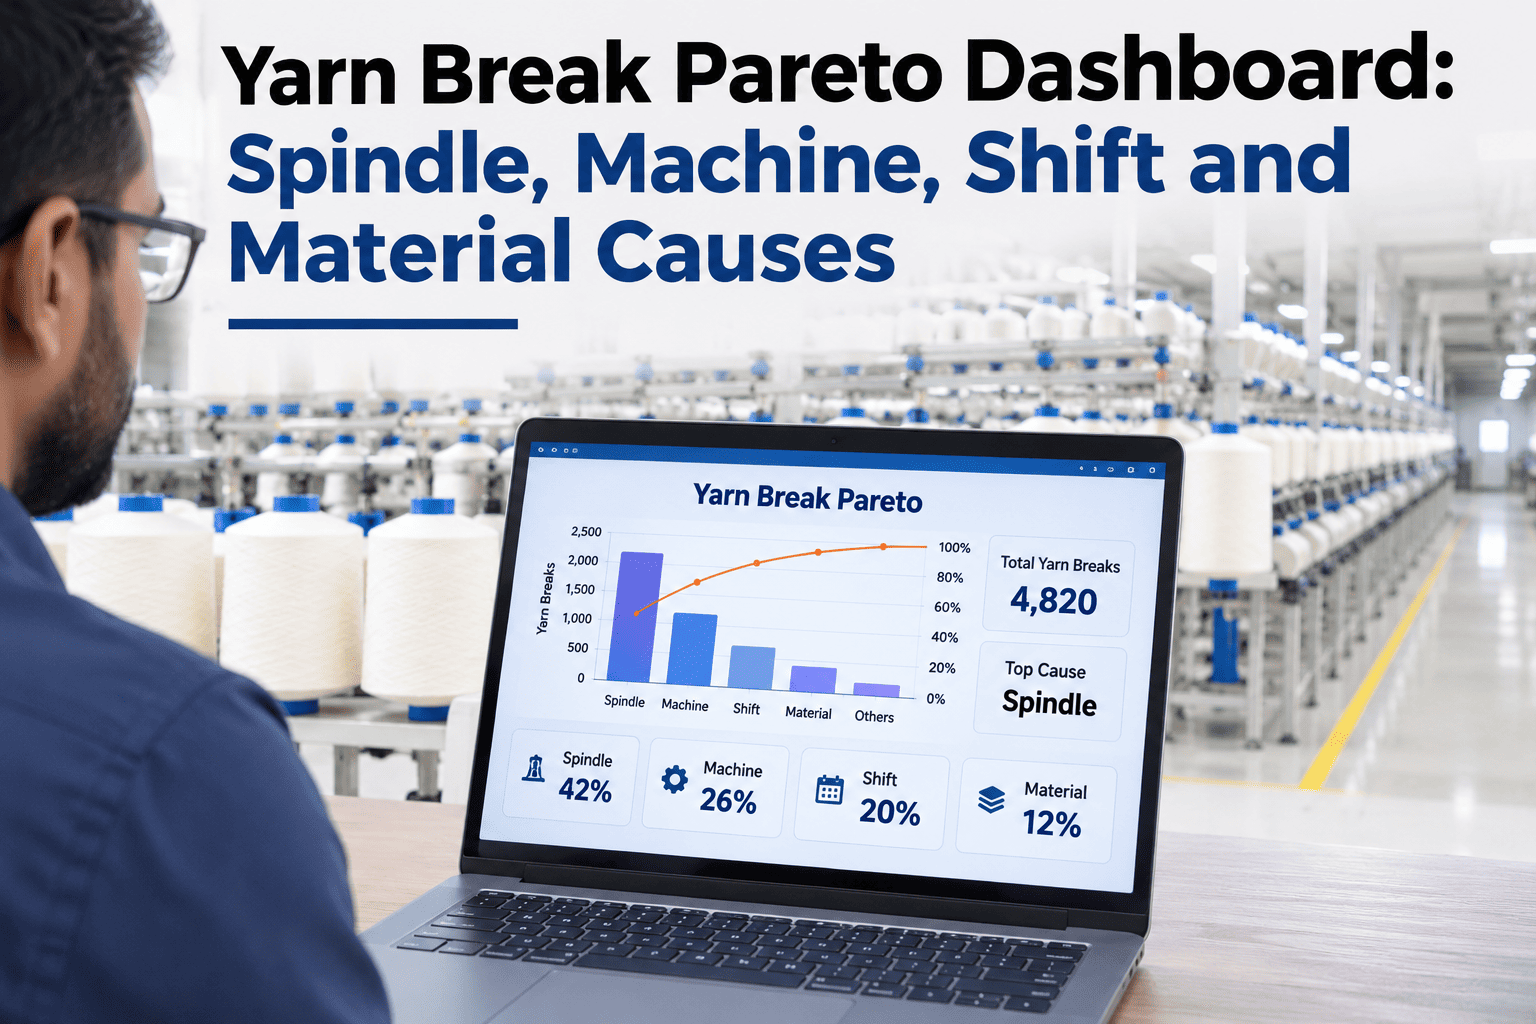
A plant-wide yarn break count tells you how disruptive breaks were overall, but it says nothing about where to focus — whether one specific machine is driving most of the losses, whether a particular shift runs a higher break rate, or whether a single yarn lot is responsible for a disproportionate share. A Pareto view broken out by spindle, machine, shift and material cause turns a single disruptive number into a ranked list of where corrective action actually belongs. Spinning mills that want their own breaks ranked this way can review a break Pareto built from their own production data with iFactory AI.
A Total Break Count Doesn't Tell You Where to Focus
iFactory AI ranks yarn breaks by spindle, machine, shift and material cause, so corrective action goes to the losses actually driving disruption.
Breaking Down a Single Number Into Four Rankings
The same total break count can hide very different underlying stories — concentrated on a few machines, spread evenly across a shift, or tied to a specific yarn lot. Each dimension answers a different question about where to act.
Illustrative Ranking by Machine
See Which Dimension Explains Your Own Break Rate Best
Share recent break logs and a short session will show whether machine, shift, spindle or material is driving your losses most.
A Composite Scenario: The Shift Pattern the Machine Ranking Missed
A mill's break Pareto by machine showed a relatively even distribution, suggesting no single machine was a clear outlier. Breaking the same data down by shift instead revealed one shift running a noticeably higher break rate across nearly every machine it operated, a pattern the machine-only view had completely hidden. The cause traced back to a setting difference in how that shift handled a specific changeover step, and standardizing the procedure across shifts closed most of the gap — a finding iFactory AI's team can help uncover in your own multi-dimension break data.
Why Checking Multiple Dimensions Together Matters
The most useful findings often come from combining dimensions rather than viewing each alone — a specific machine on a specific shift, or a specific material lot that happened to run on a specific machine. A dashboard that lets you cross-reference these, rather than viewing four separate single-dimension charts, surfaces patterns a single ranking would miss entirely.
Frequently Asked Questions
Find Out What's Actually Driving Your Break Rate
iFactory AI ranks yarn breaks by machine, shift, spindle and material lot in one dashboard. Book a walkthrough with your own production data.