Yarn strength test results arrive after the yarn is already made, which means a strength problem traced back to a specific spinning condition is discovered only after an entire lot has already run that way. Connecting fiber properties, machine settings and process conditions directly to strength outcomes as they happen lets a mill catch a developing risk before the full lot is affected, rather than after the test lab delivers bad news. Spinning mills that want their own strength risk flagged earlier can review a strength prediction model against their own process data with iFactory AI.
By the Time the Strength Test Comes Back, the Lot Is Already Made
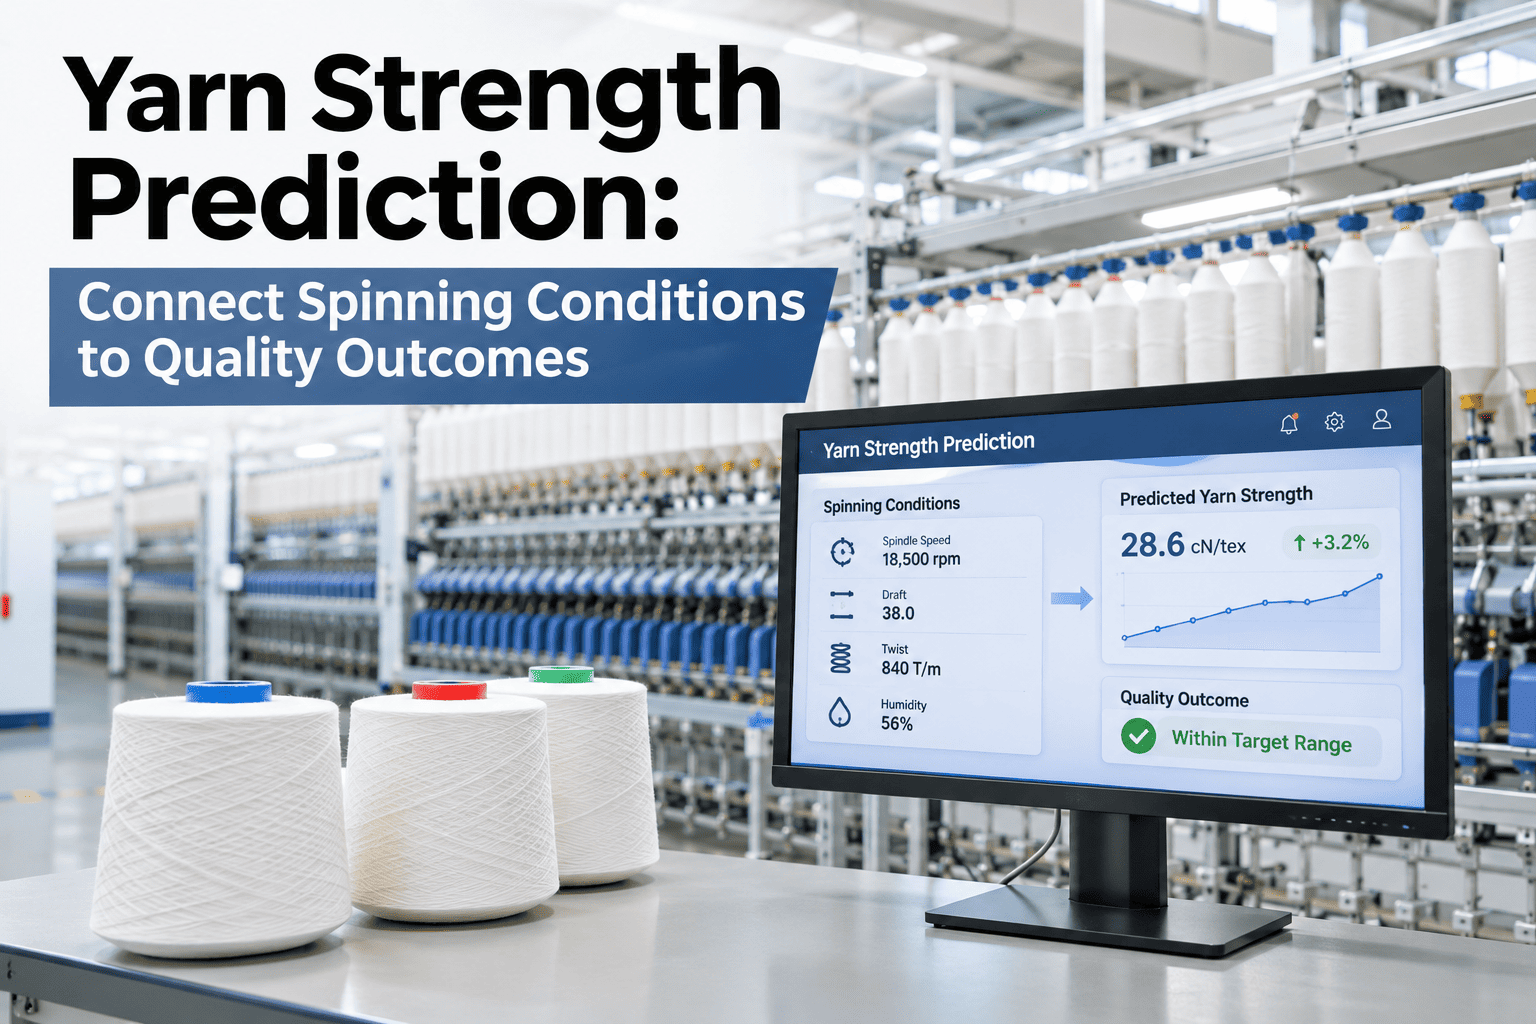
iFactory AI connects fiber properties, machine settings and process conditions to strength outcomes in near real time, flagging risk before the full lot runs.
What Actually Drives Yarn Strength Variation
Strength outcomes are not determined by a single variable — they are the combined result of fiber quality, how the fiber was prepared, and the specific spinning conditions it ran under. A correlation model's value is in connecting all three to the final result rather than examining each in isolation.
From Correlation to Early Warning
See What Your Own Strength Test History Reveals
Share past fiber, machine and test data and a short session will show which conditions correlate most with strength variation on your lines.
A Composite Scenario: The Weak Lot That Could Have Been Caught Mid-Run
A mill's strength test on a completed lot came back below specification, triggering a rejection and rework cycle that cost both material and time. Reviewing the process data afterward showed that twist level had drifted slightly below the normal range for that fiber blend partway through the run, a combination the mill's historical data showed had produced weak yarn before. With a correlation model checking live conditions against known risk patterns, that same drift would have been flagged partway through the run, before the full lot had been affected — a catch iFactory AI's team can help build from your own historical test data.
Why This Works Best as a Risk Flag, Not a Pass/Fail Prediction
A strength prediction model is not a replacement for the actual strength test — it is a way to flag elevated risk early enough to investigate while the lot is still running, rather than waiting for a definitive test result after the fact. Treating it as an early warning, confirmed by the real test, keeps the model useful without overstating its certainty.
Frequently Asked Questions
Catch a Strength Risk While the Lot Is Still Running
iFactory AI connects fiber, machine and process conditions to strength outcomes for earlier risk flagging. Book a walkthrough with your own historical data.